
Stocks & Equities

The market is in the middle of two possible future scenarios. The first a break of the February lows, the latter a break of the January highs in both the S&P and the Dow Industrial Average (Nasdaq 100 has already made new highs above January. With market confidence at extreme fear, analyst Paul Rejczak makes the case for a lower opening followed by a bounce – R. Zurrer for Money Talks
Fed Action Casts Shadow on Bullish Case for Stocks
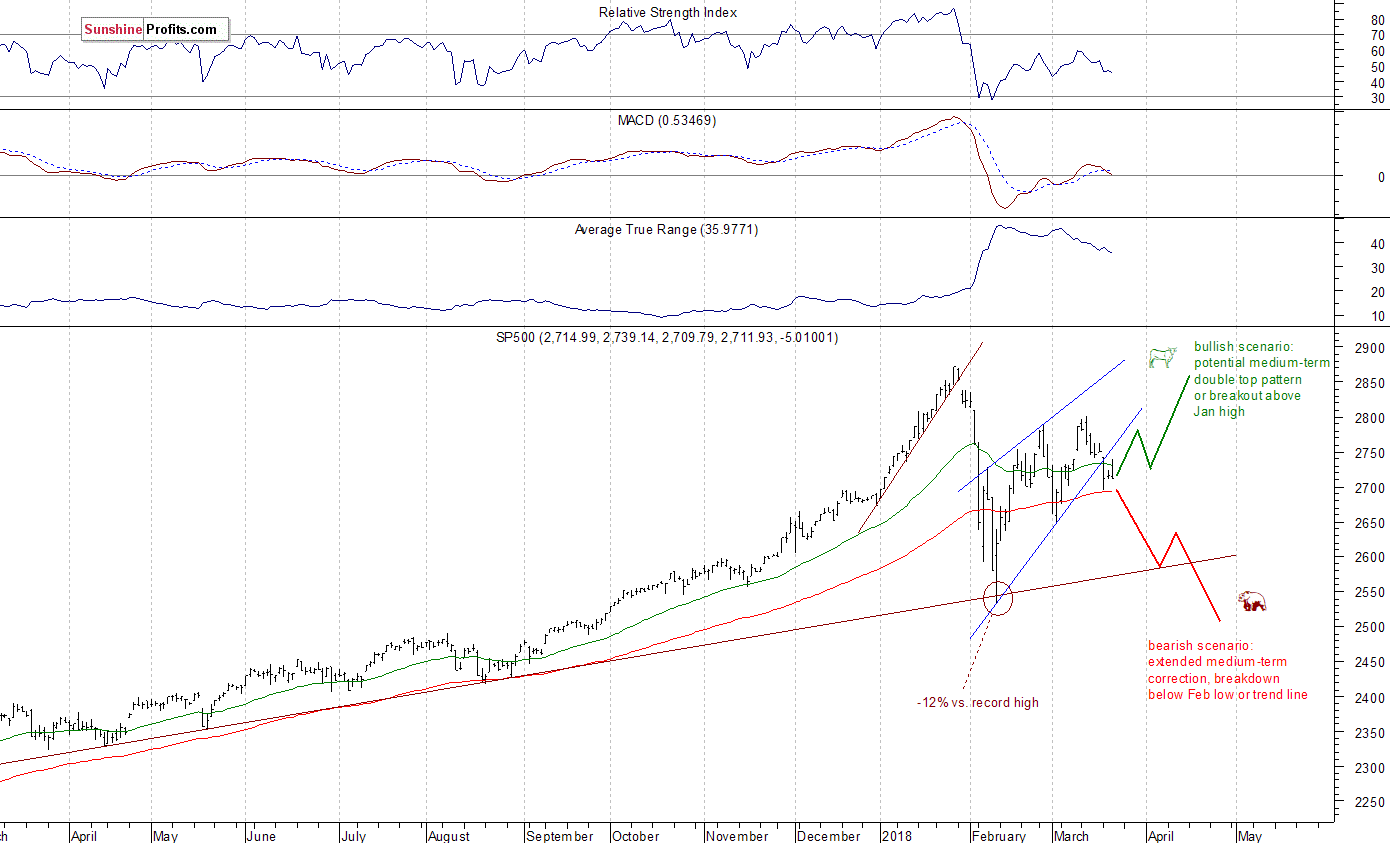
The main U.S. stock market indexes lost 0.2-0.3% on Wednesday’s following relatively brief rally after the FOMC‘s Rate Decision release. The S&P 500 index continued to fluctuate within its short-term consolidation. It is currently around 5.2% below January 26 record high of 2,872.87. The Dow Jones Industrial Average lost 0.2%, and the technology Nasdaq Composite lost 0.3%.
The nearest important level of resistance of the S&P 500 index remains at 2,740-2,750, marked by Monday’s daily gap down of 2,741.38-2,749.97. Yesterday’s daily high of 2,739.14 confirmed the importance of that resistance level. The next resistance level is at around 2,775-2,780, marked by last Wednesday’s daily high. On the other hand, support level is at 2,695-2,700, marked by Monday’s daily low, among others. Potential support level is also at 2,650-2,670, marked by previous local lows.
We can see that stocks reversed their medium-term upward course following whole retracement of January euphoria rally. Then the market bounced off its almost year-long medium-term upward trend line, and it retraced more than 61.8% of the sell-off within a few days of trading. Is this just an upward correction or uptrend leading to new all-time highs? The market is still in the middle of two possible future scenarios. The bearish case leads us to February low or lower after breaking below medium-term upward trend line, and the bullish one means potential double top pattern or breakout above the late January high. Monday’s sell-off made the bearish case more likely again. You should take noticeof a breakdown below potential rising wedge pattern. This over month-long trading range looks like an upward correction following late January – early February sell-off:
Stocks Set to Open Much Lower
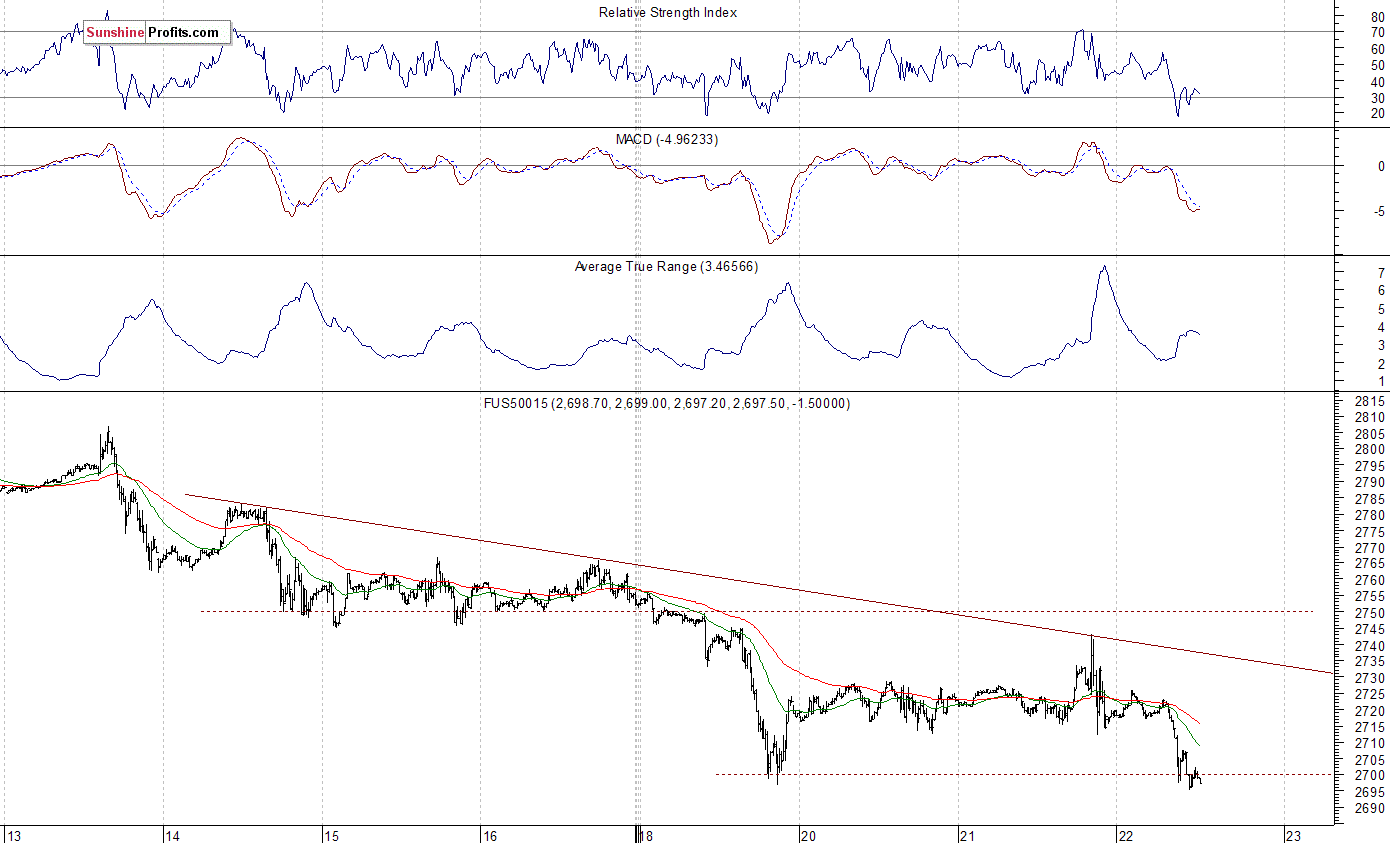
Expectations before the opening of today’s trading session are negative, because the index futures contracts trade 0.8-1.3% lower vs. their yesterday’s closing prices. The European stock market indexes have lost 0.7-1.0% so far. Investors will wait for some economic data releases: Initial Claims at 8:30 a.m., Flash Manufacturing PMI, Flash Services PMI numbers at 9:45 a.m., Leading Indicators at 10:00 a.m. The market is back at its Monday’s lows, so the overall sentiment worsened again. Will it break lower? If the S&P 500 index breaks below the support level of 2,700, it could continue towards the above-mentioned 2,650-2,670.
The S&P 500 futures contract trades within an intraday downtrend, as it extends its yesterday’s intraday move down. The nearest important level of support is at around 2,695-2,700, marked by Monday’s local low. The next support level is at 2,680, among others. On the other hand, resistance level is at around 2,710-2,715, marked by recent fluctuations. The resistance level is also at 2,725-2,730. The futures contract trades below its short-term downward trend line, as we can see on the 15-minute chart:
Nasdaq Breaks Below 6,800
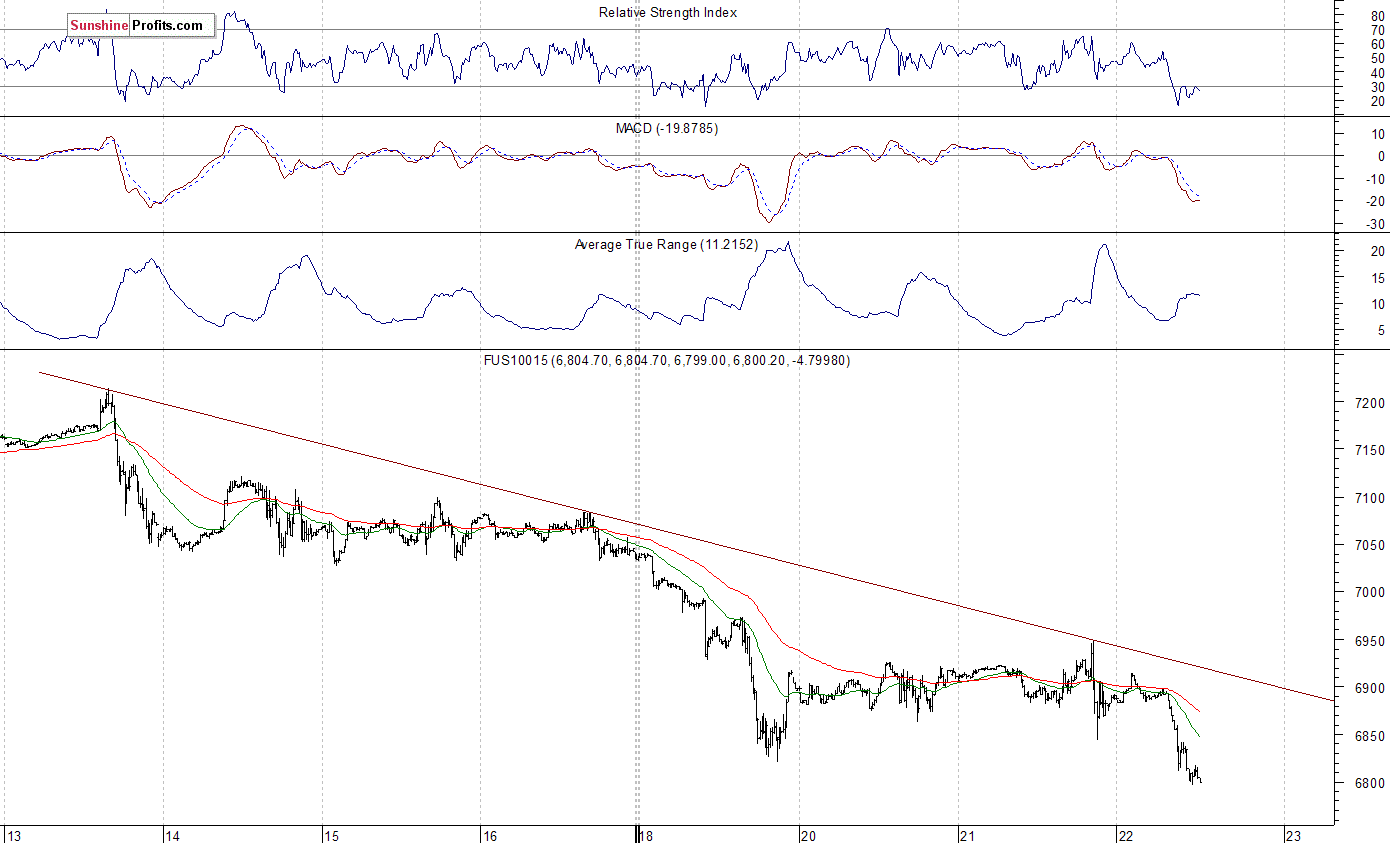
The technology Nasdaq 100 futures contract follows a similar path, as it trades within an intraday downtrend. It broke below 6,800 mark this morning. The market gained more than 1,000 points off its February 9 bottom, as it remarkably retraced all of its late January – early February sell-off in one month. Is this just downward correction following record-breaking rally? It still looks like a correction and not some new medium-term downtrend. The nearest important short-term resistance level is at around 6,850, marked by recent local lows and the next level of resistance remains at 6,900-6,950. On the other hand, potential support level is at 6,700-6,750. The Nasdaq futures contract extends its short-term downtrend this morning, as the 15-minute chart shows:
Apple Leads Lower, Facebook Bounces
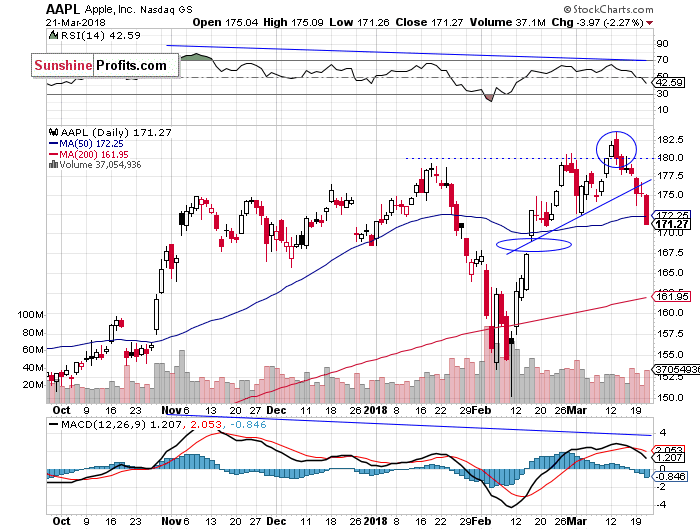
Let’s take a look at Apple, Inc. stock (AAPL) daily chart (chart courtesy of http://stockcharts.com). The market reached new record last week, but then it reversed the uptrend. We saw negative technical divergences – the most common divergences are between asset’s price and some indicator based on it (for instance the index and RSI or MACD based on the index). In this case, the divergence occurs when price forms a higher high and the indicator forms a lower high. It shows us that even though price reaches new highs, the fuel for the uptrend starts running low. The market formed a negative candlestick chart pattern called “bearish engulfing”. It consists of a smaller white candlestick followed by a black candlestick that “engulfs” the white one. This downward reversal pattern has been confirmed by last week’s Wednesday’s move down. Consequently the market continued its downtrend, as it broke below the upward trend line on Monday. If the price breaks below support level of $170 and then below its previous daily gap up, it could continue towards $150 again:
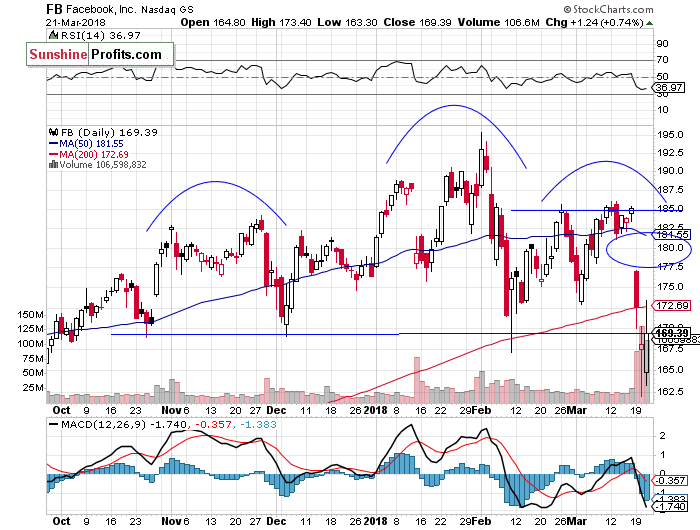
Now let’s take a look at Facebook, Inc. (FB) daily chart. It fell almost 10% on Monday and Tuesday, as it broke below its medium-term consolidation and potential downward reversal head-and-shoulders pattern. Monday’s daily gap down acts a resistance level now. Overall, the stock remains relatively weaker than technology stocks sector and the whole broad stock market. It bounced off support level at $160-165 again, but the nearest important level of resistance is at around $170:
Dow Jones Remains Below 25,000 Mark
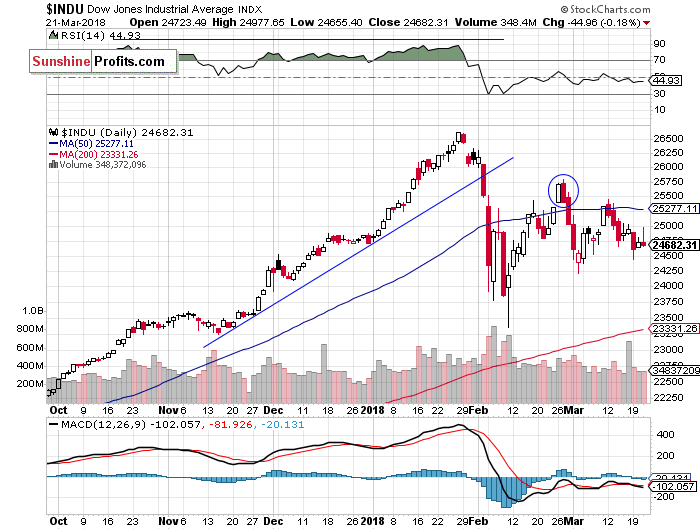
The Dow Jones Industrial Average daily chart shows that blue-chip index was relatively weaker than the broad stock market and much weaker than record-breaking technology stocks recently, as it continued to trade well below late February local high. The market broke below 25,000 mark, as it retraced more of its recent rebound. Possible support level is at around 24,250, marked by previous local low. If the index breaks lower, it could continue towards February 9 panic low. In late February, there was a negative candlestick pattern called Dark Cloud Cover, a pattern in which the uptrend continues with a long white body, and the next day it reverses following higher open and closes below the mid-point between open and close prices of the previous day. It acted as a resistance level. The index trades within an over-week-long consolidation, as we can see on the daily chart:
Concluding, the S&P 500 index will open lower today, as investors’ sentiment worsens after yesterday’s Fed’s interest rate hike. Will it continue below the level of 2,700? For now, it looks like it could bounce here and extend its short-term fluctuations.
Last week’s rally failed to continue following negative political news releases. Was this just quick profit-taking action or more meaningful downward reversal? It’s hard to say right now, but Monday’s sell-off made medium-term bullish case less likely. There is also a negative over-month-long rising wedge pattern. If stocks continue lower from here, then they will probably reach or exceed February panic low.
If you enjoyed the above analysis and would like to receive free follow-ups, we encourage you to sign up for our daily newsletter – it’s free and if you don’t like it, you can unsubscribe with just 2 clicks. If you sign up today, you’ll also get 7 days of free access to our premium daily Gold & Silver Trading Alerts. Sign me up!
Thank you.
Paul Rejczak
Stock Trading Strategist

“Despite what we hear on the news and from many authorities, the story of our era is that we’re witnessing the greatest improvement in Global living standards ever to take place”. There are 3 key reasons why so much progress has been made:
….related from Michael: Have We Seen The Peak in The Anti-Success Anti-Business Movement?

Martin Armstrong gives advice to a Venezuelan gentleman whose pension payout no longer can buy him a hamburger. A circumstance no longer an impossibility with the pension crisis unfolding as we speak in Canada & the US . Great advice for those expecting a pension – R. Zurrer for Moneytalks
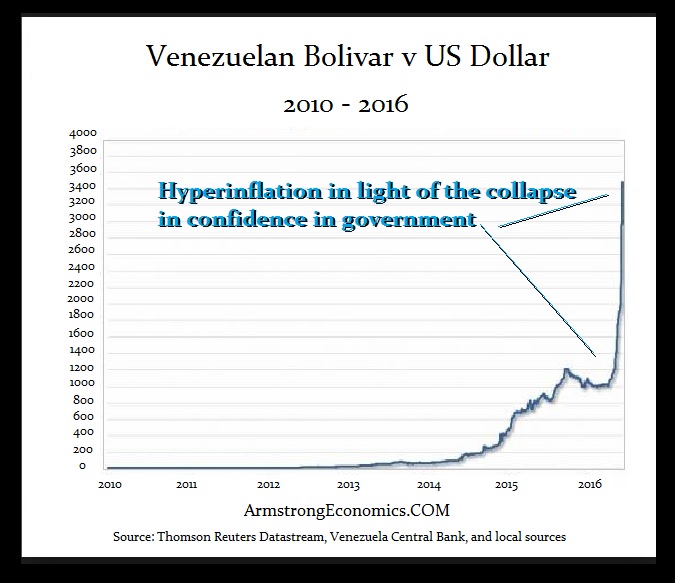
COMMENT: Mr. Armstrong; I just wanted to comment that I am from Venezuela. My father came here to visit me in Florida where I live with a Green Card. Everything he saved in life for his retirement is now worthless and it does not even pay to travel back to collect his pension. The hyperinflation is a collapse in the confidence of government as you have explained. Those who saved for their retirement and had pensions, lose everything. They will be paid the amount that they were promised, but it will not even buy a single night’s dinner and soon a beer.
Thank you for your contribution to society. I wish more people would listen to you. Experience is the root of knowledge. Opinion is the root of bias. You have proven that
JE
REPLY: To survive hyperinflation requires the holding oftangible assets and never cash or pensions. The way pensions can be devalued is through inflation over the course of time and circumstance. What I paid into Social Security will never come back to me in terms of real purchasing power and that is without hyperinflation. I have stated before, I met with the Treasury back during the Reagan Administration and said these insane levels of interest rates will triple the national debt in less than 10 years. They simply responded; Yes but we will be paying back with cheaper dollars.
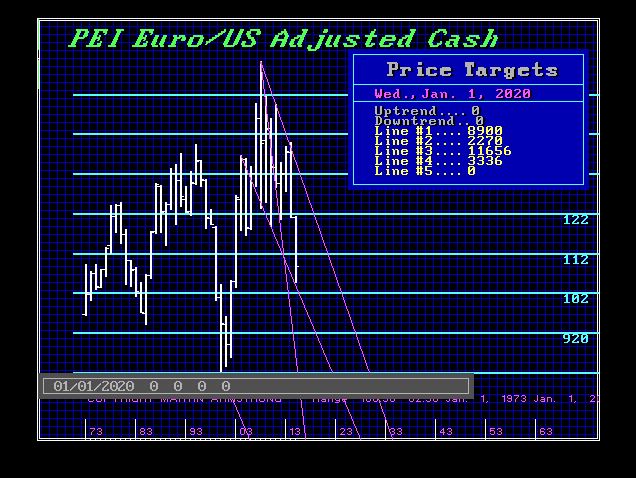
All promises of government are simply eroded with inflation. That is why Southern Europe fell into such chaos. The currency doubled instead of declining when the joined the Euro. That is why Europe has been a failure under this political-economic philosophy. The Euro first crashed, and then doubled in value. Southern Europe was used to deflation always reducing their debts. Suddenly, their debts doubled. And people cannot figure out why the Euro is in such trouble?
I do like your saying though. It is spot on.
….also from Martin: When Timing is Everything – The Failed Graf Zeppelin Venture

 Wide-reaching corporate tax cuts have stock investors wondering which companies will benefit most. Goldman Sachs has singled out the 16 companies that offer the most reinvestment growth, a characteristic of companies that have historically outperformed the market – R. Zurrer for Money Talks
How does an investor decide which companies are poised to benefit most from sweeping tax cuts that benefit most everyone? Listen to Goldman Sachs, of course.
The firm has developed an index of stocks called the High Growth Investment Ratio Basket, which is designed to include companies whose share prices are most likely to get a boost from tax reform, given their past use of excess capital.
Goldman’s basket includes not just the companies who have most heavily reinvested money into capital expenditures and research & development, but also those set to generate the highest return on it.
For context, the median stock in the index has reinvested 81% of its trailing three years of cash flow from operations, compared with just 13% for the average S&P 500 company, according to Goldman. The firm also forecasts that basket members will offer 18% cash return on capital invested, compared to just 12% for the broader benchmark.
Without further ado, here are the 16 stocks that best fit the bill, arranged in increasing order of three-year growth investment ratio:
Click HERE for Slides 1-16
“The stock market meltup is over”. There is a strong case “that January was the melt-up, or at least the culmination of it,’” says one prominent Wall Street strategist. Michael Wilson, the chief US equity strategist at Morgan Stanley makes his case below. Bear in mind that Martin Armstrong still expects to see Dow 35,000 plus – R. Zurrer for Money Talks
The stock meltup is over, at least that’s the prognosis of one prominent Wall Street strategist who believes the torrid January rally that gave way to a correction may have been the market’s short-term apex. The S&P 500 jumped 7.5% between the end of 2017 and Jan. 26, when it notched the last in a string of record closes at 2,872.87.
“We think January was the top for sentiment, if not prices, for the year. With volatility moving higher we think it will be difficult for institutional clients to gross up to or beyond the January peaks,” said Michael Wilson, chief U.S. equity strategist at Morgan Stanley Institutional Securities, in his weekly note on Monday. “Retail sentiment indicators also look to have peaked in January and we do not see anything on the horizon to get retail investors more bullish than they were following a tax cut.”
As a result, the much-anticipated meltup in stocks that numerous strategists had been forecasting since last year won’t likely happen in 2018, he said.
A meltup is an unexpected rise in asset prices as investors surge into the market on fear of missing out.
“When we look at our internal data combined with industry flows and sentiment, we think there is a strong case that January was the melt-up, or at least the culmination of it,” Wilson added.
One key point in Wilson’s thesis is that gross leverage by Morgan Stanley’s hedge fund clients hit an all-time high in January. Gross leverage, according to the strategist, is a good measure of investor willingness to assume risk.

The record was also set right before the early February “volatility shock” forced investors to scale back their exposure to risk and Wilson does not expect gross leverage to return to January levels any time in the near future.

Wilson’s downbeat comments come as the stock market struggles to move out of correction territory as investors deal with a combination of trade-war jitters and inflation worries even as the economy continues to expand at a steady clip.
Going forward, Wilson expects U.S. stock returns to be mostly driven by increase in earnings estimates.
“If we just roll forward the current bottom-up estimates, the forward earnings per share would be $166 and $170 by June 30 and September 30, respectively. That is approximately 3% and 5% higher than today’s $161. Not exciting, but not very bad either,” he said.
“However, those numbers might need to come down if we start to see some evidence of lower margins since consensus forecasts assume no operating margin degradation. That is another reason why we think the S&P 500 makes its highs for the year this summer. It’s also a wild card that has big idiosyncratic risk at the stock level in our view.”
Wilson has predicted the S&P 500 SPX, +0.03% to close out the year at 2,750. The large cap index closed at 2,712.92 Monday, falling in tandem with the Dow Jones Industrial DJIA, -0.08% and the Nasdaq COMP, +0.18% on the back of a selloff in technology shares sparked by a slump in Facebook Inc. FB, -0.82%

-
I know Mike is a very solid investor and respect his opinions very much. So if he says pay attention to this or that - I will.
~ Dale G.
-
I've started managing my own investments so view Michael's site as a one-stop shop from which to get information and perspectives.
~ Dave E.
-
Michael offers easy reading, honest, common sense information that anyone can use in a practical manner.
~ der_al.
-
A sane voice in a scrambled investment world.
~ Ed R.
Inside Edge Pro Contributors

Greg Weldon

Josef Schachter

Tyler Bollhorn

Ryan Irvine

Paul Beattie

Martin Straith

Patrick Ceresna

Mark Leibovit

James Thorne

Victor Adair