
Bonds & Interest Rates
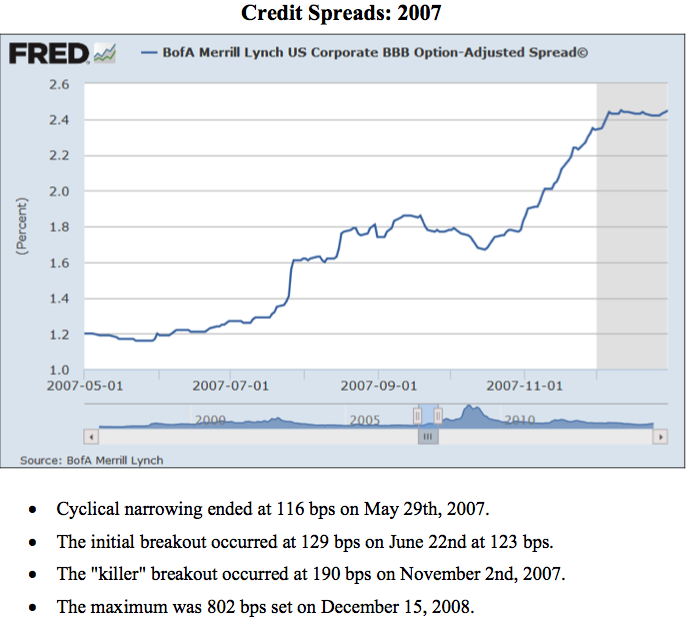
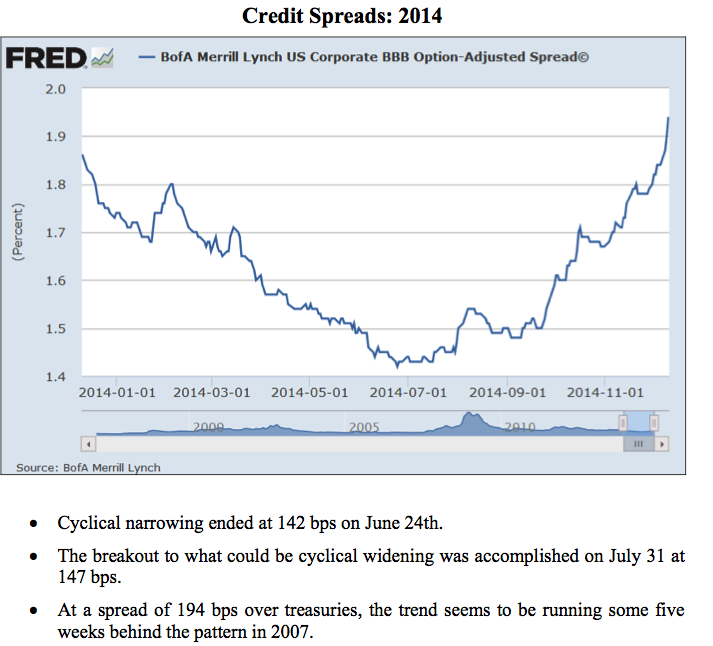
Another chart that bolsters Martin Armstrongs case that a Monetary Crisis is Beginning, though in this case it involves U.S. corporate debt. A monetary crisis will change everything with both banks and debtors facing rapidly rising rates. Prepare yourself – R. Zurrer for Money Talks
So many patterns that have held for decades seem to have broken down, leading to one of two conclusions: Either this time really is different in ways that appear to violate what used to be seen as iron-clad laws of finance, or those laws have been bent but will reassert themselves with a vengeance sometime in the future.
The latest example is the relationship between corporate debt and default rates on that debt. Historically they’ve moved in the same direction, with higher debt levels leading to higher default rates. That makes intuitive sense because rising debt implies that borrowing is easier for less creditworthy companies who should be expected to default at a higher rate.
But not this time:
Here’s why default rates are subdued even as corporate debt levels hit records
(MarketWatch) – U.S. corporate debt levels stand above crisis highs even as default rates among the most leveraged firms remain subdued.
With an economy hitting its stride, it’s perhaps no surprise that the high-yield bond market is placid. The extent of the divergence between debt levels and defaults, however, is worrying to some analysts who feel rising corporate indebtedness will eventually catch out unwary investors and deflate the junk-bond market.
But beyond complacency John Lonski, chief economist at Moody’s Capital Market Research, argued that globalization and the tendency of U.S. businesses to hoard cash as reasons why corporate debt levels may no longer move in sync with default rates and credit spreads.
The high-yield default rate in the fourth-quarter of 2017 fell to 3.3%, even as U.S. nonfinancial-corporate debt ended in 2017 at 45.4% of GDP. This compares with a much higher default rate of 11.1% in the second quarter of 2009, with corporate debt levels at 45% of GDP. Granted, the current levels come with the economy in the eighth year of an expansion, while the second quarter of 2009 marked the final quarter of the longest and deepest U.S. recession since the Great Depression.
The yield spread between high-yield bonds and safe government paper, as represented by the 10-year Treasury note narrowed to an average 3.63 percentage points in the fourth quarter of 2017, from an average 12.02 percentage points in the second quarter of 2009. The tight credit spreads reflects that borrowing costs are still close to historic lows, and that investors are demanding minimum compensation for holding arguably the riskiest debt in the bond market.
Moody’s Analytics
One answer “might be supplied by the ever increasing globalization of U.S. businesses where the more relevant denominator is not U.S. GDP, but world GDP” said Lonski.
The fortunes of U.S. companies are now woven into the broader global economy. When commodity prices took a hit in 2015 and early 2016, crimping growth in China and other emerging markets, high-yield bonds were also slammed.
With commodity prices on the rise and global growth making a comeback, it’s no mystery that issuers of high-yield bonds aren’t in any serious trouble.The tendency of U.S. corporations to accumulate cash could also be to blame. Lonski says net corporate debt to GDP, which subtracts total debt levels by the amount of cash in business balance sheets, was at a much more subdued 33.2%, well below the 45.2% seen in the broader debt to GDP measure.
But the meaningfulness of this statistic may be limited by the “high concentration of cash among relatively few companies,” many of which are considered highly creditworthy.
Tech companies like Apple and Microsoft have been the main components of this trend. In the past, such firms issued debt backed by the collateral of their overseas profits for share buybacks and other forms of shareholder remuneration.

So has the correlation between corporate debt and defaults been broken for good or just for now? “Just for now” remains the most likely answer, since the business cycle is embedded in human nature rather than some kind of external constraint that we can evade with clever tricks. In fact, it’s clever tricks – like the fiat currency printing press — that fool us into thinking we control events that used to control us.
And is it worth speculating about what might happen to restore those historical relationships – that is, cause a crisis that spikes junk bond defaults and causes corporate debt to start shrinking? Probably not, since there are so many candidates right now. Something will happen and the lines on the above chart will converge in the upper right corner – and then the bottom right.

02:06 -18:11 Featured Guest John Johnston of Davis Rea joins Michael. When it comes to tracking the Canadian dollar there is nobody better – John analyzes developments in global financial markets and covers all the potential fundamental shifts in the currency markets including trade tarriffs, employment patterns and Federal Reserve interest rate policy and winds up with a strategy to prosper in the current and future environment.
….also Michael’s Editorial: Trouble Coming Squared

 1. On The Brink of a Terrifying Future
What is going to happen when 51% of the US millenial generation say they’d rather live in a socialist or communist country? Michael has even more startling numbers, facts & consequences:
2. Interbank Rates Starting to Rise – Monetary Crisis is Beginning
by Martin Armstrong
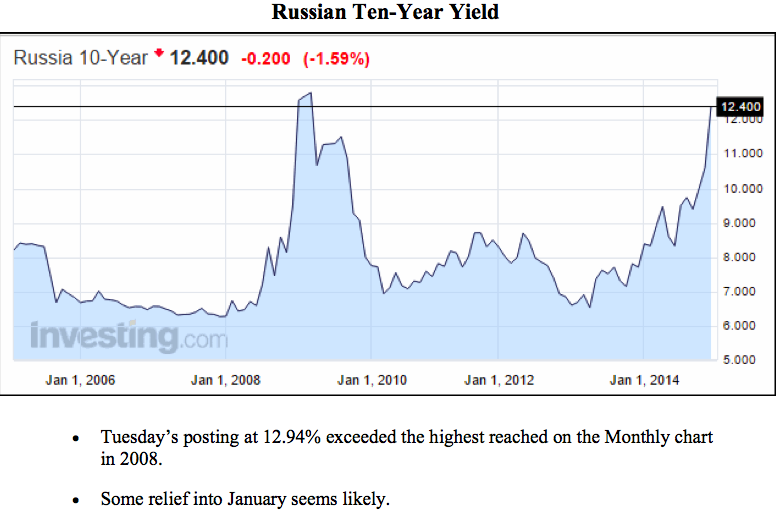
Martin Armstrong reports that Interest Rates are rising significantly in several important European Markets. With Libor at its highest level since 2008 both banks and debtors face rapidly rising rates
3. How To Protect Yourself from Bubbles & Soon To Be Worthless Currencies
As Voltaire said “Paper money eventually returns to its intrinsic value — zero.”. Zero interest rates, ballooning 230 Trillion in Global Government debt, there are a lot of dangers and history tells us what we can expect. Even former Federal Reserve Chairman Alan Greenspan warns about the existing bond and stock bubbles
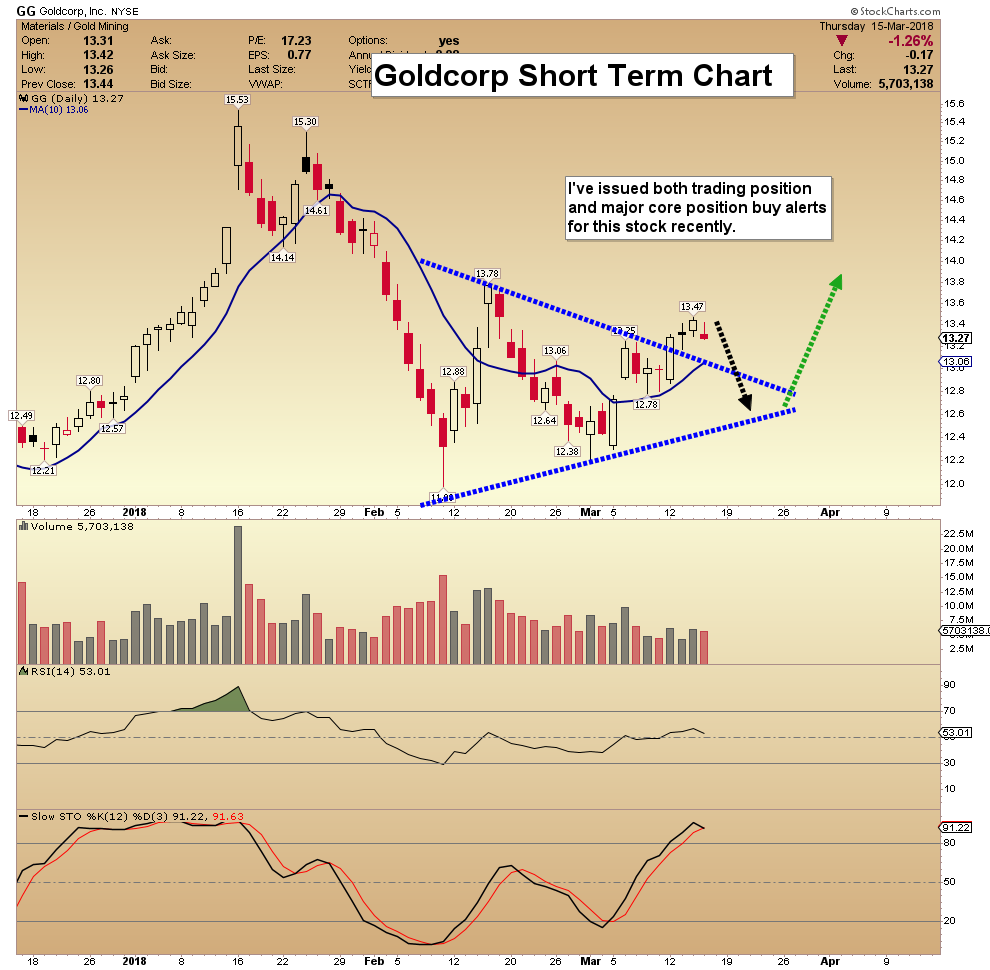
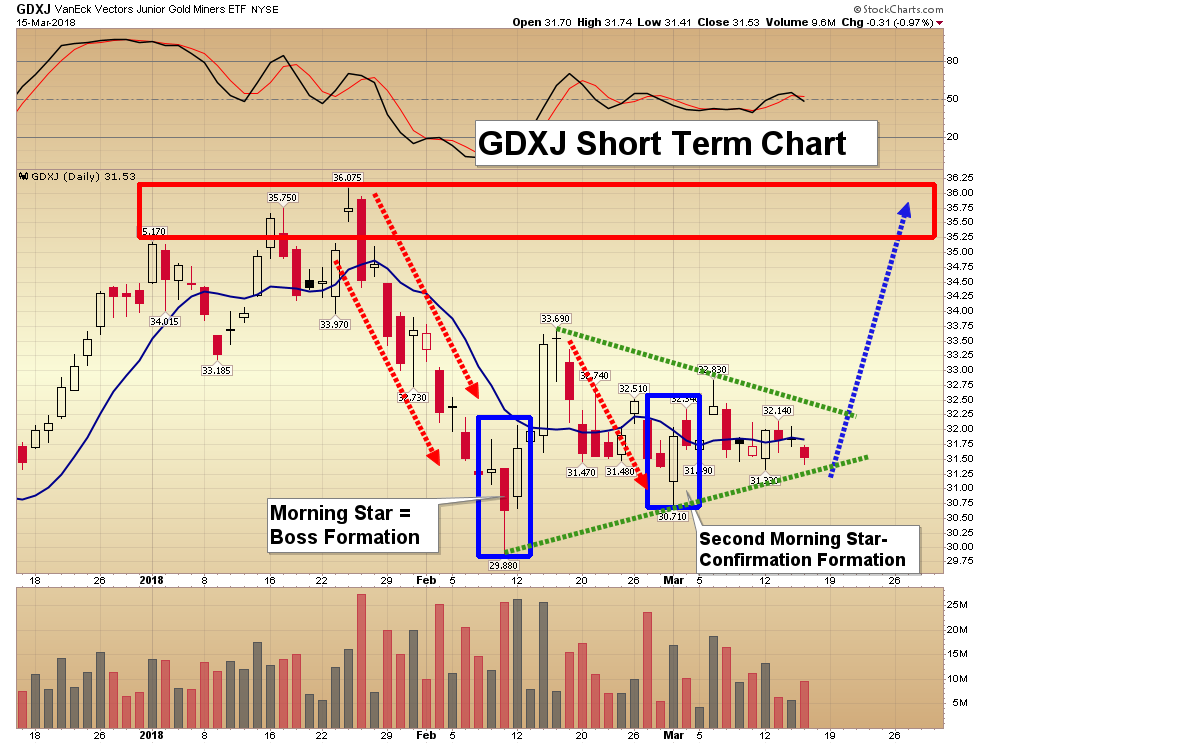
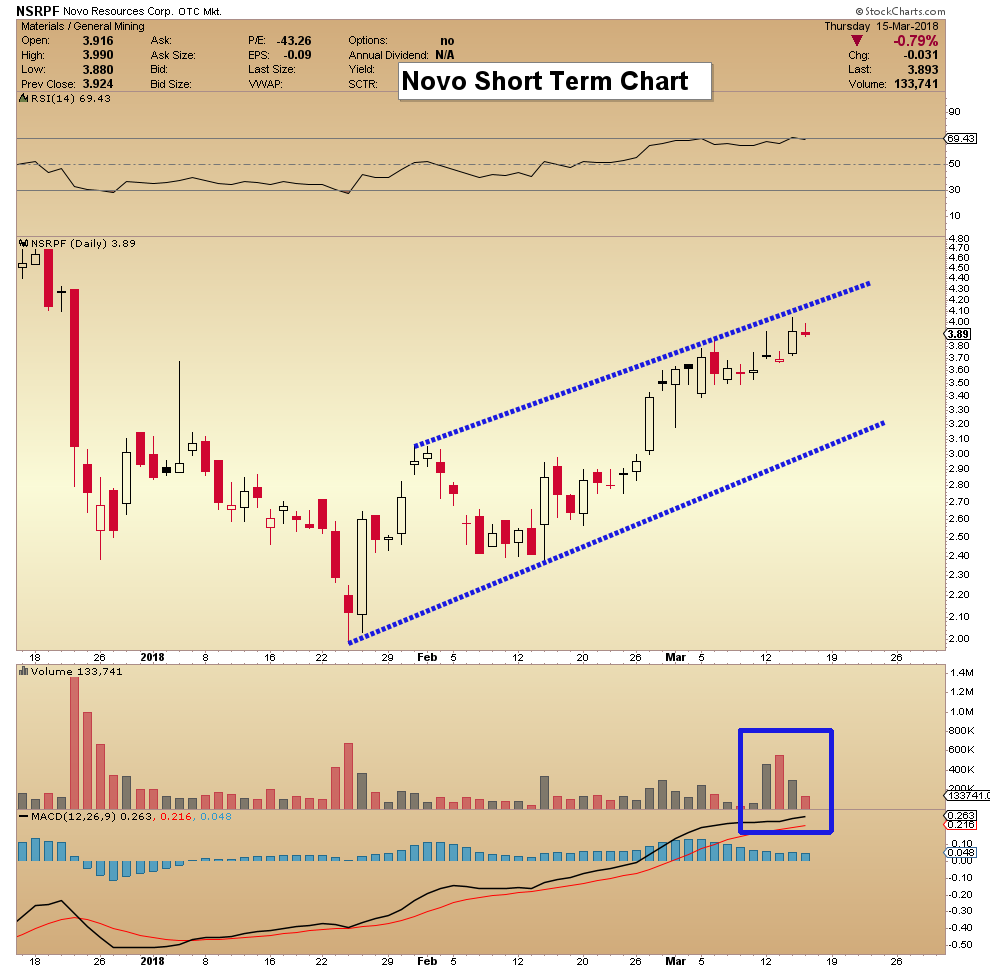
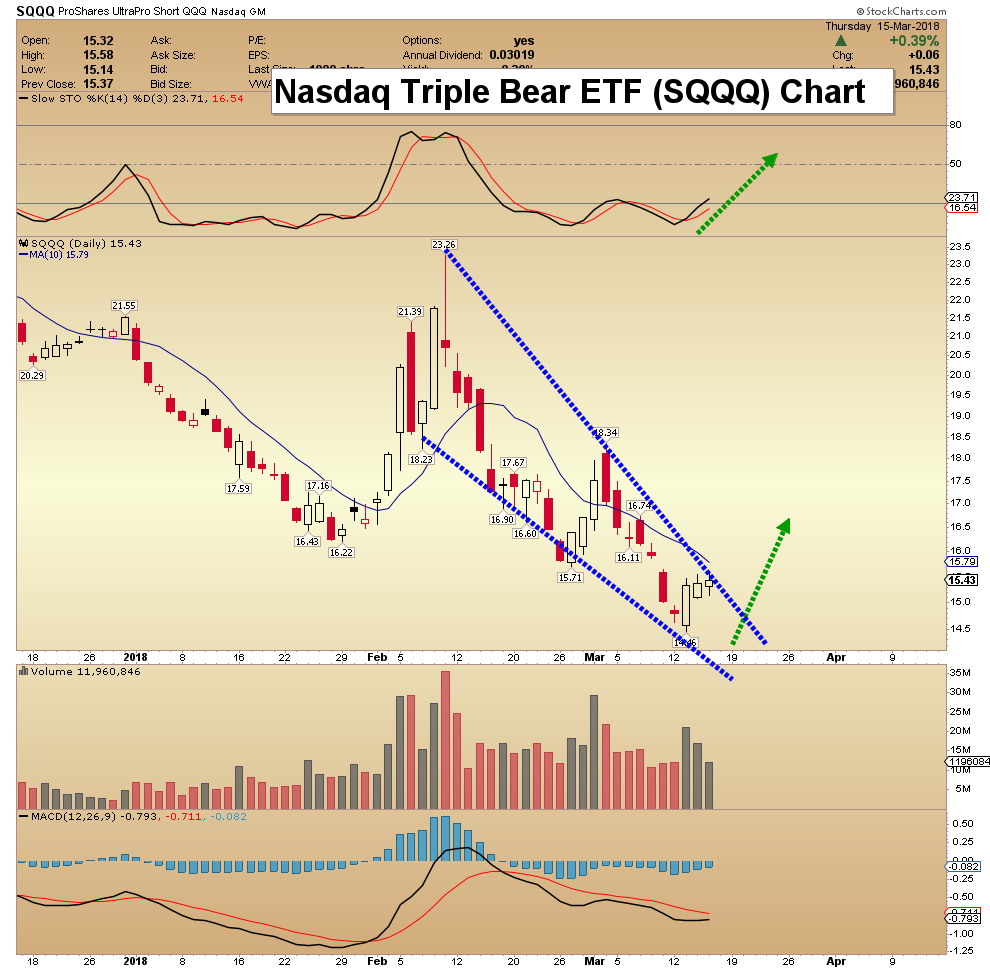
These great charts as usual clearly show opportunities both long and short in everything from individual stocks through Commodity and Stock Market ETF’s. Besides the individual stock Novo, be sure to listen to Morris’s analysis of the Nasdaq Triple Bear ETF & GDXJ Short Term Chart – R. Zurrer for Money Talks
Today’s videos and charts (double click to enlarge):
SFS Key Charts & Video Update

SF60 Key Charts & Video Update

SF Juniors Key Charts & Video Analysis


SF Trader Time Key Charts & Video Analysis


Morris
website: www.superforcesignals.com
email: trading@superforcesignals.com
email: trading@superforce60.com
SFS Web Services
1170 Bay Street, Suite #143
Toronto, Ontario, M5S 2B4
Canada

While there are fortunes being made in art and collectibles by rich investors, this particular powerful bull market is being driven by modestly funded millennials. A quick look at the chart of this developing bull market certainly indicates it has much further to go – R. Zurrer for Money Talks
A Big-Money Bull Market
It’s the market for sneakers. Yes, sneakers.
Google “Air Jordans” and you’ll see a good example of what I mean.
What you’ll find is thousands of websites like SoleCollector.com that are dedicated to tracking shoes, including those that are put out under the Air Jordan brand.
And people are making big money from buying and selling these sneakers.
For example, you could have made 900% on a pair of Air Jordan 2 Retro “Don C” shoes.
Or 426% on a pair of Air Jordan 10 Retro “Double Nickel” shoes.
Sneakers are a new category of collectibles that’s come about in the last 20 years. And prices are skyrocketing for the most collectible ones, like LeBrons.

No wonder then the business of the companies that make sneakers have been soaring for years now.
The three main companies in the sneaker business are Nike, Adidas and Puma. These are big, global brands that are doing great business, and their stocks are soaring higher too.
Market For Sneakers
Kering (OTC: PPRUY), which is the company that owns Puma, is up 134%, while Adidas AG (OTC: ADDYY) is up 185% and Nike Inc. (NYSE: NKE) is up 71%.
These returns are crushing the S&P 500, which is up just 40% in the same time period.

Now, the reason why sneakers are so hot is because of something I’ve told you about before — the coming of age of the millennial generation.
You see, it’s their buying that’s bidding up the price of Air Jordans and LeBrons … and in turn, it’s that same buying that’s making sneaker company business sales jump, and their stocks rocket higher.
I believe that the sneaker market is going to keep running higher as millennials gorge on their sneaker collections. And that in turn is going to keep revving the stocks of most sneaker companies higher.
Regards,

Paul Mampilly
Editor, Profits Unlimited

-
I know Mike is a very solid investor and respect his opinions very much. So if he says pay attention to this or that - I will.
~ Dale G.
-
I've started managing my own investments so view Michael's site as a one-stop shop from which to get information and perspectives.
~ Dave E.
-
Michael offers easy reading, honest, common sense information that anyone can use in a practical manner.
~ der_al.
-
A sane voice in a scrambled investment world.
~ Ed R.
Inside Edge Pro Contributors

Greg Weldon

Josef Schachter

Tyler Bollhorn

Ryan Irvine

Paul Beattie

Martin Straith

Patrick Ceresna

Mark Leibovit

James Thorne

Victor Adair