
Mike's Content
Michael asks Kyle Green where the flow of investment $’s are going in real estate & what impact the new mortage rules have had.
….also from Michael: How to Generate More Income in Your RRSP


Ross Clark has specialized in technical analysis of the markets since the 1970’s. Through exhaustive historical analysis he is so good at market timing and shifts in asset allocation that Bob Hoye of Institutional Advisors brought him onboard. Today he gives quite an education in Post-Bubble environments and relates them to a current existing opportunity in Bitcoin. R. Zurrer for Money Talks
Bitcoin – Oversold and Into Support
Post-Bubble environments have some of the most repetitive characteristics as they unwind the excesses of the euphoric phase that took them into the top. Most result in lengthy bear markets (Dow 1929, Gold 1980, Nikkei 1989, NASDAQ 2000, Silver 2011, 3-D Systems 2014 & Shanghai 2015). A few manage to form new bases from which to move to new highs (Biotech’s 2015 & Canopy Growth 2016).
Excuse the busy chart

The overbought rally into January 8th (red arrows) in Bitcoin (NYXBT) and Bitcoin Investment Trust (GBTC) provided a secondary sell signal following the Sequential 13 Sell on December 19th. Prices then dropped 65%. Good interim lows at that point in ‘Post Bubble’ markets have occurred around the 50-week ema or 100-week simple moving average. . . when coupled with a weekly CCI(8) reading of -150. Bitcoin generated a reading of -149 and GBTC at -143 at the 50-week ema during the February 9th low (blue arrows).
The next action was a retracement rally to February 20th, trading temporarily above our upside target of 10,600. It created the characteristic daily overbought signal against the upper 20-day Bollinger Band (green arrows). As of Friday, it has dropped to the lower Bollinger and Keltner
bands (orange arrow). Keltner Bands are a style of volatility band using Average True Ranges and generate a smoother band.
Whatever low is created within the next few days should become the critical one. We can expect a rally back through the upper Bollinger Band and more likely to the Keltner Band (currently 11,886).
The ability to hold above the low at this point of development was the case following last July’s low at $7.73 in Canopy Growth. The biotech index (BTK) did the same thing in 2016, holding above its July low of 2807. These went on to new highs. The other six examples violated the support (red line) and went on to make multi-year lows.
Weekly charts of other bubbles.
Red arrows identify secondary daily sale after the top.
Blue arrows are oversold weekly CCI(8) readings. Green arrows are next daily overbought
signal.. Orange arrows are daily oversold at the Bollinger Band. Note how important the red support line becomes.

Slides from the World Outlook Financial Conference presentaion February 3, 2018 (Click on each Chart for Larger Version)


Opinions in this report are solely those of the author. The information herein was obtained from various sources; however, we do not guarantee its accuracy or completeness. This research report is prepared for general circulation and is circulated for general information only. It does not have regard to the specific investment objectives, financial situation, and the needs regarding the appropriateness of investing in any securities or investment strategies discussed or recommended in this report and should understand that statements regarding future prospects may not be realized.
Investors should note that income from such securities, if any, may fluctuate and that each security’s price or value may rise or fall. Accordingly, investors may receive back less than originally invested. Past performance is not necessarily a guide to future performance. Neither the information nor any opinion expressed constitutes an offer to buy or sell any securities or options or futures contracts. Foreign currency rates of exchange may adversely affect the value, price or income of any security or related investment mentioned in this report. In addition, investors in securities such as ADRs, whose values are influenced by the currency of the underlying security, effectively assume currency risk. Moreover, from time to time, members of the Institutional Advisors team may be long or short positions discussed in our publications.
CHARTWORKS – 3/11/2018

Paul Rejczak highlights the current situation in all-three stock indices and lists the support points to buy should the market should be lower today. He also analyses the high flyers Apple and Amazon and their negative trading action of the last two days – R. Zurrer for Money Talks
Downward Pressure Mounting
The main U.S. stock market indexes extended their Tuesday’s losses, as they closed 0.2-1.0% lower yesterday. The S&P 500 index lost 0.6% following Tuesday’s bounce off resistance level at 2,800. However, it remained at the support level of last Friday’s daily gap up. It currently trades 4.6% below January 26 record high of 2,872.87. The Dow Jones Industrial Average was relatively weaker than the broad stock market, as it lost 1.0% and the technology Nasdaq Composite lost just 0.2%.
The nearest important level of resistance of the S&P 500 index is now at around 2,775-2,780, marked by yesterday’s daily high. The next resistance level is at 2,790-2,800, marked by short-term local highs. On the other hand, support level is at 2,740-2,750, marked by Friday’s daily gap up of 2,740.45-2,751.54. The next level of support is at 2,700-2,720, among others.
The S&P 500 index reached its record high on January 26. It broke below month-long upward trend line, as it confirmed uptrend’s reversal. Then the broad stock market gauge retraced all of its January rally and continued lower. The index extended its downtrend on February 9, as it was almost 12% below the late January record high. We can see that stocks reversed their medium-term upward course following whole retracement of January euphoria rally. Then the market bounced off its almost year-long medium-term upward trend line, and it retraced more than 61.8% of the sell-off within a few days of trading. Is this just an upward correction or uptrend leading to new all-time highs? The market seems to be in the middle of two possible future scenarios. The bearish case leads us to February low or lower after breaking below medium-term upward trend line, and the bullish one means potential double top pattern or breakout above the late January high. However, the most likely scenario may be that stocks go sideways for a while, and it would be the worst future scenario:
Uncertainty Following Move Down
The index futures contracts trade 0.1% higher vs. their yesterday’s closing prices, so expectations before the opening of today’s trading session are slightly positive. The European stock market indexes have gained 0.2-0.3% so far. Investors will wait for some economic data announcements: Empire State Manufacturing Index, Philly Fed Manufacturing Index, Initial Claims at 8:30 a.m., NAHB Housing Market Index at 10:00 a.m. Will yesterday’s move down continue? The S&P 500 index reached its Friday’s daily gap up, which may act as a short-term support level. If the market breaks lower, it could continue towards the level of 2,700. But for now, it looks like a downward correction. So, we will likely see more fluctuations above support level of 2,750, and below resistance level of 2,800.
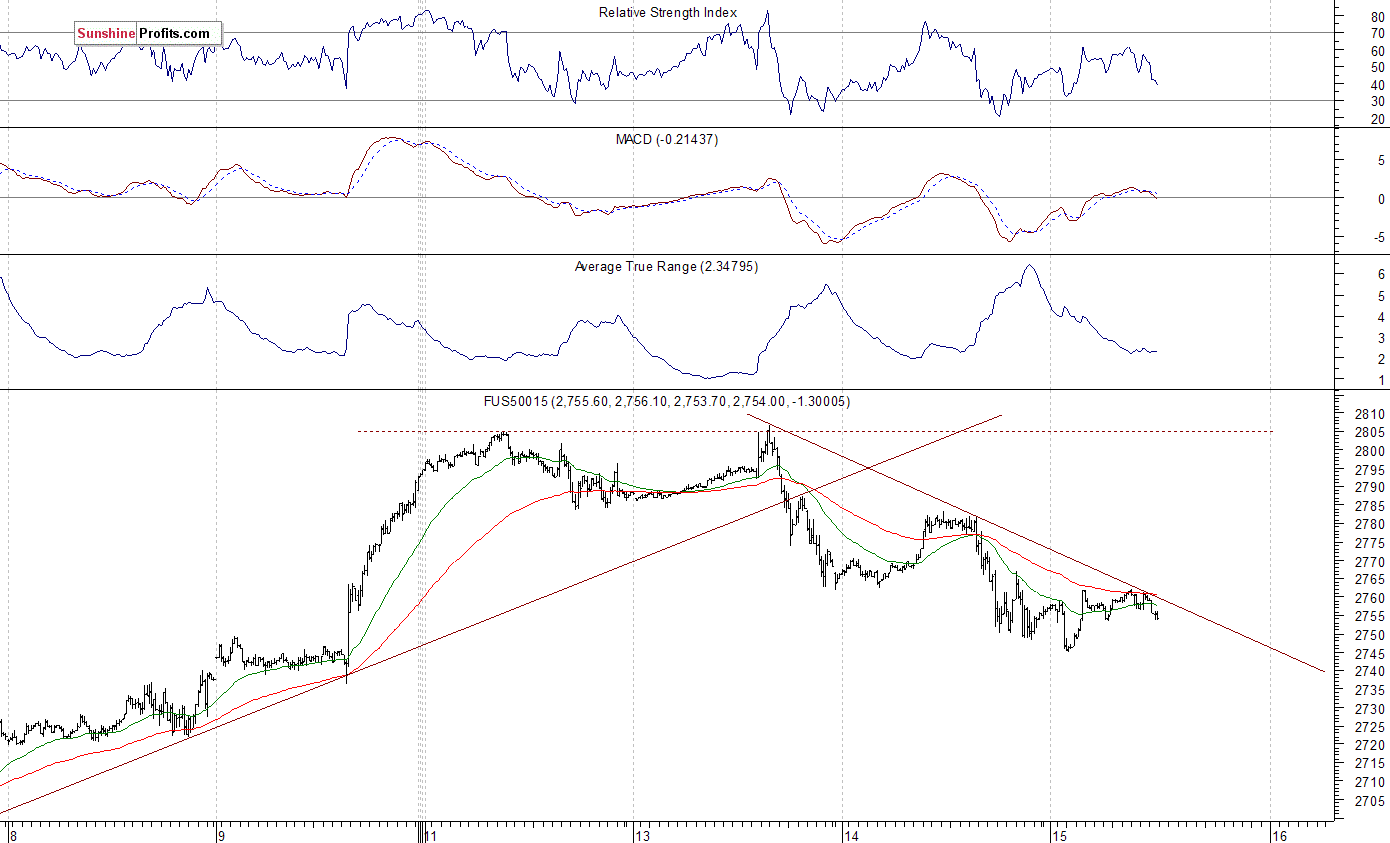
The S&P 500 futures contract trades within an intraday consolidation, as it retraces some of its overnight move down. The nearest important level of support is at around 2,745-2,750, marked by local low, among others. On the other hand, resistance level is at 2,775-2,785, marked by yesterday’s local high. The futures contract is below its short-term downward trend line, as we can see on the 15-minute chart:
Nasdaq Remains Above 7,000 Mark
The technology Nasdaq 100 futures contract was stronger than the broad stock market recently, as it broke above 7,000 mark and continued reaching new record highs. The market gained more than 1,000 points off its February 9 bottom, as it remarkably retraced all of its late January – early February sell-off in one month. The Nasdaq futures contract was above 7,200 mark on Monday, before reversing lower and retracing most of its Friday’s rally. Since then, it keeps bouncing off support level at 7,000-7,050. The Nasdaq futures contract fluctuates along that support level, as the 15-minute chart shows:
Click Chart for Larger Image
Apple, Amazon – Ugly Charts
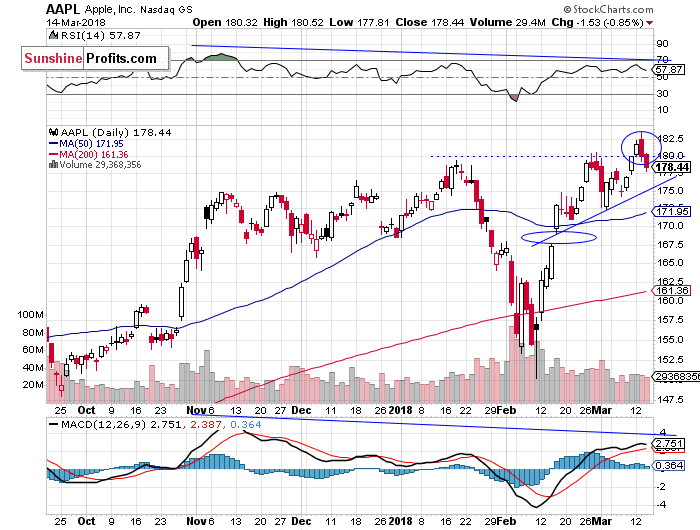
Let’s take a look at Apple, Inc. stock (AAPL) daily chart (chart courtesy of http://stockcharts.com) again. It was one of February stock market rout’s main drivers. Then it led broad stock market rebound rally. It fell close to support level of $150 on February 9. Since then it was retracing early February losses. The market reached new record high on Tuesday, but then it reversed its intraday uptrend and closed below $180. We can see some negative medium-term technical divergences – the most common divergences are between asset’s price and some indicator based on it (for instance the index and RSI or MACD based on the index). In this case, the divergence occurs when price forms a higher high and the indicator forms a lower high. It shows us that even though price reaches new highs, the fuel for the uptrend starts running low. On Tuesday, the market formed a negative candlestick chart pattern called “bearish engulfing”. It consists of a smaller white candlestick followed by a black candlestick that “engulfs” the white one. This downward reversal pattern has been confirmed by yesterday’s move down:
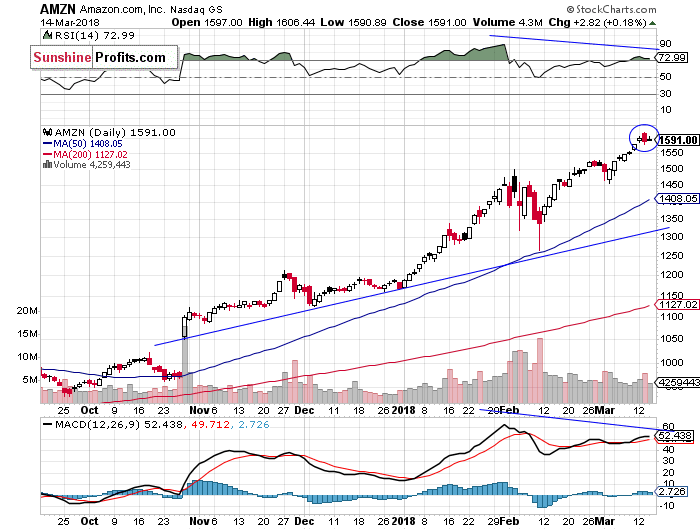
Amazon.com, Inc. stock (AMZN) continued its uptrend recently, as it reached new record high above the price of $1,600. The stock reversed its upward course on Tuesday and closed below previous day’s closing price. Tuesday’s trading action was bearish, as the stock formed a similar to the above-mentioned bearish engulfing pattern. However, yesterday’s confirmation of the pattern was weaker than Apple’s. Amazon remains relatively strong vs. the rest of the market, even stronger the other big-cap technology stocks. We still can see negative technical divergences:
Dow Jones Remains Relatively Weaker
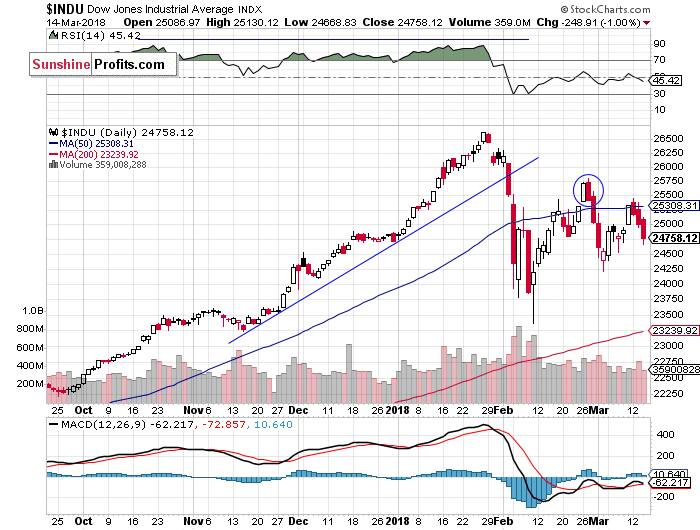
The Dow Jones Industrial Average daily chart shows that blue-chip index remains relatively weaker than the broad stock market and much weaker than record-breaking technology stocks, as it still trades well below late February local high. The market broke below 25,000 mark yesterday, as it retraced more of its recent rebound. Possible support level is at around 24,250, marked by previous local low. If the index breaks lower, it could continue towards February 9 panic low. In late February, there was a negative candlestick pattern called Dark Cloud Cover, a pattern in which the uptrend continues with a long white body, and the next day it reverses following higher open and closes below the mid-point between open and close prices of the previous day. It acted as a resistance level, as we can see on the daily chart:
Concluding, the S&P 500 index may extend its short-term fluctuations following Tuesday’s bounce off resistance level at 2,800. We prefer to be out of the market today, avoiding low risk/reward ratio trades. However, if sentiment worsens considerably and the index continues lower, we would think about buying the dip (within the support level of 2,700-2,720).
The rally failed to continue following negative political news release. Was this just quick profit-taking action or more meaningful downward reversal? It’s hard to say right now. Stocks are likely to open slightly higher today, but the outlook is bearish after recent rout. It seems that the overall market risk is higher than in the late February when S&P 500 was trading at the same level.
If you enjoyed the above analysis and would like to receive free follow-ups, we encourage you to sign up for our daily newsletter – it’s free and if you don’t like it, you can unsubscribe with just 2 clicks. If you sign up today, you’ll also get 7 days of free access to our premium daily Gold & Silver Trading Alerts. Sign me up!
Thank you.
Paul Rejczak
Stock Trading Strategist
Stock Trading Alerts
Sunshine Profits – Free Stock Market Analysis

Martin Armstrong reports that Interest Rates are rising significantly in several important European Markets. With Libor at its highest level since 2008 both banks and debtors face rapidly rising rates. He reports it is the beginning of his Monetary Crisis Cycle – R. Zurrer for Money Talks

Extremely reliable sources from Behind the Curtain in Europe are becoming deeply concerned that Draghi at the ECB has created a monumental economic disaster he is just praying to holding off until he leaves next year. Interest rates are already starting to rise significantly in several important money and interbank markets. Both banks and debtors are facing a rapid rise in interest expenditures that will shock the world. This is going to blow-out budgets around the globe and both private and public debtors face higher costs of funds.
The Libor (London Interbank Offered Rate), the most important reference rate for the global interbank market, is currently at its highest level since 2008. We elected a Yearly Bullish Reversal on the close of 2016. Once we see the rate close above 213 on a monthly basis, LIBOR rates will be poised to jump to 510. When the Libor price rises, the short-term borrowing for banks becomes more expensive, and for borrowers in the financial market, such as sellers of bonds or buyers of mortgages, debt service becomes more difficult. The demand for debt is exceptionally high. We are looking at LIBOR rates rising sharply. The dollar-lending rate for dollar loans has been rising steadily in all maturities since about the end of 2014. The dollar-Libor for three-month loans in March 2017 were trading at around 1.1%. Currently, this dollar-Libor rate stands at around 2%.
This year’s WEC will be focused on the next major crisis and how all the markets will interact. This is the beginning of the Monetary Crisis Cycle. Our Yearly Models on LIBOR are already in a bullish posture on both short-term indicators. A closing on an annual basis above 208 will signal rates will rapidly more than DOUBLE into 2020. A closing above 510 on an annual basis will warn of a MAJOR financial crisis hitting just about every economy.
…also from Martin on March 15th:
The Resistance to Change is Why We have Panics
Zero interest rates, ballooning 230 Trillion in Global Government debt will ultimately set up as Voltaire said “Paper money eventually returns to its intrinsic value — zero.”. There are a lot of dangers and history tells us what we can expect. Even former Federal Reserve Chairman Alan Greenspan warns about the existing bond and stock bubbles. Gary Christensen spells out what investors must do to protect themselves in this well written article – R. Zurrer for Money Talks.
Shooting Ourselves In the Foot
Serious problems affect Americans. Problems first, solutions at the end!
We did what to ourselves? Our representatives, senators, and Presidents, supposedly acting on our behalf, voted for and created what history has shown are huge monetary and fiscal mistakes.
Some will disagree, but consider this partial list:
1 – Central banking and The Federal Reserve Act: Enough money was spread around Washington D.C. to purchase the passage of this self-serving banking monstrosity. It was signed into law by President Wilson over a century ago.
David Stockman has a clear assessment and firm opinions regarding the danger and destructiveness of the Central Bank. His statement is:
“Folks, these people aren’t totally stupid. They have amassed extraordinary power and plenary dominance over the nation’s $19 trillion capitalist economy only by assiduously cultivating the mother of all Big Lies. Namely, the myth that private capitalism is dangerously unstable and possessed of an economic death wish for periodic cyclical collapses, which can be forestalled only by the deft interventions of the central bank.
“That’s self-serving malarkey, of course. Every recession of the modern Keynesian era has been caused by the Federal Reserve, and most especially the calamity of 2008-2009. And the “recovery” from that one, as well as those stretching back to the 1950s, was owing to the inherent regenerative powers of the free market, not the interest rate and credit supply machinations of the Fed.
“So what we really have is a case of the monetary Wizard of Oz. There is nothing behind the Eccles Building curtain except a posse of essentially incompetent economic kibitzers who spend 90% of the time slamming the same old “buy” key on the Fed’s digital printing press, while falsely claiming credit for the inherent growth propensity of private capitalism.”

2 – Fiat Currencies: When the currency is backed by nothing it will become worthless. Voltaire recognized this fact centuries ago when he said, “Paper money eventually returns to its intrinsic value — zero.”
Dollar bills (paper and digital) are “Notes” – DEBTS of the Federal Reserve. They are not money, but are merely an “IOU” issued by the Fed. We are legally required to use these “IOUs” for taxes and commerce.

3 – Fractional Reserve Banking: Allowing commercial banks to loan dollars into existence creates rising prices and much mischief. The Treasury will not condone individuals counterfeiting Federal Reserve Notes, but they allow commercial banks to do the equivalent.
4 – Too Big To Fail: They have created the myth that certain banks are too large and must not be allowed to fail. The Fed and large banks promoted this self-serving nonsense.
5 – Regulatory Capture: Create an agency to oversee banks (pharmaceutical companies, military contractors, securities sales etc.) and staff the agency with “tainted” members from the same industry.
Example: The SEC did not discover the Madoff scam even after receiving detailed analysis from Harry Markpolous showing how to prove the Ponzi scheme. Madoff confessed and the SEC was late to the game.
6 – Derivatives: They are profitable for banks at the expense of the economy. Failed derivatives nearly killed the economy in 2008. A larger disaster is coming.
7 – Banks Own and Strongly Influence Politicians and the Media: No discussion needed.
8 – We Live In a Credit Based World: Banks skim a piece off most transactions. Has “financializing” everything improved the lives of the citizens? What happens if credit dries up – again – as it did in 2008? Will existing bank loans be called, will ATM’s cease functioning, will world trade crash?
9 – War on Cash: Banks demand maximum control, which means they want our assets, liabilities and transactions digitized inside their world. If all assets are “banked,” the only escape is cash – UNLESS CASH IS OUTLAWED. Once assets are “banked” then banks can confiscate assets via negative interest rates, transaction fees, and monthly charges.
10 – Central Banks Lowered Interest Rates to Near Zero: Rates went negative in Europe. Your “high interest” checking account probably pays less than 0.05% interest. Savers, insurance companies, and pension plans have been damaged by low interest rates, but those low rates benefitted bank profits.
11 – U.S. Government Deficit Spending: The Treasury borrows every month, spends more than its revenues, increases debt, and pretends all is well. The “debt ceiling” is a joke. Read 38,000 Tons of Poison.
George Carlin: “It’s a big club and you ain’t in it.”
SOLUTIONS:
If you aren’t a member of the political and financial elite, you’re not in “The Club.” All is not lost, but non-members must protect themselves. We should admit:
- Fiat currencies are corrupt. The dollar has been devalued by about 98% in the century since the Fed was created. Because debt and spending will accelerate in the next decade, the rate of devaluation will increase.
- The financial system has failed to meet the needs of the bottom 95%. According to official and flawed data, CPI adjusted wages have been stagnant or have declined since President Nixon severed the dollar from gold in 1971. The reality is worse because this data is produced by the agency that calculates the flawed cost of living statistics.
- The global economy is overwhelmed by debt – over $230 trillion. The U.S. economy is in debt over $60 trillion. Official U.S. government debt exceeds $20 trillion. This debt will be repaid in devalued dollars – or it will default. The (failed) solution to an excessive debt problem has been – and will continue to be – MORE DEBT!
- The “powers-that-be” will not relinquish power, authority, wealth or perks voluntarily. They have “made a mess of it” but accountability is no longer relevant. The Fed does NOT have your back….
Given the above, protect yourself!
It is time to exchange digital and paper assets into real assets – silver, gold, land, fine art, apartment buildings – whatever will retain value as the stock, bond and currencies bubbles implode. Even Greenspan warns about the bond and stock bubbles.
WHAT STOCK BUBBLE?

This article was originally written for Miles Franklin by Gary Christenson. Link is here.
Miles Franklin will convert digital assets into real assets. My first choice is silver, not Netflix, not Amazon, not the NASDAQ 100, and not bonds. Do your own due diligence, but protect your savings and retirement with hard assets.

-
I know Mike is a very solid investor and respect his opinions very much. So if he says pay attention to this or that - I will.
~ Dale G.
-
I've started managing my own investments so view Michael's site as a one-stop shop from which to get information and perspectives.
~ Dave E.
-
Michael offers easy reading, honest, common sense information that anyone can use in a practical manner.
~ der_al.
-
A sane voice in a scrambled investment world.
~ Ed R.
Inside Edge Pro Contributors

Greg Weldon

Josef Schachter

Tyler Bollhorn

Ryan Irvine

Paul Beattie

Martin Straith

Patrick Ceresna

Mark Leibovit

James Thorne

Victor Adair