
Mike's Content
Issac Newton’s 3rd law states “For every action, there is an equal and opposite reaction”. We have seen this physical law govern the investing world when for example the dot-com bubble rose spectacularily in 4 years to its highs, then reversed and collapsed all the way back to its starting point three years later. Anticipating when a major trend is going to change is arguably the underlying factor determining profits and losses. Newtons 3rd law is also applicable to to society in general, and with the rise in societal extremism the only thing we can count on is that there will be an equal and opposite reaction. The question? How will that reaction manifest…..
…..also from Michael: Government Desperation for Cash & How It Will Affect You


 Lance Roberts highlights the breakout to all-time highs in the technology sector as the “Chart Of The Year” for 2018. But not for the reason as touted by the overly optimistic “hopefuls,” but rather because this could very well mark the “last breakout” of this particular bull market cycle. R. Zurrer for Money Talks
Well, I jinxed it.
Technically Speaking: Chart Of The Year?
In this past weekend’s missive I wrote:
“There are generally two events that happen every year – somebody forgets their coat, goggles or some other article of clothing needed for skiing, and someone visits the emergency clinic with a minor injury.”
The tradition continues as my wife fell and tore her ACL. The good news is she tore the right one three years ago, and after surgery is stronger than ever. Now she will get to do the left one.
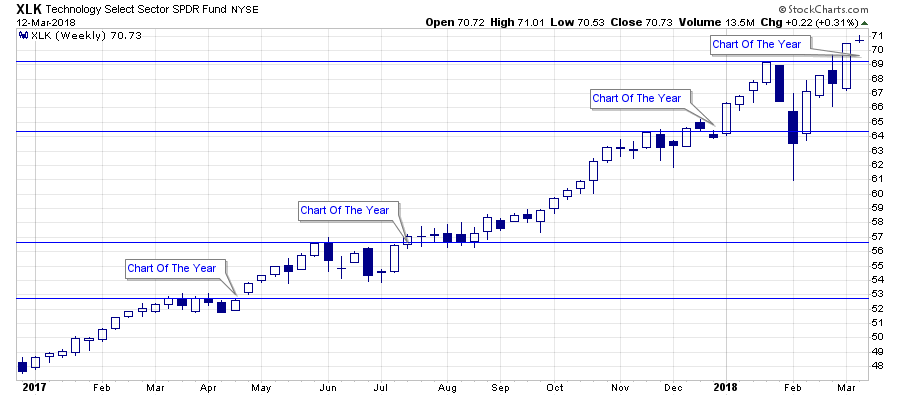
But, while I was sitting in the emergency clinic waiting for the x-rays to be completed, I was sent a chart of the technology sector with a simple note: “Chart Of The Year.”
Chart Of The Year
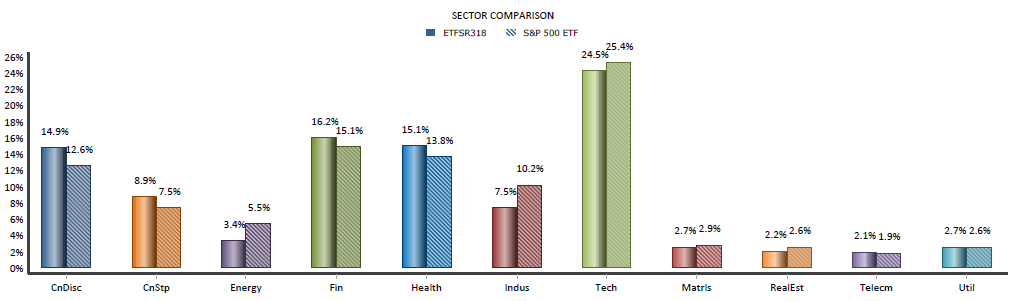
Yes, the technology sector has broken out to an all-time high. Yes, given the sector comprises roughly 25% of the S&P 500, it suggests that momentum is alive and well keeping the “bullish bias” intact. (We removed our hedges last week on the breakout of the market above the 50-dma on a weekly basis.)
This is why we are currently only slightly underweight technology within our portfolio allocation models as shown below.
But why “the chart of the year” now? As shown below the technology sector has broken out to all-time highs several times over the last 18-months. What makes this one so special?
The Last Breakout
As stated, breakouts are indeed bullish and suggest higher prices in the short-term. This time is likely no different. However, breakouts to new highs are not ALWAYS as bullish as they seem in the heat of the moment. A quick glance at history shows there is always a “last” break out of every advance.
1999-2000

2007-2008

As I discussed yesterday, the technology sector is once again the darling of “Wall Street” just as it was at the peak of the previous two bull-markets.
“When we compare the fund to Shiller’s CAPE ratio, not surprisingly, since Technology makes up a quarter of the S&P 500 index, there is a high correlation between Technology and overall market valuation expansion and contraction.”
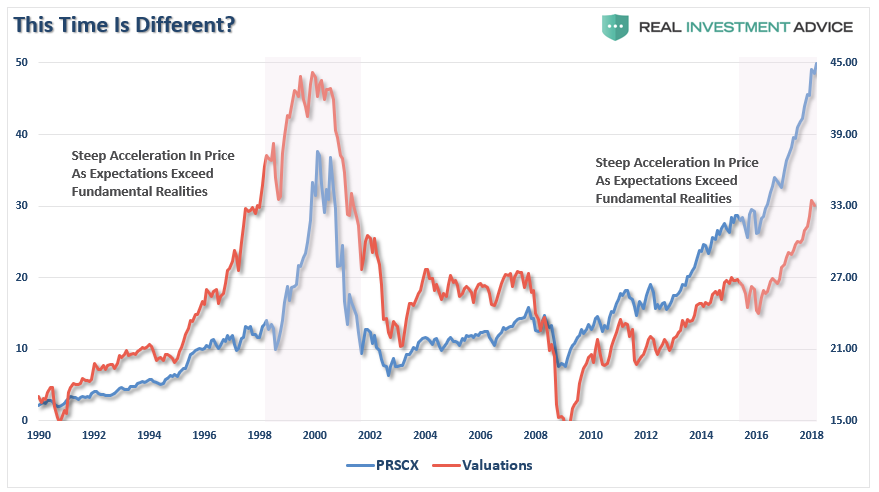
“As was the case in 1998-2000, the fund exploded higher as exuberance over the transformation of the world was occurring before our eyes. Investors globally were willing to pay “any price” to “get in on the action.” Currently, investors are once again chasing returns in the “FANG” stocks with little regard to underlying value. The near vertical ramp in the fund is reminiscent of the late 1990’s as valuations continue to escalate higher.”
I am not suggesting the current breakout is “THE” last breakout, and from a “trading perspective” the breakout is certainly bullish and should be bought.
However, from a long-term investing viewpoint, the problem is knowing the difference in a “breakout” and “the last breakout.”
In both previous instances, there were no warnings, no fanfare, or any glaring impediment to the technology sector, or the markets. Investors were bullishly optimistic, fully invested, margined, and willing to overlook fundamental valuation problems on the “hope” that “reality” would soon catch up with the price.
They were wrong on both previous occasions and suffered large losses of capital not soon thereafter.
Once again, we are witnessing the same mistakes being played out in “real time.”
But there is a “difference this time” as noted by the brilliant Harold Malmgren yesterday;

The importance of the point should not be overlooked as it has been the key source of liquidity pushing markets higher since 2009.
But that is now coming to an end via ZeroHedge:
“Yet the time of this unprecedented monetary experiment is coming to an end as we are finally nearing the point where due to a growing shortage of eligible collateral, the central bank support wheels will soon come off (the ECB and BOJ are still buying massive amounts of bonds and equities each month), resulting in gravity finally regaining control over the market’s surreal trendline.
It’s not just central banks, however: also add the one nation which 5 years ago we first showed has put the central bank complex to shame with the amount of debt it has injected in the global financial system: China.
Appropriately, this central bank handoff is also the topic of the latest presentation by Matt King, in which the Citi credit strategist once again repeats that “it’s the flow, not the stock that matters“, a point we’ve made since 2012, and underscores it by warning – yet again – that “both the world’s leading marginal buyers are in retreat.” He is referring to central banks and China, the world’s two biggest market manipulators and sources of capital misallocations.”

With markets heavily leveraged, global growth beginning to show signs of deterioration, breakeven inflation rates falling, and liquidity support being removed – the markets have yet to recognize the change.
So, yes, the breakout in the Technology sector may indeed be the “Chart Of The Year” for 2018. But not for the reason as touted by the overly optimistic “hopefuls,” rather because this could very well mark the “last breakout” of this particular bull market cycle.
Just something to consider.
Lance Roberts

Lance Roberts is a Chief Portfolio Strategist/Economist for Clarity Financial. He is also the host of “The Lance Roberts Show” and Chief Editor of the “Real Investment Advice” website and author of “Real Investment Daily” blog and “Real Investment Report“. Follow Lance on Facebook, Twitter and Linked-In

02:15 – 18:32 – Featured Guest Dr. Martin Murenbeeld and his team know the only way for investors to make money in gold stocks is to get the commodity trends right. That’s why they study, map, and predict gold prices so investors can make informed decisions about capital allocation and risk. Listen to this fascinating conversation Michael has with Martin – Robert Zurrer for Money Talks
…related from Michael: Don Vialoux Calls For Sold Out Commodities To Rally

 Usually the most naturally volatile of markets, Gold Stocks are showing too are showing 14 – 25 year lows in long-term volatility in several indicators. It has been a tough time with the US Dollar rallying with the election of Donald Trump. Sooner or later extreme low volatility will change. Jordan estimates that will occur within the next 18-24 months. R. Zurrer for Money Talks
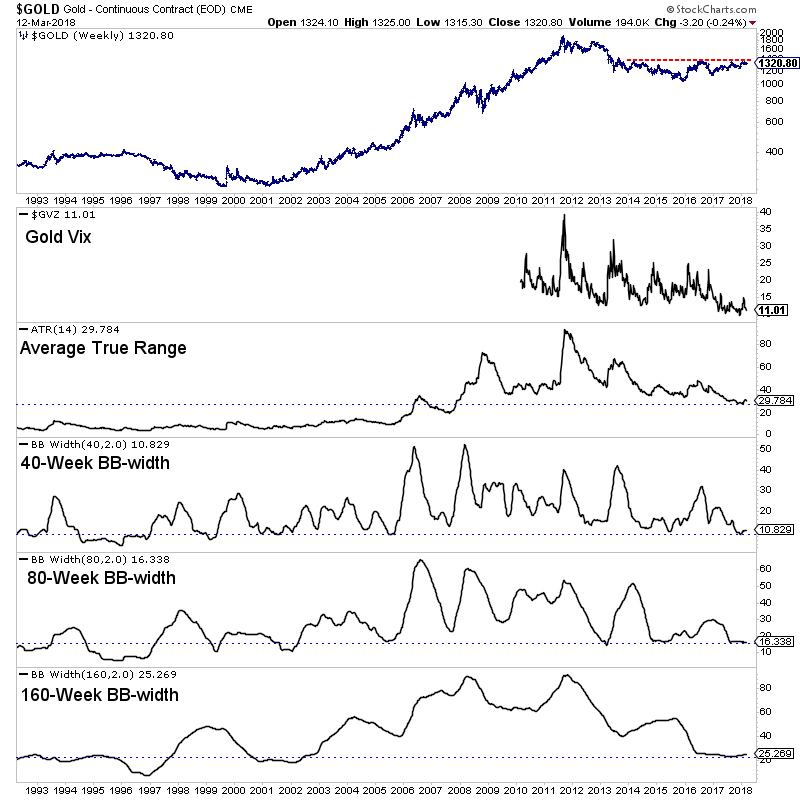
The past 18 months have been difficult for precious metals investors. If you had known Donald Trump would be elected and the US Dollar would soon begin a nearly 15% decline, you would have expected Gold to blow past its 2016 high. You would have been shocked to see the gold miners and junior gold stocks trading lower. Gold has fared okay but the gold stocks and Silver have lagged. As US equities have continued to power higher, precious metals have struggled to perform while volatility in the space has dwindled. Precious metals volatility has reached extremely low levels and this is a sign that a major move, while not necessarily imminent is surely on the horizon.
We plot a weekly bar chart of Gold that includes a handful of volatility indicators such as the Gold Vix (GVZ), Average True Range (ATR) and several bollinger band widths (BBw). These indicators have touched major lows in recent months. The Gold Vix which began trading in 2010 recently touched its lowest level ever at 9. ATR recently touched its lowest level since 2007. The 40-week and 80-week BBw’s recently hit their lowest levels since 2005 while the 160-week BBw recently touched its lowest level since 2002.
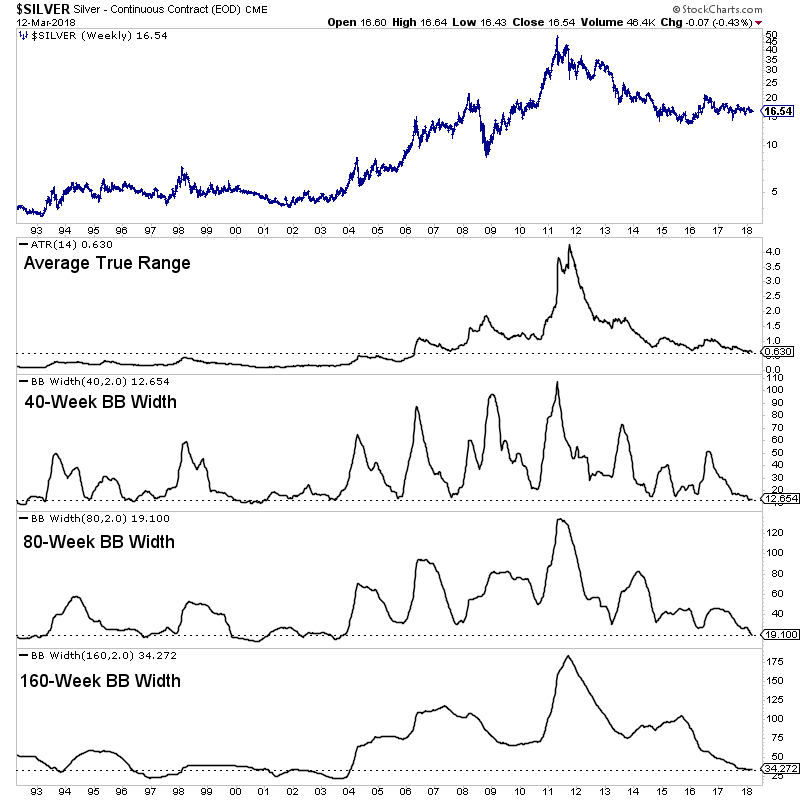
Like Gold, Silver is showing significantly low levels of long-term volatility. Its ATR recently touched its lowest point since 2006. The BBw for three time frames (40 week, 80-week and 160-week) recently touched 14 year lows.
Although the gold stocks are one of the most naturally volatile markets, they too are showing significantly low long-term volatility. Below we plot the NYSE Gold Miners Index, which is the parent index of GDX along with similar volatility indicators. The ATR indicator recently touched a 15 year low. Interestingly, both the 40-week and 80-week BBw’s recently hit some of the lowest points of the past 25 years. The 40-week BBw recently tied 2007 for the lowest point in the past 25 years while the 80-week BBw recently touched a 6-year low and its 3rd lowest point of the past 25 years.

The major markets within the precious metals sector are showing extremely low levels of long-term volatility. At somepoint this will change but we cannot know exactly when. Given our long-term bullish bias, our thinking is volatility could increase as Gold approaches resistance and then accelerate upon a break-out in Gold. Note that low volatility can last for a while and will not suddenly change overnight. It may slowly start to increase at first. While we cannot know when, we do know that extremely low volatility is present and can facilitate a major move over the next 12 to 24 months. With more time ahead before an increase in volatility and a potential break-out we continue to remain patient and accumulate the juniors we think have 500% return potential over the next 18-24 months. To follow our guidance and learn our favorite juniors for the next 12-18 months, consider learning more about our service.
The heart of Tyler’s newletter is how to deal with the fear of missing out. He says the best trades are “easy to find” and to prove it in his Strategy of the Week he selects two stocks that are just breaking powerfully up from a rising bottom with very abnormal price and volume break. – Robert Zurrer for Money Talks

![]()
In this week’s issue:
- Stockscores’ Market Minutes Video – What is Stock Risk?
- Stockscores Trader Training – Don’t Be a Reckless Trader
- Stock Features of the Week – Abnormal Breaks
Stockscores Market Minutes – What is Stock Risk?
Many investors confuse the risk of a stock with the volatility of a stock. This week, I explain this important distinction, provide my analysis of the market and take a different look for the trade of the week on JDST. Click here to watch the video.
To get instant updates when I upload a new video, subscribe to the Stockscores YouTube Channel
Trader Training – Don’t Be a Reckless Trader
Traders, particularly those who need to make money rather than those who would like to make money, tend to have a fear of missing out. They hear about a trading idea or find an opportunity with their own effort and make the trade with less thought than they might put into buying a microwave. They can invest thousands of dollars on an impulse, much like the drunken gambler who throws down $1000 on Five Red.
One reason for this sort of reckless approach to trading is the belief that trading ideas are like gifts. They only come along from time to time and you should feel grateful for the opportunity. If you spend 10 hours researching a company or receive the occasional bit of insight from someone who should know more than the rest of us, it’s easy to understand why you wouldn’t want to let a seemingly promising trade slip through your fingers. The problem is that this gratitude for trading ideas leads you to lower your standards and place trades that are not much more than a gamble.
Have you ever made a trade and then, just a few minutes or days later, asked yourself what the heck you were thinking? If you are normal, then it’s likely that you have because it is easy to focus on the dream of making a profit. You should focus your attention on the trading situation as it has been presented to you by the market rather than the words of an expert. Some trading opportunities are so well marketed that it’s hard to see the truth because you fixate on the profit potential that has been dangled before you as the prize.
It is critical to only take trades that meet the criteria of a strategy that you have found to have a positive expected value. Rather than look for a reason to take the trade, which is easy, look for a reason not to. Ask yourself, “If I buy this stock, who will be selling to me, and what does she know that I don’t know?” Looking at the other side of the argument will often highlight considerations that you have missed.
Being fussy is a lot easier when you recognize that the market-even a slow market-will give you opportunities. The markets have been pretty quiet this year but there are still stocks outperforming the market every day.
And if you can’t find a trade today, tomorrow or in the next week, eventually you will. There is always another bus coming down the road. If you miss one, just wait for the next.
I have found that you will actually make more money by trading less. If you maintain a very high standard for what trades you make, you will always pass on some trades that end up doing very well. By being selective, however, you will also avoid many marginal trades that would tie up your capital and then incur a loss. By being fussy and trading less, you end up taking only the very best trades and your results will be better overall.
It is easy to be fussy when the market is strong and there are lots of opportunities. It’s like fishing when every time you cast your line you get a bite. With that kind of success, you will quickly throw back any fish that is too small because you know there’s going to be something better coming along soon. You only take the best of the best.
When the fish stop biting and you spend hours with no bounty, you take the first fish that grabs your hook. It could be a tiny fish that you would never keep on even an average day, but with your desire to catch something, you keep it anyway. It would be better to have just not gone fishing at all.
You’ll do the same thing when trading a slow market. Eager to make a profit, you will take trades that show some potential even if they don’t meet all of your requirements. You will work hard to uncover a trade rather than wait for the obvious no-brainer trades that you take when the market is in a giving mood.
I like to say that in trading, when the going gets tough, the tough get lazy. You can’t control the market, so if the market is not giving you opportunities, it’s better to do nothing. Your hard work will not change what the market does.
This is hard for many people who have been programmed to relate hard work to success. If you try harder than the next person in a sport, you should get a better result. If you study harder for an exam, you should get a better mark. If you work longer hours at your job, you should make more money. In the stock market, if you work harder to find good trades, you will probably lose money.
The best trades are easy to find. Working hard to uncover something leads you to find questionable trades that you have to talk yourself into. It’s better to walk away when you have doubts.
This is not to say that hard work is not rewarded in trading. Traders who work hard at practicing their analytical skills or developing new strategies will be rewarded. People who devote their time and effort to improving their emotional control will be better traders. These are things that you can control and affect with hard work, but hard work won’t change what the stock market does.

This week, I ran the Action Breaks strategy which is taught in the Stockscores Investor course. It seeks Stockscores Action Candles on the daily interval.

1. VVUS
VVUS made a very abnormal price and volume break today, breaking up from a rising bottom and through the resistance of a downward trend line. Support at $0.47.

2. YRD
YRD breaks out of a pennant pattern on the daily chart with strong volume today. This sets up for a continuation of the long term upward trend after four months of sideways action. Good as a longer-term trade. Support at $39.

If you wish to unsubscribe from the Stockscores Foundation newsletter or change the format of email you are receiving please login to your Stockscores account. Copyright Stockscores Analytics Corp.
References
- Get the Stockscore on any of over 20,000 North American stocks.
- Background on the theories used by Stockscores.
- Strategies that can help you find new opportunities.
- Scan the market using extensive filter criteria.
- Build a portfolio of stocks and view a slide show of their charts.
- See which sectors are leading the market, and their components.
Disclaimer
This is not an investment advisory, and should not be used to make investment decisions. Information in Stockscores Foundation is often opinionated and should be considered for information purposes only. No stock exchange anywhere has approved or disapproved of the information contained herein. There is no express or implied solicitation to buy or sell securities. The writers and editors of this newsletter may have positions in the stocks discussed above and may trade in the stocks mentioned. Don’t consider buying or selling any stock without conducting your own due diligence.

-
I know Mike is a very solid investor and respect his opinions very much. So if he says pay attention to this or that - I will.
~ Dale G.
-
I've started managing my own investments so view Michael's site as a one-stop shop from which to get information and perspectives.
~ Dave E.
-
Michael offers easy reading, honest, common sense information that anyone can use in a practical manner.
~ der_al.
-
A sane voice in a scrambled investment world.
~ Ed R.
Inside Edge Pro Contributors

Greg Weldon

Josef Schachter

Tyler Bollhorn

Ryan Irvine

Paul Beattie

Martin Straith

Patrick Ceresna

Mark Leibovit

James Thorne

Victor Adair