
Currency
At one point the a Zimbabwe bank note was 100 Trillion Dollars. Jack Crooks has spyed another great currency collapse set to unfold. Fortunes will be made shorting the South African Rand. – Robert Zurrer for Money Talks
Quotable
“The malady of normative decay gnaws at order in the person and at order in the republic. Until we recognize the nature of this affliction, we must sink ever deeper into the disorder of the soul and the disorder of the state. A recovery of norms can be commenced only when we moderns come to understand in what manner we have fallen away from old truths.”
–Russell Kirk
Commentary & Analysis
Paradise in hell. Will the South African Rand morph into the Zimbabwe Dollar?

In case you didn’t notice (quite possible because it doesn’t fit the MSM narrative), the esteemed South African parliament, in their infinite wisdom, decided that yes, because the ANC has turned the country into a paradise in hell during its 24-year reign of corruption and incompetence, now is the time to blame white farmers (again) for the country’s problems by confiscating their land (without compensation) and doling it out to political cronies whose skin color most likely won’t be white and farming skills most likely won’t be near the expert category.
Here is the headline from the Daily Mail:
‘We are not calling for the slaughter of white people – at least for now’: South African parliament votes to SEIZE white-owned land as experts warn of violent repercussions
The New York Times, the paper whose slogan should be: All the news fit to spin, refers to this outrageous seizure as “land reform.” Finally, some “justice” say many inside the ANC, and out. So, I guess white South African farmers can feel good knowing it is just “land reform,” and the parliament didn’t vote for slaughter. Well they likely didn’t vote for slaughter because white South African farmers are already being slaughtered, tortured, and raped in impressive numbers. Where is their “justice.” Just asking?
I am looking forward to seeing how this works for South Africa; but I am not optimistic. After all, it seems as if its déjà vu all over again.
This brilliant racist idea of white farm confiscation worked so well for Zimbabwe, South Africa’s neighbor, the country went from a net exporter of its abundant food surpluses across Africa when whites ran the farms (very unfair indeed), into a complete basket-case. The country now cannot feed itself (thinking maybe it’s time for all those brilliant rock stars and actors to gen up a live aid concert so we can all weep and feel guilty about the problems in Zimbabwe—and of course send more money to be siphoned off into offshore bank accounts with nothing going to the people who really need it). Thanks again Robert Mugabe—another bright light African “leader.” Even the new President of Zimbabwe– Emmerson Mnangagwa; a man not exactly considered Mr. Sweetness and Light, admits maybe Mr. Mugabe went too far. You think!
That little rant of mine was supplied as background so I can ask this question:
No matter how far loony left, or racists you might be, at what point do you stop putting any investment capital into South Africa?
I don’t know the answer, as I am not sure why anyone would invest a penny their now. And I sure don’t understand why the South African Rand isn’t completely in the toilet already. But, given the latest outrage from the ruling ANC—darling party of the globalist left—it may not be long before investment starts drying up in a very big way; think of the humanitarian and social crisis in Cape Town, because of water supplies drying up, as a good analogy for the country going forward.

If you trade currencies, getting short the Rand could be the type of trade that makes a year—or more. Demand for the Rand will likely plummet as South Africa continues down the road to Zimbabwe, as the supply of the currency soars. Does anyone remember the Zimbabwe 100 Trillion dollar note? See below if you forgot just how bad it can get.

If Dandy Don Meredith were still with us, he’d likely be warming up his voice getting ready to sing his famous rendition: “Turn out the lights, the party is over!” Stay tuned.
Jack Crooks, President,
Black Swan Capital
772-349-6883/ Twitter: bswancap

Victor Adair has had a superb month in Stocks, Currencies, Crude Oil and Gold. Here is his interview with Michael followed by Victors trading notes for this week and next – Robert Zurrer for Money Talks
The US stock market was a great barometer of risk appetite this week. The DJIA rallied to 3 week highs on Monday but began falling early Tuesday morning (Powell testimony) and was down nearly 1,600 points at Friday’s lows. The prospect of “trade wars” following Trump’s proposed steel and aluminum tariffs contributed to a high volume acceleration of the decline on Thursday. The major American stock indices all registered a Weekly Key Reversal Down.
For the past couple of months my Trading Desk Notes have maintained that risk appetite was “dangerously high” and was due for (at least) a correction. I wrote that: Markets are in a blow-off phase…My gut instinct is to fade this price action…but my risk management override says wait…it could get even crazier! The key aspect of market psychology so far this year has been a willingness to aggressively take on risk. I quoted Bob Farrell, “The public buys the most at the top and the least at the bottom.”
I’ve had 2 key reasons why I thought there could be a significant reversal in risk appetite:
- Looking at the charts I believed that the stock market “melt up” in January was likely the last leg of a parabolic blow off. The DJIA had quadrupled from the 2009 lows, had rallied 45% since the Trump election, and now the public was “beating down the doors” to buy anything and everything.
- The global central banks, which had “underwritten” the 9 year rally in asset prices, were in the process of “changing their ways.”
My short term trading: February was a good month for me as I caught parts of the “correction” in the stock, currency and commodity markets. I started this week short CAD and Euro, and bond puts, and added short gold and short S+P. I closed all of those positions with profits except for the bond puts which I closed for a small loss. I’m flat at the end of the week, but in my managed futures account that Drew manages we remain short CAD and WTI.
The US Dollar rallied to 6 week highs this week but then reversed sharply on Thursday on “trade war” fears.
The Canadian Dollar broke its relationship with the Euro on Thursday…that is CAD kept falling against the USD while the Euro rallied. I think this points to REAL weakness in CAD…which is now threatening to break below the 7750 lows made last fall. The “trade wars” story has real impact on Canada as it pertains to the Nafta renegotiations. The 2 year interest rate spread is ~45 bp in favor of the US and markets may be anticipating “dovish” comments from the BOC at next week’s meeting. Markets are still pricing a 36% chance that the BOC will raise rates in April…I have my doubts!

The Yen has been rising steadily since early January and ended this week at its best levels against the USD since Trump’s election. It’s often called a “safe haven” currency but it was rising in January even as the US stock market was soaring…so there’s something else in play…any unwinding of the massive short Yen positioning in the futures markets could accelerate the rally.
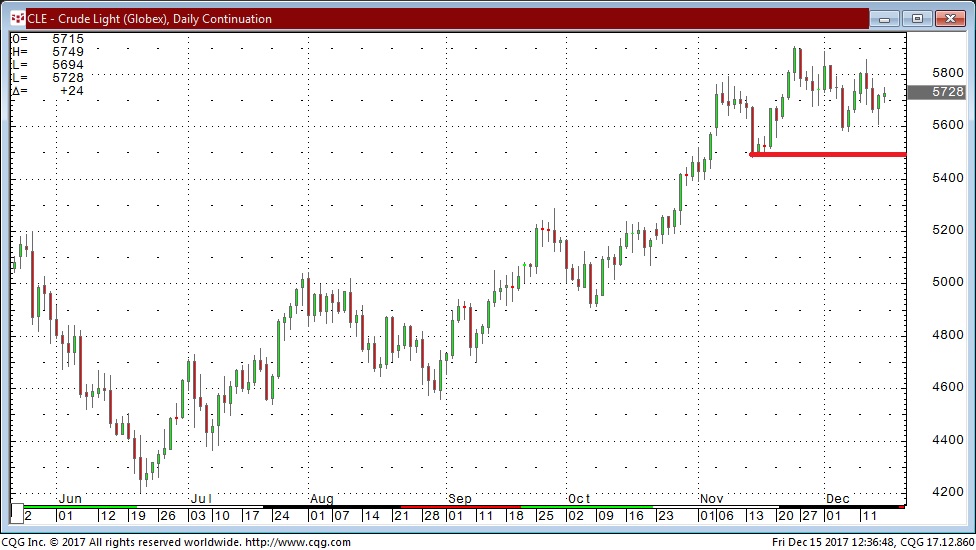
WTI has had a very similar chart pattern to the S+P so far this year…rising through January…falling the first 2 weeks of February only to bounce back the next 2 weeks. This week it rallied on Monday along with the stock market and then fell sharply with the stock market Tuesday through Friday.
PI Financial Corp. is a Member of the Canadian Investor Protection Fund. The risk of loss in trading commodity interests can be substantial. You should therefore carefully consider whether such trading is suitable for you in light of your financial condition. In considering whether to trade or the authorize someone else to trade for you, you should be aware of the following. If you purchase a commodity option you may sustain a total loss of the premium and of all transaction costs. If you purchase or sell a commodity futures contract or sell a commodity option or engage in off-exchange foreign currency trading you may sustain a total loss of the initial margin funds or security deposit and any additional fund that you deposit with your broker to establish or maintain your position. You may be called upon by your broker to deposit a substantial amount of additional margin funds, on short notice, in order to maintain your position. If you do not provide the requested funds within the prescribe time, your position may be liquidated at a loss, and you will be liable for any resulting deficit in your account. Under certain market conditions, you may find it difficult to impossible to liquidate a position. This is intended for distribution in those jurisdictions where PI Financial Corp. is registered as an advisor or a dealer in securities and/or futures and options. Any distribution or dissemination of this in any other jurisdiction is strictly prohibited. Past performance is not necessarily indicative of future results

One thing I really respect about this analyst, Steve St. Angelo, is that he makes a very clear argument using graphics and fundamentals. One look at the first chart certainly tells you which of Real Estate, the Dow Jones or Silver is in the “low risk” position. A well written, strong argument – Robert Zurrer for Money Talks
While silver is completely off the radar to most investors, it will turn out to be one of the best investments to own as the massive amount of leverage in the stock and real estate market evaporates. Unfortunately, investors, today are no longer capable of recognizing when an asset displays a HIGH or LOW risk. Thus, fundamental indicators are ignored as the investors continue the insane strategy of “Buying the Dip.”
A prudent investor is able to spot when an asset becomes a high risk and then has the sense to move his or her funds into one that is a lower risk. However, the majority of investors do not follow this practice as they are caught by surprise when a Market Crash occurs… again and again and again. Even worse, when investors are shown that the indicators are pointing to assets that are extremely risky, then ignore it and continue business as usual.
Today, complacency has turned investors’ brains into mush. They are no longer able to discern RIGHT from WRONG. So, when the market really starts to correction-crash, they will hold on to their stocks waiting for Wall Street’s next BUY THE DIP call.
Regardless, if we can understand the fundamentals, then we would be foolish to keep most of our investment funds in Stock and Real Estate assets. The following chart follows the KISS Principle – Keep It Simple Stupid:

You don’t need to be a highly-trained financial or technical analyst to spot the HIGH vs. LOW-RISK assets in the chart above. Hell, you don’t even need to see the figures in the chart. If we understand that all markets behave in cycles, then it’s common sense that asset prices will peak and decline. We can plainly see that both Real Estate and Stocks asset values are near their top while the silver price is closer to its bottom.
Thus, assets that are near a top are HIGH RISK, and those near a bottom are LOW RISK. It’s really that simple.
Now, if we look at each chart separately, we can easily spot which assets will be the BIG LOSERS in the future. According to the St. Louis Federal Reserve data (FRED), the U.S. Median Home Sales Price of $324,550 is nearly $100,000 higher than the bubble in 2007:

So, the current U.S. Median Home Sales Price is 30% higher than its previous peak in 2007 and 52% above its low in 2009. If I was going to invest in real estate, the best time to do so at a bottom (LOW RISK), then at the top (HIGH RISK). However, Americans are piling into new and existing homes because they believe the prices will continue higher forever. Unfortunately for American homeowners and buyers, the Fed’s current policy to increase interest rates over the next year is not positive for the real estate market.
While U.S. Median home prices are 52% higher than their low in 2009, the Dow Jones Index is a staggering 220% higher during the same period. If U.S. real estate values are HIGH RISK, then the Dow Jones Index must be EXTREMELY RISKY:

Going by the 200 Month Moving Average (MA), shown in red, the Dow Jones Index is 11,000 points higher, or 45% over-valued. However, if we went by the Dow Jones low in 2009, then the index is 73% over-valued. Again, when assets are way above their baseline values, then they enter into a HIGH-RISK category. It doesn’t matter if U.S. home prices or the broader stock markets continue to move higher for a while, they are still highly risky assets.
Now, if we look at the Silver Price, we see a much different setup. Not only is the silver price way off its highs set back in 2011, but it is also just 40 cents above its 200 MA:

With the silver price being 2% above its 200 MA, it is clearly the LOWEST RISK asset compared to the Dow Jones or U.S. residential real estate values. Furthermore, the Commitment Of Traders (COT) Report suggests that the very low net commercial silver short position also indicates that the silver price is bottoming:

The chart above shows that the Commercials present net short position in silver is back to its cycle lows. While the Commercials could continue to liquidate more short contracts, as the silver price falls a bit lower, we are closer to forming a bottom than a top. So, if we use logic, then the silver price is the LOW-RISK asset to purchase and hold while U.S. residential real estate and stocks are HIGH-RISK assets to sell.
Of course, it will take time for these markets to correct, but nothing goes up or down forever. However, the horrible irony of how the markets will play out in the future is to watch investors get wiped out because they are unable to distinguish between HIGH and LOW-RISK assets.
Check back for new articles and updates at the SRSrocco Report.
Is it time to lock in your variable mortgage?
The Bank of Canada has recently raised rates a few times and experts are saying that they expect another 2 rate hikes by the end of the year. This affects you if you have a Variable Rate Mortgage or a Line of Credit (aka HELOC). You can thank the increasing strength of the global economy for that.
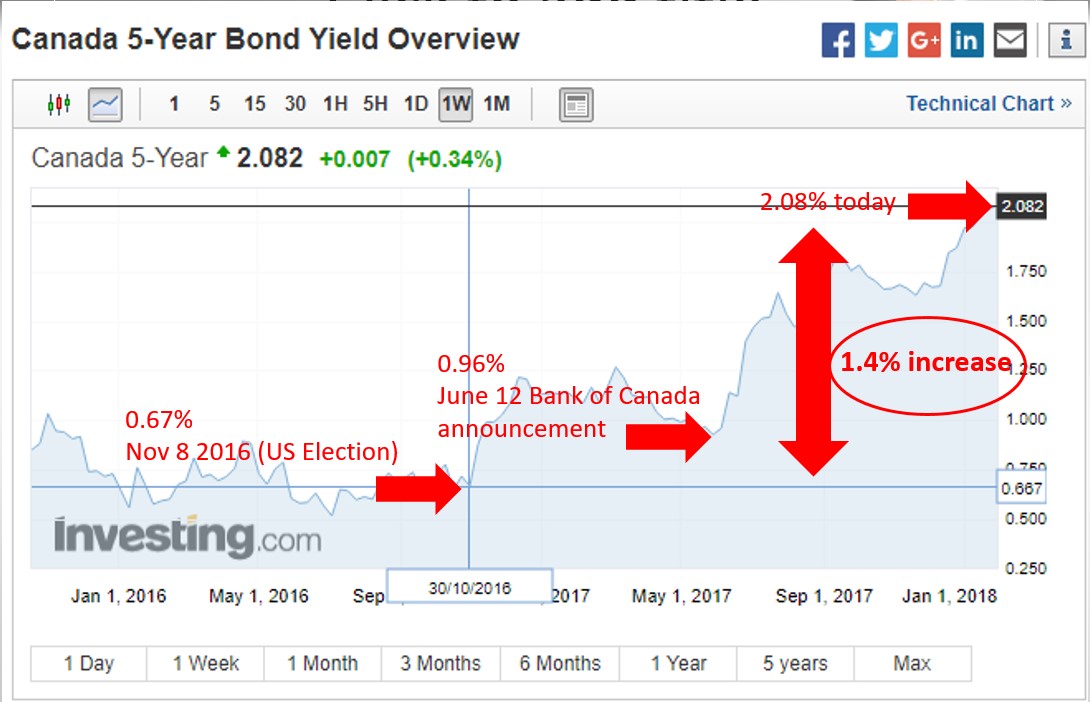
Bond yields, from which the fixed rate mortgages in Canada are derived, have been climbing significantly over the past 14 months.
So the question is, “should I lock in my variable rate”?
Due to many variables, this is a difficult question to answer immediately answer, everyone’s own personal situation is unique. There is no one size fits all…
Well, there are 3 main considerations:
- Your current variable interest rate,
- Your future goals and housing/mortgage plans, and
- Your potential new fixed rate (this is a big one).
If your variable rate has increased to 3% and over, you may want to think about locking in. We suggest you talk to your bank about what they would offer you to lock in, and convey those rates to our team to see if it makes sense to lock in with your existing bank or transfer the mortgage to another lender.
If your mortgage fits a certain qualification box (called insurable), vary attractive rates that are about .4% lower than the banks are available. It may make sense to break your mortgage with your bank and transfer to another lender if the difference in rates is large enough to offset the penalty to move the mortgage. To be qualified for the best rates right now, an insurable mortgage must follow the following criteria:
– Mortgage funded before Oct 2016
– Owner occupied or if a rental, must be 2+ (legal) units
– No refinances allowed, but you can transfer your mortgage as long as you are not adding any more money to your mortgage
Current insurable 5 year fixed rates are around 3.19%. Uninsurable rates are around 3.59%.
However, variable rates may be preferable over the fixed because the variable rate has the lowest prepayment penalties. Variable rate prepayment penalties are below 1% of the mortgage, where fixed rates at big banks can be 4%+ of the outstanding mortgage. Insurable 5 year variable rates are as low as Prime -.95% (2.5%)
If you have a Line of Credit (aka HELOC) and are not using it to its potential or have a balance sitting on it, you should call me to discuss if that is what is best for you. The rates on a HELOC are higher than a mortgage and it may make sense to lock that in.
Call ASAP for more details and don’t miss this window of opportunity!
Amidst the hurricane of a plunging/soaring/plunging Stock Market Dr. Sieron reviews the facts of Gold’s performance against the S&P 500, Oil, US Dollar & the Fed’s inflation rate – Robert Zurrer for Money Talks
One month after the February stock market rout is an excellent time to step back and review all the facts – and their implications for the gold market. Here’s exactly what happened – and what it implies for your capital allocation.
- After more than a year of continuously advancing, the S&P 500 fell nearly 10 percent in five days.
- The sell-off was allegedly triggered by the surprisingly strong January jobs report, showing the acceleration in wage growth. That released fears of higher inflation, which could prompt the Fedto tighten its stance further. As President Trump rightly pointed out (on Twitter, of course):
in the “old days,” when good news was reported, the Stock Market would go up. Today, when good news is reported, the Stock Market goes down.
- The stock market correction came on top of bond market tumble. The 10-year Treasury yield jumped from 2.72 percent on January 31 to 2.84 percent on February 2. Analysts claim that bond yields also spiked due to inflation concerns.
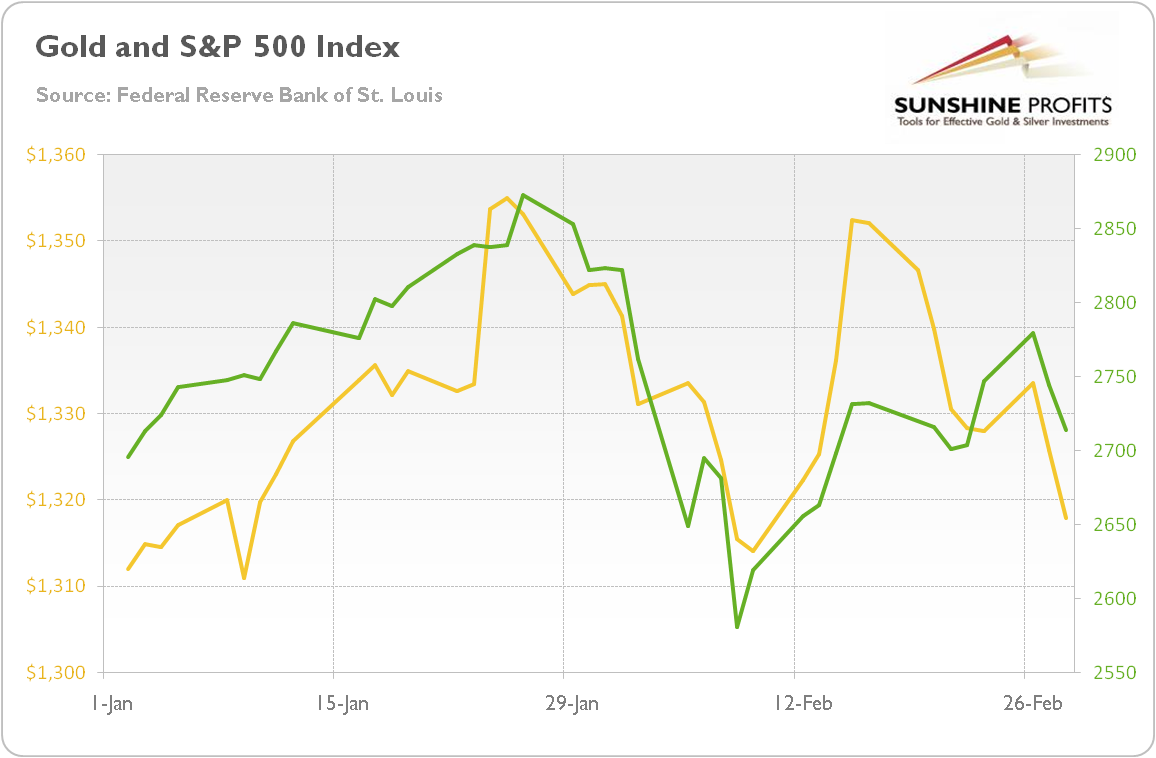
- Gold didn’t offer a hedge against stock market turmoil. Instead, it shared with equities the fears against a more hawkish Fed and moved in tandem with stocks, as one can see in the chart below. The correlation between these two assets this year is about 0.6, which is pretty high.
Chart 1: Gold prices (yellow line, left axis, London P.M. Fix, in $) and S&P 500 Index (green line, right axis) from January 1, 2018 to February 28, 2018.
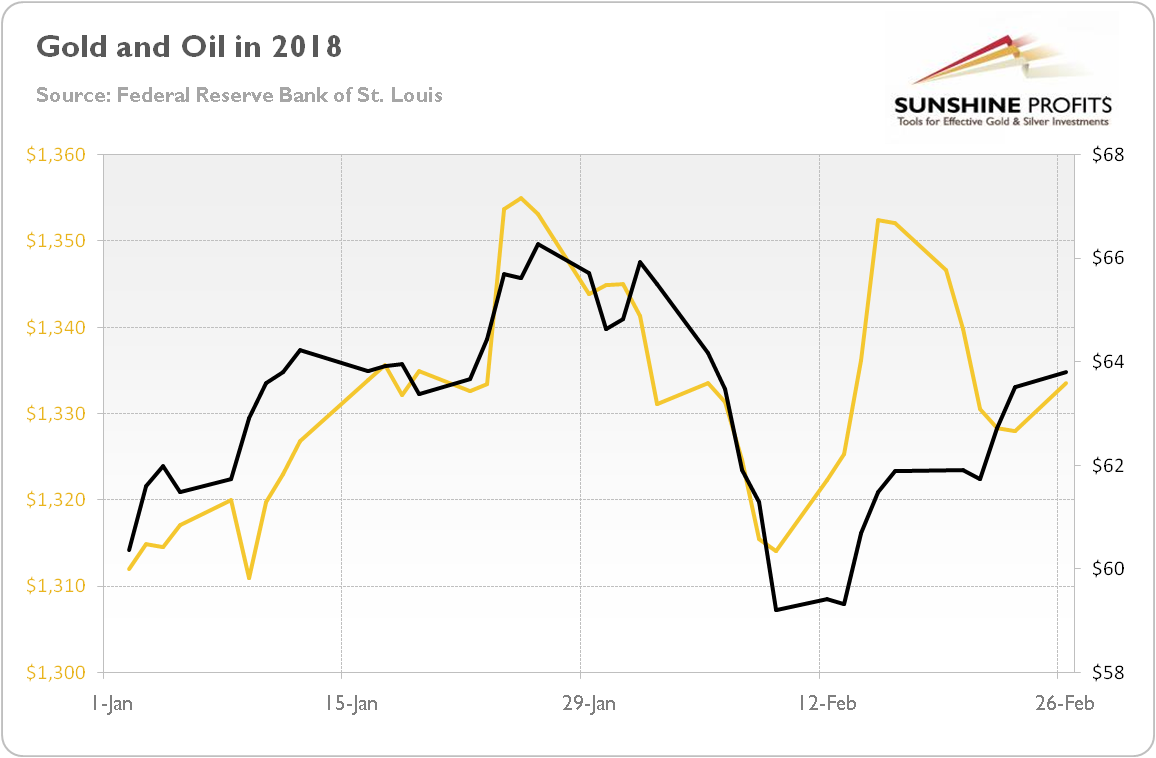
These are facts. But what do they imply for the future? Are they changing the economic outlook? Not really. First of all, fears of inflation are clearly exacerbated. Just look what happened to the oil prices in February. It doesn’t suggest that enormous inflation is coming. And it doesn’t bode well for bullion, given the strong correlation (almost 0.6 – see also the chart below) between the yellow and black gold in 2018.
Chart 2: Gold prices (yellow line, left axis, London P.M. Fix, in $) and oil prices (black line, right axis, WTI, in $) from January 1, 2018 to February 26, 2018.
And the basic rule of fundamental investing is to not overreacting to a single government report (or any statistics), especially to January data, as they are often revised later.
Second, we don’t deny that yields increased. This is a hard fact. But what really matters is why they rose. As a reminder, the nominal interest rates can be split into real interest rates and inflation premium. The data clearly says that inflation expectations weren’t the key driver lifting the 10-Treasury yields. Actually, they dropped, as one can see in the chart below, which paints the 10-year breakeven inflation rate, i.e. the difference between 10-year Treasury yields and 10-year Treasury yields indexed by inflation).
Chart 3: 10-year breakeven inflation rate (the difference between 10-Year Treasury Constant Maturity Securities and 10-Year Treasury Inflation-Indexed Constant Maturity Securities, in %) from January 1, 2018 to February 14, 2018.
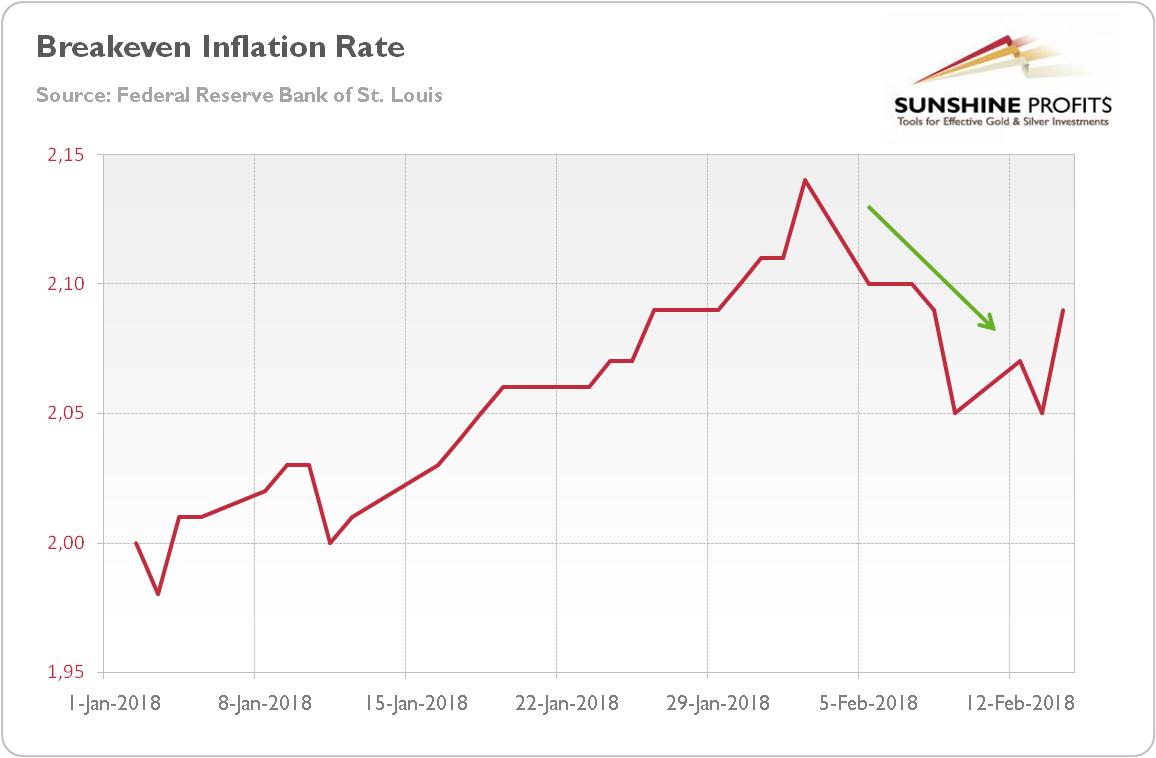
It means that, contrary to popular narrations, the bond yields didn’t jump because of inflation fears. Instead, the real interest rates soared, pulling nominal yields higher. Now, the question is: why did the real rates increase?
Some analysts believe that they rose, as investors expected acceleration in the economic growth. It might be the case, as the U.S. dollar strengthened during the bond market turmoil and the stock market rout, as the next chart shows. If true, bad times are approaching for gold, as higher yields are not worrying if they signal global growth and a return to normalcy.
Chart 4: Gold prices (yellow line, left axis, London P.M. Fix, in $) and the Broad Trade Weighted U.S. Dollar Index (red line, right axis) from March 2017 to February 2018.
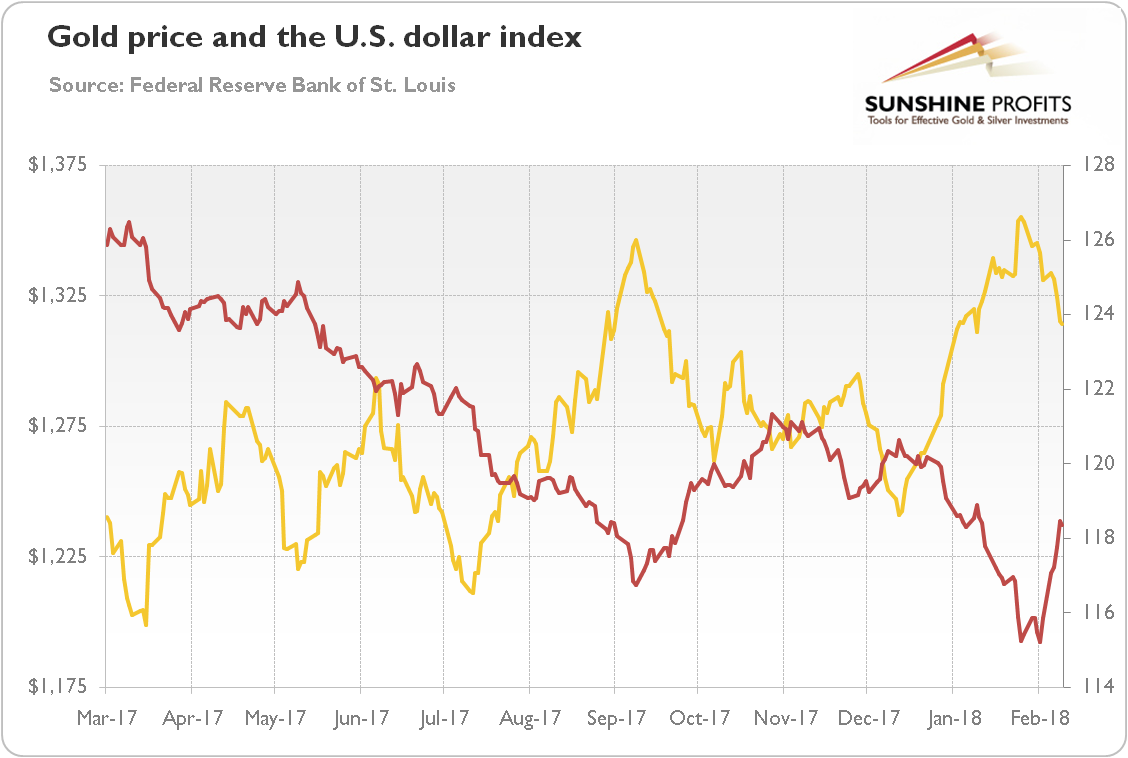
However, there might be another explanation. You see, tectonic shifts in the supply and demand for Treasuries are unfolding. The Fed unwinds its purchases, while the Congress unwisely widens the fiscal deficit (tax cuts and higher expenditure do the job), boosting issuance of bonds. The combination of weaker demand and stronger supply implies higher yields. In this scenario, gold could shine – despite the higher real interest rates. The fears of higher fiscal deficit – or even a twin deficit – may explain the recent breakdown of the well-established highly negative correlation between gold and real interest rates. Adding to the deficit when the economy is growing above the trend isn’t the smartest fiscal policy – but, hey, this is when gold enters the scene, as a hedge against policymakers’ foolishness.
Summing up, a few weeks have passed since the stock market sell-off. It is a good time to look from the distance. Contrary to many alarmist opinions, the sky is not falling. Inflation is not skyrocketing. The interest rates have been rising, but together with corporate earnings. Hence, the correction was needed, but the fundamentals remain healthy – and the stock market has more upside laying out before itself. It means that neither inflation nor the stock market bear market is likely to support the price of the yellow metal. Luckily, the unsound U.S. fiscal policy and the greenback are now doing both doing a good job. Two real friends of gold.
If you enjoyed the above analysis and would you like to know more about the most important macroeconomic trends influencing the price of gold, we invite you to read the March Market Overviewreport. If you’re interested in the detailed price analysis and price projections with targets, we invite you to sign up for our Gold & Silver Trading Alerts. If you’re not ready to subscribe yet and are not on our gold mailing list yet, we urge you to sign up. It’s free and if you don’t like it, you can easily unsubscribe. Sign me up!
Thank you.
Arkadiusz Sieron, Ph.D.
Market Overview Editor

-
I know Mike is a very solid investor and respect his opinions very much. So if he says pay attention to this or that - I will.
~ Dale G.
-
I've started managing my own investments so view Michael's site as a one-stop shop from which to get information and perspectives.
~ Dave E.
-
Michael offers easy reading, honest, common sense information that anyone can use in a practical manner.
~ der_al.
-
A sane voice in a scrambled investment world.
~ Ed R.
Inside Edge Pro Contributors

Greg Weldon

Josef Schachter

Tyler Bollhorn

Ryan Irvine

Paul Beattie

Martin Straith

Patrick Ceresna

Mark Leibovit

James Thorne

Victor Adair