About the Author
Przemyslaw Radomski, CFA, is the founder, owner and the main editor of SunshineProfits.com.

This analyst argues the HUI is going to drop down tor the 100 level at which point the opportunity in mining stocks willl be one in a lifetime. As he says “this may sound ridiculous, but the HUI at 200 sounded just as ridiculous when it was trading above 500 in late 2012. Yet, a year later, that’s exactly the value that we saw”. All 10 charts will enlarge with a click. – Robert Zurrer for Money Talks
 The price of no asset can move up or down in a straight line, so why should mining stocks be any different? They have been declining relentlessly for almost 2 weeks, erasing more than 10% of their value. Sharp? Definitely. Unsustainable? Perhaps. When will the turnaround take place? It depends.
It depends on the bullish signs and confirmations that we get. The correct question to be asking now is: “Why do we need any confirmations at all?” The reply is that because the situation is tense as there are good reasons for both a turnaround in a day or two and a continuation of the decline without a meaningful correction.
Before moving to the above details, we would like to give you an update on the gold-stock link. Let’s start with gold’s price compared to the S&P 500 Index (charts courtesy of http://stockcharts.com).
.png)
As we explained previously, there’s one thing that – right from the start – differentiates between the two kinds of reaction: stocks declining along with gold and stocks triggering a rally in gold. Autocorrelation. Autocorrelation is a fancy way of saying that what happens first makes the same reaction likely, which makes the follow-up to the follow-up likely to be the same as well – and so on. In other words, the way gold initially reacted to the decline in the S&P 500 was the way in which it kept on reacting in the following weeks and – sometimes – months.
What kind of price action did we see in the previous several days (not only yesterday)? On average, the S&P declined along with gold. So, what’s the likely impact that a declining stock market is going to have on the precious metals market? It’s likely going to be negative in the following weeks and – perhaps – months.
At this point, you may correctly ask: “If that’s the case, then why didn’t gold decline on Monday?” There are several reasons as to why this was not the case.
The simplest one is that the relationship described in the previous paragraph is supposed to work on average, but it doesn’t mean that gold and the S&P will move in the same direction on every single day. The metals didn’t react by soaring higher on Monday – they moved up rather insignificantly. Plus, miners were lower anyway.
The second thing is that Monday’s session was particularly volatile – something that investors were not prepared for emotionally. Some of them had probably bought gold and silver in hope of hedging themselves. After the session it turned out that it was not that helpful (the S&P was down 4%, while gold was almost flat, moving higher by less than 0.5%), so the following days of the general stock market’s decline may be characterized be much smaller willingness of the investors to purchase precious metals in hope of hedging their stock portfolios.
Yesterday’s session served as a confirmation of the “on average” type of link. On Monday stocks declined severely, while gold moved a bit higher. During yesterday’s session stocks moved a bit higher, but gold declined almost $20. On average, both assets declined. The link, as well as the bearish implications, remains intact.
.png)
Moreover, even though the gold to S&P 500 ratio moved higher, there was no invalidation of the previous breakdown – only a move back to the previously broken support / resistance line. The 2016 and 2017 lows seem to provide strong resistance, just as they provided strong support in the previous years. The implications are bearish for the ratio and for the precious metals sector.
.png)
As far as silver is concerned, we see a corrective upswing that follows a sharp slide and a breakdown below the previous lows. A corrective upswing is something very natural at this stage of the decline and should not be viewed as a reversal.
We marked similar situations with black rectangles. Virtually all big declines had this kind of pause before the slide continued, so seeing one now is definitely nothing odd or bullish. Interestingly, in two cases (April 2017 and June 2017) silver corrected from below the 50-day moving average to slightly above it only to plunge in the following days. So far, the price action is similar.
Please note that the pauses didn’t take more than a couple of days, so it seems that this pause is over or about to be over.
Having said the above, let’s move to the questions that we raised in the opening paragraph of today’s analysis. We wrote that the situation is tense as there are good reasons for miners to reverse sooner rather than later and that there are reasons for the decline to continue. Let’s see them in detail.
.png)
In the case of the gold stocks to gold ratio, we definitely have bearish implications. It was already after Monday’s closing price that we saw a small breakdown below the 2017 and 2016 lows, however, based on yesterday’s decline, the breakdowns are now clearly visible.
This opens the road to much lower valuations. Still, let’s not forget that verifications of breakdowns happen from time to time. For instance, in late October 2017, the ratio broke below the previous lows and consolidated before diving deeper. This corresponded to a relatively small – but still – corrective upswing in gold.
Then again, the above might have simply been a result of the cyclical turning point in gold (and in mining stocks). Consequently, it’s not clear if the preceding breakdown resulted in a verification, which in turn resulted in a small rally in gold. It seems more likely that it was the other way around. Gold and miners reversed their courses temporarily because of the turning point, but the corrective upswing was relatively small as – among other factors – the HUI to gold ratio was after a major breakdown and thus, there was a limit to how high the ratio and gold were eager to rally.
So, the question becomes, if we have a turning point nearby.
.png)
Not really, we already had one at the beginning of the month and it seems that the turnaround that preceded the turning point was the development that was likely to happen based on it.
Wait, there are turning points for mining stocks as well?
In short, yes, but it’s nothing entirely new – the turnings point for mining stocks are the turning points for gold, with additional sub-cycles in between.
We’ve been recently asked if it’s true that mining stocks have turning points between the 4th and the 10th day of the month. The reply is that this was the case in the previous year – but it’s moving toward the scenario in which the turning points are seen at or very close the end of the month. Consequently, the next turning point is not this week, but it’s already behind us and the next one is at the end of February and the beginning of March.
In other words, there’s not much more to the 4th to 10th day of the month rule – it’s a cycle that will likely be continued, but the above rule will likely not. If you’ve been following our analyses for some time, you knew about this cycle all along (precisely, about every other cycle as that’s what appeared most useful for the gold market).
The additional thing that we can see on the above chart is that the volume that accompanied yesterday’s decline was quite sizable, so the bearish implications of the price-volume link remain in place.
So, based on the gold stocks to gold ratio and the turning points for mining stocks (GDX, HUI and XAU), it doesn’t seem that the turnaround has to be seen shortly or that it’s likely.
Still, let’s keep in mind that if the current bearish momentum persists, mining stocks will reach their 2017 lows very soon. The RSI indicator is already close to the 30 level and since reaching it is a classic buy signal for the short term, we may see at least a corrective upswing soon.
Overall, based on the previous two charts, it seems that we may indeed see a corrective upswing once miners move to (or very close to) their 2017 lows, but it’s not likely that the upcoming rally will be anything significant.
The long-term HUI Index chart shows that one should indeed think at least twice before trying to time the upcoming correction.
.png)
Let’s start with the thing that’s easiest to interpret. We just saw a long-term sell signal from the Stochastic indicator. Last year we saw it only twice and, in both cases, a big decline followed. This was the case also multiple times in the preceding years. Consequently, the implications here are bearish.
The thing that’s more complex, but also more rewarding from the analytical point of view, is the continuation of the analogy to the 2011 – 2013 period.
The 2011 and 2016 tops were preceded by substantial rallies, but they were shortly followed by big and sharp declines, and then by corrective upswings. This, by itself, is not enough to view these situations as similar, but the additional details are. These additional details are the sizes of the corrective upswings (about 50% in both cases as marked using Fibonacci retracements) and the – approximate – time that it took for the corrections to materialize. We marked the latter using red dashed lines. As you can see, the horizons are almost identical.
The declining purple, dashed line is a line connecting the top with the top of the first local move up during the decline. In this case, the price that was reached is correct only approximately and the time seems to be off for more than a month. The latter seems to be a violation of the analogy, but please keep in mind that the last couple of weeks were characterized by a sharp slide in the value of the USD Index that was only reflected in the PM prices to a small extent. In fact, in terms of the euro, gold topped very early in January, and taking this date into account would imply only a small deviation in the analogy present on the above chart. Overall, it seems that we can still view the analogy as present.
The interesting fact about both initial local tops during the correction (the late-2012 one and the most recent 2018 one) is that they formed close to previous local tops.
What are the overall implications of the above? We should expect a big and volatile decline to follow. Last week’s performance and what we’re seeing this week seems to be just the very first sign of what’s to come. If the 2013 move is repeated, then we are likely to see the HUI Index well below the 100 level before the bottom is really in.
This may sound ridiculous, but the HUI at 200 sounded just as ridiculous when it was trading above 500 in late 2012. Yet, a year later, that’s exactly the value that we saw.
What does the above imply for the near term? Back in 2013, there was no visible corrective upswing until the HUI broke below the previous major low (the 2012 low). The analogous low is the late-2016 bottom, which is relatively far. So, if the analogy is to continue, then gold miners may move significantly lower without a bigger move higher.
Summing up, the outlook for the precious metals market is bearish for the following weeks and it seems that even if we see a corrective upswing shortly, it will not be anything spectacular. At least not until gold stocks move to their 2017 lows.
On a side note, please note that our bearish comments on the precious metals sector doesn’t make us an enemy of gold and silver investors – it makes us a true (!) friend. If you ask your friends how you look before going to an important meeting, everyone will tell you that you look great regardless of the truth as they will prefer not to be the ones that ruin your mood by saying something unpleasant. But a true friend will tell you how things really are, so that you can fix something before your leave. This may be unpleasant, but ultimately, it’s the second approach that benefits you.
Most gold promoters will want you to think that gold is going to go higher no matter what happens and all you should do is buy, buy, buy. And then buy some more. They don’t want to risk upsetting you. But not us. We’re that true friend that tells you what they think and why, regardless of the possibility of being unpleasant – so that you can benefit more. In this case, if we’re correct about the bearish outlook for the precious metals, it will be much more profitable to be buying at lower prices than at the current ones.
So, in our view, the outlook for the precious metals market is friendly bearish. The precious metals market is likely to move much higher in the coming years, but if we’re correct about the medium-term decline first, then the best buying opportunity is still ahead of us.

“For the first time in a decade, we are looking at across the board global growth in both developed and developing economies, setting up tremendous demand for commodities”. In another on the theme of on incoming bull market in commodities (see Jack Crooks brilliant forecast), that comment above is proven with argument and facts by Richard Mills in this article. Another well worth ingesting – Robert Zurrer For Money Talks
The global economy is booming again after years in the doldrums, commodities are back in a big way, and metals prices are for the most part, way up.
In our last article showing how commodities are the place to be in 2018, we looked at five drivers: inflation, the low dollar, economic growth, the relative undervalue of commodities versus other sectors, and tightness of supply. This article expands on the economic growth argument and explains how commodity prices are being moved by a bevy of infrastructure projects around the world – all demanding “yuge”, as Donald Trump would say, amounts of metals.
But we’ll also talk about how insecurity of supply has created a climate of uncertainty around commodities, fuelled by increasing trade tensions that could lead to tariffs and quotas, driving up the prices of some imported metals – further exacerbating supply-demand imbalances. The US is finally starting to get that it must reduce its reliance on foreign metal suppliers, which is great for domestic exploration and mining. But first, let’s talk about global growth and what it means for commodities.
A year ago the global economy was stagnant following the recession of 2007-09, an overhang from the debt crisis in Europe, and slowing Chinese growth which had seen double-digit GDP numbers throughout the 2000s. According to the International Monetary Fund, 75% of the world is now enjoying a full recovery. The IMF predicts global growth to hit 3.7% this year, the fastest rate since 2010.
The World Bank says it’s the first year since the financial crisis that the global economy will operate at or near capacity. Emerging markets will see the lion’s share of growth, 4.5%, while advanced economies including the US, Japan, and the EU will grow at 2.2%. China is expected to grow between 6 and 7%. India, Ghana, Ethiopia and the Philippines will grow more than China, and eight of the 10 fastest-growing countries this year are likely to be in Africa, according to consulting firm PwC.
Goldman Sachs was quoted saying that “rising commodity prices will create a virtuous circle, improving the balance sheets of producers and lenders, and expanding credit in emerging markets that will, in turn, reinforce global economic growth.”
At the end of 2017 the Bloomberg Commodity Index, which measures returns on 22 raw materials, had the longest rally on record dating back 27 years to 1991.

Jordan Roy-Bryne produces some of the best charts, today he’s put together some very clear chart on the Treasury Bond market, its relationship to Gold and the Gold to Stocks ratio. Worth a look – Robert Zurrer for Money Talks
Gold was well bid during the equity correction but it could not breakout then and has retreated as equities have roared back. As a result, the Gold to stocks ratio has retraced most of its recent surge. Meanwhile, the US Dollar has rebounded and the oversold and overhated bond market could be starting a rally. The recent rise in long-term bond yields which has benefitted Gold appears due for a pause or correction. Meanwhile, Gold could also correct and consolidate as it waits for a breakout in long-term bond yields which should in turn benefit Gold.
As we noted in One Big, Potential Catalyst for Gold in 2018, Gold is no longer trading with bonds and therefore could benefit from a big breakdown in bonds. As the chart below shows, the bond market has experienced a major breakdown. In recent days, the 5-year, 10-year and 30-year bonds all touched multi-year lows.
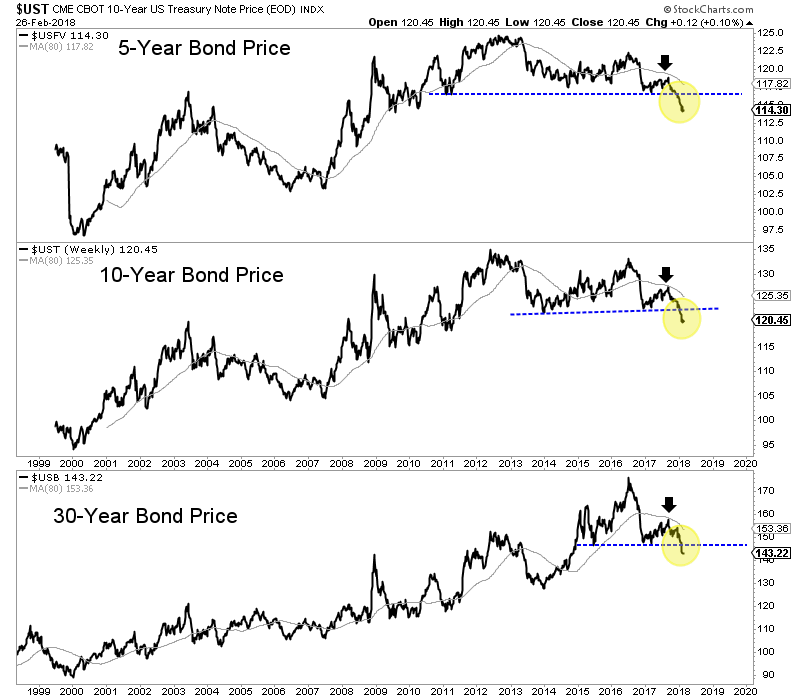
The breakdown in the bond market has helped Gold rally but why hasn’t Gold reached the corresponding multi-year highs?
First, we should remember that the correlation between Gold and bonds was positive until November 2017. The market has begun to sense inflation only recently.
Second, while bond prices have broken down to multi-year lows, bond yields (and specifically long-term yields) have yet to breakout to multi-year highs.
The chart below shows long-term yields are testing multi-year resistance. For the 10-year yield, a strong push above 3.00% would mark more than a 6-year and almost 7-year high. A break above 3.25% in the 30-year yield would mark a 4-year high.
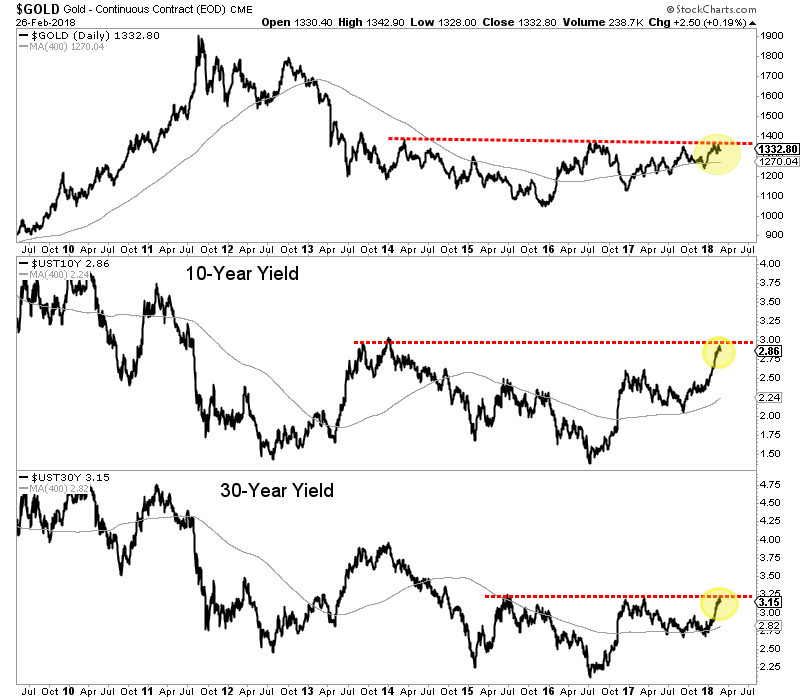
We have argued that Gold was unlikely to breakout immediately due to its lack of relative strength as well as the lack of strength from Silver and the gold shares.
If that remains the case then we would also expect bond yields to correct and digest their recent advance rather than breakout. We should also note that the daily sentiment index for bonds hit an 18-day average of 15% bulls. That is a bearish extreme and suggests the probability that bonds will rebound and yields will decline.
Gold could be waiting for a major breakout in bond yields, which would be a reflection of increasing inflation and inflation expectations. It would also result in more pressure on the economy and therefore the stock market. That would benefit Gold in both nominal and real terms. We expect a counter-trend move in Gold and bond yields before a breakout. This will allow us a bit more time to position in the juniors that should deliver fantastic returns.
Jordan Roy-Bryne

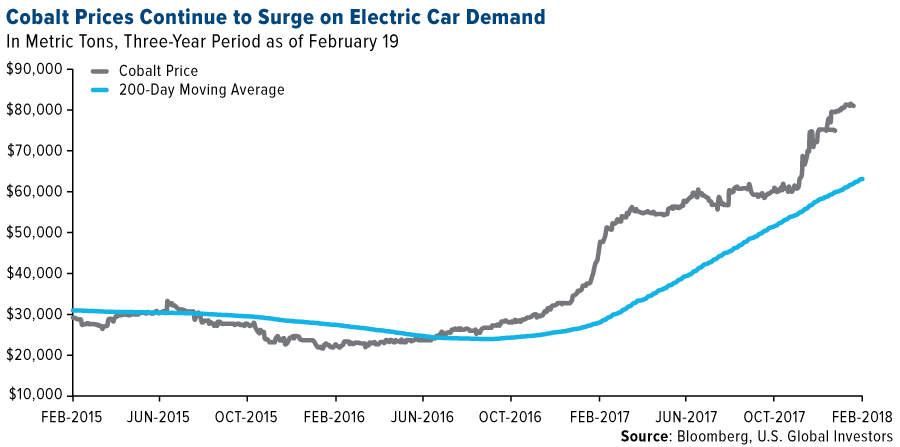
Cobalt has soared 180 percent in the past 3 years, driven by demand and a increasing absence of supply. There is lots of cobalt to be mined though and Apple has embarked on a program to buy directly from miners. With an imminent 8 bull market in commodities coming (Jack Crooks: The Next Big 8 Year Bull Market) Frank Holmes outlines the opportunities and describes one of the companies Apple is in negotion with – Robert Zurrer for Money Talks
 Disney’s Black Panther is in theaters right now, breaking all kinds of box office records and wowing audiences. The film features a fictional, highly-advanced African country known as Wakanda, whose vast wealth and prosperity are derived almost exclusively from the mining of a rare, fantastical metal called vibranium.
In its own colorful way, Black Panther does an excellent job dramatizing mining’s important role in supplying the world with much-needed raw materials. Vibranium is the basis for everything in the film, from the title character’s flashy superhero suit to Wakanda’s otherworldly infrastructure and vehicles, to its futuristic medicine and weaponry.
Like Wakanda, the real Africa is rich in minerals and metals, many of them extremely valuable. Think platinum and palladium in South Africa, diamonds in Botswana, copper in Zambia and cobalt in the Democratic Republic of the Congo.
Unfortunately, many African countries have not been managed as well as the one depicted in the film. Corruption and fiscal instability, coupled with inconsistencies in taxation and mining policies, make operating on the continent challenging for foreign producers, to say the least. Three years ago, I argued that Africa could mine its way to prosperity if only it addressed the hindrances that keep explorers and producers away. I stand by those words today.
Consider Congo, which produces roughly two-thirds of the world’s cobalt, an essential component in lithium-ion batteries. Lawmakers there recently voted to raise taxes and royalties on profits and metals produced. That includes cobalt, whose price has soared 180 percent in the past three years on red-hot electric vehicle (EV) demand. The country’s state-owned mining company, Gécamines SA, is also pushing the government to renationalize the entire mining industry.
Admittedly, the fictional Wakanda appears to have a nationalized metals and mining sector. But because the country is so advanced and self-sustaining, it has no need for outside investment. That’s not the case with many real-life African nations, which are literally, in some cases, sitting on a gold mine.
But let’s focus on cobalt for a moment. Global demand for the brittle, bluish-white metal has skyrocketed in recent months, exceeding 100,000 metric tons for the first time last year, according to mining consultant CRU Group. Over the next 10 years, it’s projected to grow at a compound annual growth rate (CAGR) of 11.6 percent.
And because around two-thirds of the world’s supply is mined in the highly unstable Congo, a supply shortage is likely brewing.
“There just isn’t enough cobalt to go around,” George Heppel, a CRU consultant, told Bloomberg in January. “The auto companies that’ll be the most successful in maintaining long-term stability in terms of raw materials will be the ones that purchase the cobalt and then supply that to their battery manufacturers.”
Automakers aren’t the only ones with this idea. Bloomberg reported last week that Apple, the world’s largest end user of cobalt, is in talks to buy the metal directly from miners. The move would help the iPhone-maker not only save many billions of dollars in the long term but also be more transparent about how the metal is sourced, as there have been concerns about illegal mining operations and the use of child labor.
Details are scarce at this point, but Bloomberg writes that “Apple is seeking contracts to secure several thousand metric tons of cobalt a year for five years or longer.”
One of the miners the company is rumored to be speaking with is Switzerland-based Glencore, the 14th largest company in the world by revenue as of 2016, according to the Fortune Global 500. This would make sense, as Glencore—the best-performing London-listed miner last year, finishing up 41 percent—has been positioning itself as the go-to supplier of cobalt and other metals that are used in so-called clean tech, including copper, nickel, and zinc.
Glencore stock jumped more than 5 percent last Wednesday after the company reported phenomenal performance in 2017 that CEO Ivan Glasenberg describes as “our strongest on record.” Earnings before interest, taxes, depreciation, and amortization (EBITDA) rose 44 percent year-over-year, from $10.3 billion to $14.8 billion, led by higher commodity prices and “enhanced” mining margins.
Sure to make investors happy, the company also declared a distribution of $2.9 billion, or $0.20 per share, to be paid in two installments this year.
The earnings report made no mention of Apple—or smartphones, for that matter—but it did emphasize the high rate of growth in electric vehicle investment, which is expected to greatly benefit cobalt demand.
“Global automaker investments now total more than $90 billion, with at least $19 billion attributed to the U.S., $21 billion to China and $52 billion to Germany,” Glasenberg writes. “Volkswagen alone plans to spend $40 billion by 2030 to build electrified versions of over 300 models.”
Over the next three years, Glencore’s cobalt production growth is projected at 133 percent, followed by nickel at 30 percent and copper at 25 percent.
This year alone, the company believes it will produce as much as 39,000 metric tons of cobalt, up 42 percent from 27,400 tons last year.
Frank Holmes of US Global Investors
Curious about investment opportunities in cobalt and other natural resources? Click here!
All opinions expressed and data provided are subject to change without notice. Some of these opinions may not be appropriate to every investor. By clicking the link(s) above, you will be directed to a third-party website(s). U.S. Global Investors does not endorse all information supplied by this/these website(s) and is not responsible for its/their content.
The Consumer Price Index (CPI) is one of the most widely recognized price measures for tracking the price of a market basket of goods and services purchased by individuals. The weights of components are based on consumer spending patterns.
There is no guarantee that the issuers of any securities will declare dividends in the future or that, if declared, will remain at current levels or increase over time.
Holdings may change daily. Holdings are reported as of the most recent quarter-end. The following securities mentioned in the article were held by one or more accounts managed by U.S. Global Investors as of 12/31/2017: Glencore PLC.


I know Mike is a very solid investor and respect his opinions very much. So if he says pay attention to this or that - I will.
~ Dale G.
I've started managing my own investments so view Michael's site as a one-stop shop from which to get information and perspectives.
~ Dave E.
Michael offers easy reading, honest, common sense information that anyone can use in a practical manner.
~ der_al.
A sane voice in a scrambled investment world.
~ Ed R.

Greg Weldon

Josef Schachter

Tyler Bollhorn

Ryan Irvine

Paul Beattie

Martin Straith

Patrick Ceresna

Mark Leibovit

James Thorne

Victor Adair