
Timing & trends
A great, clear analysis of previous bubbles, bear markets & crashes and the ultimate conclusion of the Fed’s desire to prevent any of the two negatives in that troika from ever occuring again. Lance Roberts is a Chief Portfolio Strategistand Chief Editor of the “Real Investment Advice” – Robert Zurrer for Money Talks.
 My…my…how quickly we forget.
Yesterday, as the markets rocketed higher, my email lit up with questions surrounding the discussion from this last weekend’s newsletter.
“I have questioned over the last couple of weeks exactly how much volatility the Fed would allow before stepping into the fray to keep the markets stable.
We now know it is roughly a 10% decline.
Specifically were the comments about QE being ‘useful to have in the toolkit for those times when the short-term interest rate tool may not be available,’ adding that the Fed is ‘quite likely’ to require large-scale asset purchases again because real rates will remain low due to slow productivity and labor-force growth. They also added that ‘if LSAPs are indeed not effective, then the Fed may need to take other measures.’ (Zerohedge has the complete article.)
In other words, despite the rhetoric to the contrary, the Fed isn’t going away…….ever!”
The deluge of emails revolved around much of the same premise.
“If the the Fed isn’t going away, then why would there ever be another bear market?”
It is certainly an interesting question, particularly as the Fed continues to trot out officials to make market supporting statements such as Fed Vice Chairman Quarles who stated on Monday:
“It might seem reasonable to assume that faster growth would lead to firmer inflation. However, I think a lot remains to be seen.”
Or even Mario Draghi, Chairman of the ECB, who said:
“In the presence of an economic situation that is improving constantly, we need the right blend of measures. Uncertainties continue to prevail.”
So, despite economies that are supposedly improving, Central Banks continue into their tenth year of “emergency measures.” As Michael Lebowitz recently stated:
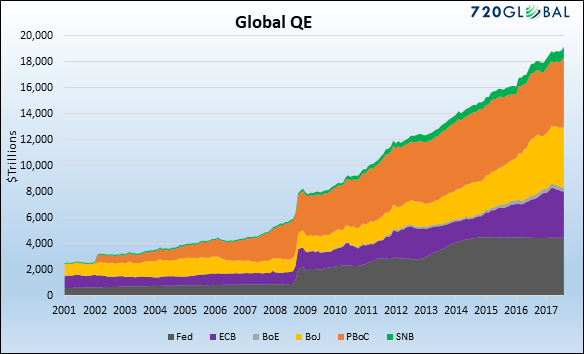
“Global central banks’ post-financial crisis monetary policies have collectively been more aggressive than anything witnessed in modern financial history. Over the last ten years, the six largest central banks have printed unprecedented amounts of money to purchase approximately $14 trillion of financial assets as shown below. Before the financial crisis of 2008, the only central bank printing money of any consequence was the Peoples Bank of China (PBoC).”
With that, I certainly understand the reasoning that if indeed “Central Banks” are now committed to monetary interventions going forward, the financial markets have been effectively “fire-proofed against bear markets.”
But such a belief is extremely dangerous.
It is also the same “belief” every major bubble was built upon throughout history and driven by the same underlying foundations.
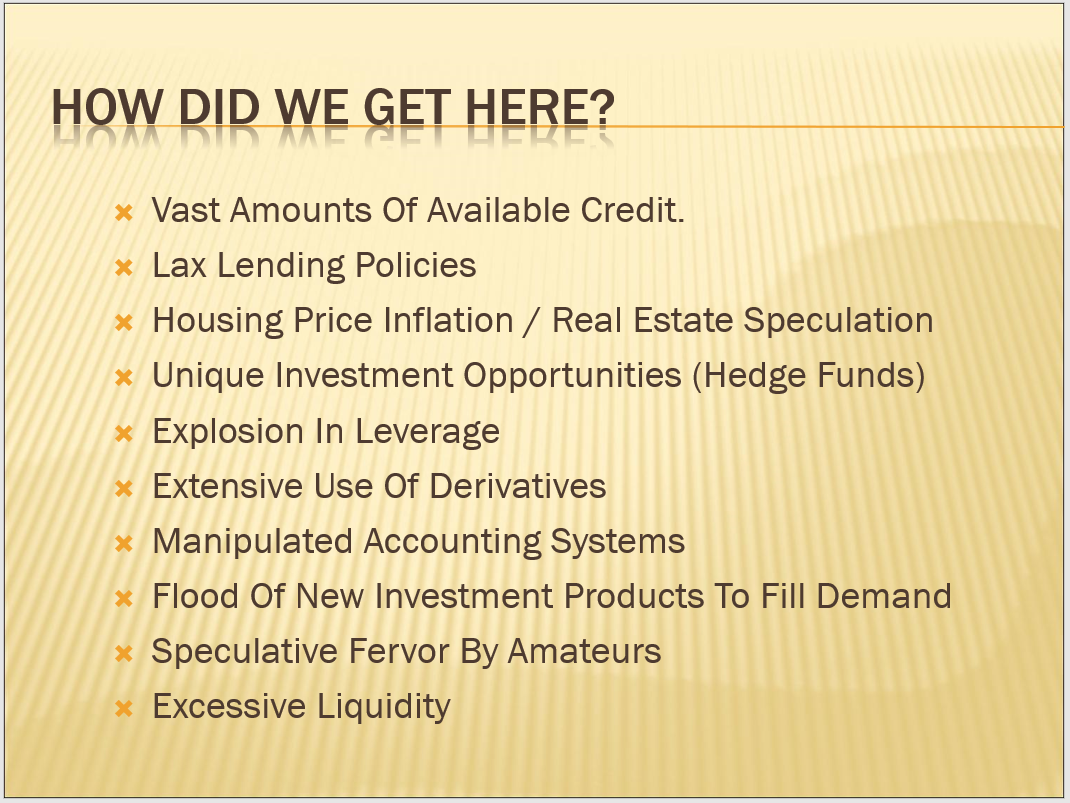
Which created the bubble in “THE” asset class of choice at that time…

Which created the bubble…
Which always ended badly for investors.
Every. Single. Time.
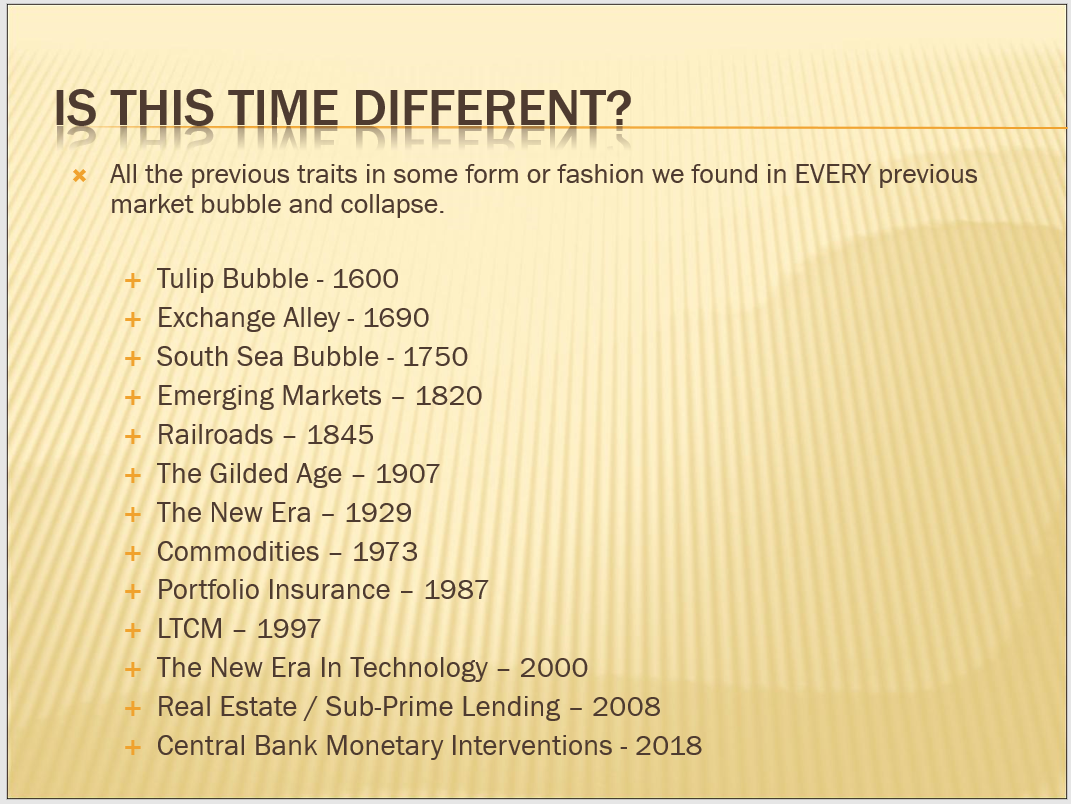
Is “this time different?”
No, and it will end just the same as every previous liquidity driven bubble throughout history.
Of this, there is absolute certainty.
There are only TWO questions that must be answered:
- What will cause it, and;
- When will it happen?
What Will Cause The Next Crash
No one knows for certain what will cause the next financial crisis. However, in my opinion, the most likely culprit will be a credit-related event caused by the Fed’s misguided policy of hiking interest rates,and tightening monetary policy, when the financial system is more heavily levered than at any other point in human history.
The illusion of liquidity has a dangerous side effect. The process of the previous two debt-deleveraging cycles led to rather sharp market reversions as margin calls, and the subsequent unwinding of margin debt fueled a liquidation cycle in financial assets. The resultant loss of the “wealth effect” weighed on consumption pushing the economy into recession which then impacted corporate and household debt leading to defaults, write-offs, and bankruptcies.
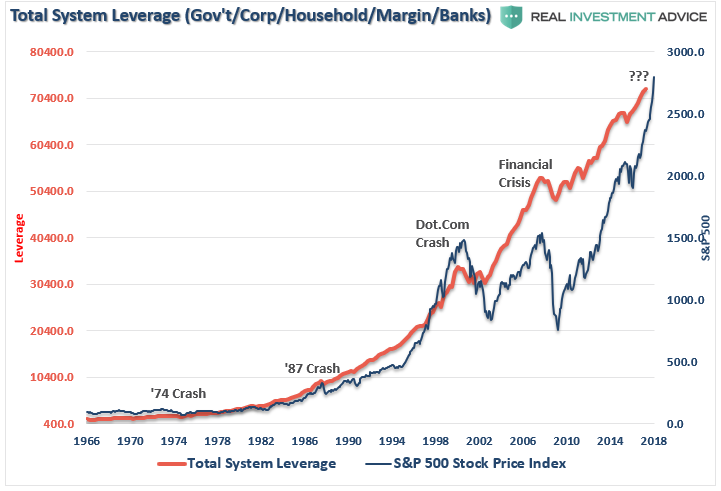
With the push lower in interest rates, the assumed “riskiness” of piling on leverage was removed. However, while the cost of sustaining higher debt levels is lower, the consequences of excess leverage in the system remains the same.
You will notice in the chart above, that even relatively small deleveraging processes had significant negative impacts on the economy and the financial markets. With total system leverage spiking to levels never before witnessed in history, it is quite likely the next event that leads to a reversion in debt will be just as damaging to the financial and economic systems.
Since interest rates affect “payments,” increases in rates negatively impact consumption, housing, and investment which ultimately deters economic growth.
It will ultimately be the level of interest rates which triggers some “credit event” that starts the “next bear market”
It has happened every time in history.
Importantly, as prices decline it will trigger margin calls which will induce more indiscriminate selling. The forced redemption cycle will force investors to dump positions to meet margin calls at a time when the lack of buyers will create a vacuum causing rapid price declines.
When Will It Happen
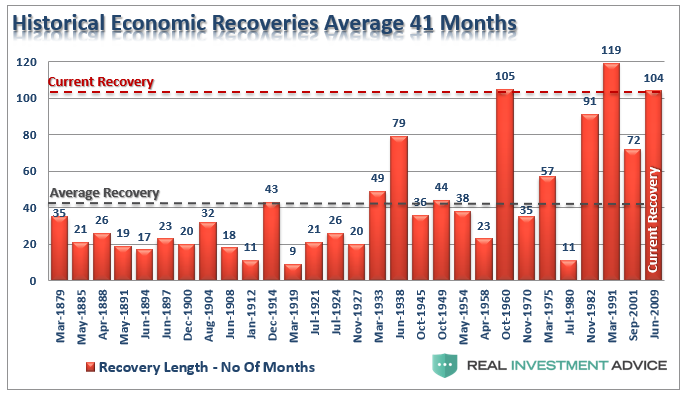
Honestly, no one knows for sure. However, history can give us some guide.
“In the past six decades, the average length of time from the first tightening to the end of the business cycle is 44 months; the median is 35 months; and the lag from the initial rate hike to the end of the bull equity market is 38 months for the average, 40 months for the media.” – David Rosenberg
Averages and medians are great for general analysis but obfuscate the variables of individual cycles. To be sure the last three business cycles (80’s, 90’s and 2000) were extremely long and supported by a massive shift in financial engineering and a credit leveraging cycle. The post-Depression recovery, and WWII, drove the long economic expansion in the 40’s, and the “space race” supported the 60’s.
Currently, employment, economic and wage growth remain weak with 1-in-4 Americans on Government subsidies and the majority living paycheck-to-paycheck. This is why Central Banks, globally, have continued aggressively monetizing debt in order to keep growth from stalling out. With the Fed now hiking rates, and reducing market liquidity, the risk of a policy mistake has risen markedly.
If David is correct, given the Fed began their current rate hiking campaign in December 2015, the next recession would occur 38-months later or February 2019. Such a span would make the current economic expansion the second longest in history based on the weakest economic growth rates.
The chart and table below compares real, inflation-adjusted, GDP to Federal Reserve interest rate levels. The vertical purple bars denote the quarter of the first rate hike to the beginning of the next rate decrease, or onset of a recession.
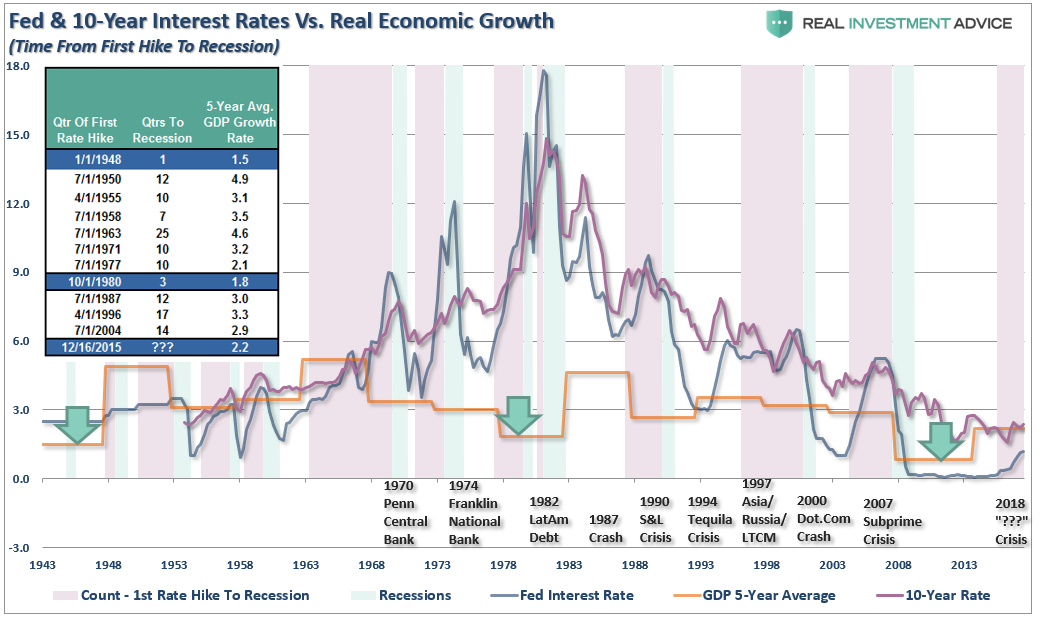
If you look at the underlying data, which dates back to 1943, and calculate both the average and median for the entire span, you find:
- The average number of quarters from the first rate hike to the next recession is 11, or 33 months.
- The average 5-year real economic growth rate was 3.08%
- The median number of quarters from the first rate hike to the next recession is 10, or 30 months.
- The median 5-year real economic growth rate was 3.10%
The importance of this reflects the point made previously, the Federal Reserve lifts interest rates to slow economic growth and quell inflationary pressures. Yet, economic growth and inflation are running well below historical norms and system-wide leverage has surged to new records as individuals and corporations have feasted on debt in a low-rate environment.
That is now changing as the Fed hikes interest rates. Notice in the chart above, that recessions occur when the Fed starts hiking interest rates and the Fed rate approaches the 10-year Treasury rate. In every instance, a recession or “crisis” occurred.
Crisis, Recession & Bear Markets
If historical averages hold, and since major bear markets in equities coincide with recessions, then the current bull market in equities has about one year left to run. While the markets, due to momentum, may ignore the effect of “monetary tightening” in the short-term, the longer-term has been a different story.
As shown in the table below, the bulk of losses in markets are tied to economic recessions. However, there are also other events such as the Crash of 1987, the Asian Contagion, Long-Term Capital Management, and others that led to sharp corrections in the market as well.

The point is that in the short-term the economy, and the markets (due to momentum), can SEEM TO DEFY the laws of gravity as interest rates begin to rise. However, as rates continue to rise they ultimately act as a “brake” on economic activity.
While rising interest rates may not “initially” impact asset prices, it is a far different story to suggest that they won’t. In fact, there have been absolutely ZERO times in history that the Federal Reserve has begun an interest rate hiking campaign that has not eventually led to a negative outcome.
What the majority of analysts fail to address is the “full-cycle” effect from rate hikes. While equities may initially provide a haven from rising interest rates during the first half of the rate cycle, they have been a destructive place to be during the second-half.
It is clear from the analysis that “bad things” have tended to follow the Federal Reserve’s first interest rate increase. While the markets, and economy, may seem to perform okay during the initial phase of the rate hiking campaign, the eventual negative impact will push most individuals to “panic sell” near the next lows. Emotional mistakes are 50% of the cause as to why investors consistently underperform the markets over a 20-year cycle.
The exact “what” and “when” of the next “bear market” is unknown. It has always been some unanticipated event that triggers the “reversion to the mean.”
It will be obvious in “hindsight.”
While the media will loudly protest that “no one could have seen it coming,” there are plenty of clues if you only choose to look.
The Fed has not put an “end” to bear markets.
In fact, they have likely only succeeded in ensuring the next bear market will be larger than the last.
For now, the bullish trend is still in place and should be “consciously” honored. However, while it may seem that nothing can stop the markets rise, or seemingly the Fed will never let it fall, it is crucial to remember that it is “only like this, until it is like that.”
For those “asleep at the wheel,” there will be a heavy price to pay when the taillights turn red.
Lance Roberts

Lance Roberts is a Chief Portfolio Strategist/Economist for Clarity Financial. He is also the host of “The Lance Roberts Show” and Chief Editor of the “Real Investment Advice” website and author of “Real Investment Daily” blog and “Real Investment Report“. Follow Lance on Facebook, Twitter and Linked-In

With Governments desperate for money we can all expect there will be changes in tax collection practices. Even worse, in an An Ominous Prediction Michael made this morning they are coming after all homeowners. Because that’s where the money is. More below: – Robert Zurrer for Money Talks
00:35 – 05:14 – Mike’s Editorial – “You’re innocent until proven guilty’ before the law EXCEPT when it comes to tax collection. There, Revenue Canada says its up to you to prove your innocence. Now the Federal Government is about to hand more power to the already mightly Revenue Canada to enhance their ability to declare more Canadian busiinesses “guilty”.
….also from Michael: The Problem With Protesting Pipelines & Oil

Victor Adair forecasts the near term direction of Stocks, Treasuries, Gold and Currencies including the vital US Dollar. Wrapping up the action of the markets last and telling Michael exactly what posititions he has on now – Robert Zurrer for Money Talks
The DJIA topped out one month ago after a 45%+ rally since Trump’s election. The DJIA moved broadly sideways between 16,000 and 18,000 for most of 2014, 2015 and 2016 and then took off on a 14 month Run for the Roses parabolic burst to 26,618. Following that top the DJIA had a swift 11% correction (top to bottom) and an equally swift bounce back from the lows with the market now slightly above where it was at the beginning of the year.

I think the bounce back from the lows is a dead cat bounce and that we’ll see new lows for two reasons, 1) The 9 year bull market is long in the tooth and the recent parabolic price action looks to have defined a top and 2) the global accommodative
Central Bank policies that underwrote the bull market are reversing.
Risk appetite seems more defensive than aggressive following the correction and I think the “buy any dip” crowd will be trading smaller size and will be using tighter sell stops if they get long. The US Dollar, which had been trending lower since Trump’s election, has caught a bid the past couple of weeks and I think that’s another “risk off” indicator.
My short term trading: I began the week short CAD, gold and WTI. I liquidated CAD and gold for good gains but covered the short WTI at a loss. At the end of the week I’m short Euro (could just as easily have been short gold,) I’ve re-shorted CAD (on the CPI bounce) and I wrote short dated puts on US Treasury bonds.
I’m looking for the US Dollar to rally if/when risk appetite becomes more defensive. Market positioning remains very USD bearish so if it does start to rally it could have a big quick move. Jerome Powell’s “coming out” Congressional testimony this coming Tuesday could spark a USD advance.

The Canadian Dollar has been the weakest of the G10 currencies Vs. USD since risk appetite topped out in late January, but it may be getting some support from higher WTI prices…and it seems to be ignoring the widening USD interest rate premium. However the main “driver” of CAD will be the strength or weakness of the big dollar.
The Euro has had a 20%+ rally against the USD in the last 13 months. Massive Euro bullish speculative positions have been built in the currency futures markets despite the huge widening of the USD interest rate premium. If the market comes to see 1.25 as a top in the Euro it will be tough to sustain long Euro positions with ~3% annual negative carry. A break below 1.22 could ignite selling pressure.
WTI topped out around the end of January and (just like the stock market) had a swift 12% correction…BUT…the bounce back in WTI has been stronger than the stock market bounce. I’ve had a bearish bias on the WTI supply/demand/inventory story but I think I’m currently “missing something” in that analysis so I covered my WTI puts mid-week for a loss and I’m flat. Speculators remain massively long WTI…so if the price does start to break there could be some serious selling pressure from those positions throwing in the towel.
US Treasury Bonds: US interest rates have been steadily rising since the September 8/2017 Key Turn Date with the 10 year nearly touching the 3% yield level this week. Speculators have built a huge bearish position in the futures market. I think the market is oversold so I’ve sold very short dated OTM puts.

Stephen Todd made a significant amount of money in the huge January rally, got out before this February crash, then got back in on Monday February 12th and after a 747 Dow point rally in two days is up nearly 8% for February too. Ranked #1 in 2017 by Timer’s Digest with a 31.6% return in 2017 Steven gives his view on what he expects going forward in this letter – Robert Zurrer for Money Talks
For Monday Feb 26, 2018
Available Mon- Friday after 3:00 P.M. Pacific.
DOW + 399 on 948 net advances
NASDAQ COMP + 84 on 888 net advances
SHORT TERM TREND Bullish
INTERMEDIATE TERM Bullish
STOCKS: A heads up. Tomorrow, new Fed head Jerome Powell is testifying before Congress and there is always the specter of market moving comments.
When the market is up 747 points in two days, there is usually a cliche to accompany it. How about this? “In a bull market, surprises come on the upside”.
There wasn’t much specific news to account for it. For some, the earnings picture continues to be a factor. And indeed, a record 78% of firms have beaten fourth quarter revenue estimates.
GOLD: Gold was up $5. Not a lot of specifics to account for it, but it wasn’t much of a move.
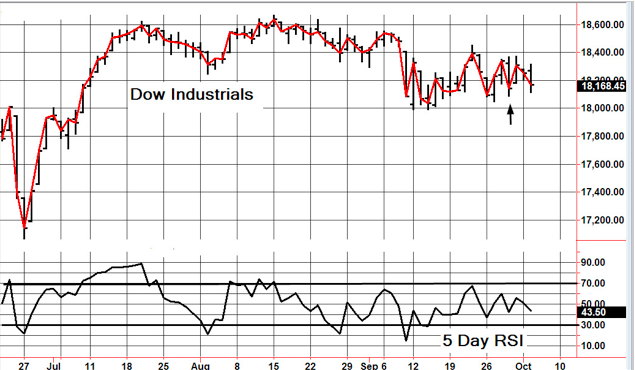
CHART: Five week RSI got very close to an oversold condition. Usually, when it gets this low, the rebound usually lasts much longer than the two weeks that this rebound has lasted. In my view, we are still owed more on the upside, but I wouldn’t be surprised by some near term profit taking.
BOTTOM LINE: (Trading)
Our intermediate term system is on a buy.
System 7 We are long the SSO from 107.03. Move your stop to 115.03.
System 9 We are currently neutral.
NEWS AND FUNDAMENTALS: New home sales came in at 593,000, less than the expected 640,000. On Tuesday we get durable goods, the trade deficit, the Case Shiller Home Price Index and consumer confidence
INTERESTING STUFF: I heard an interesting comment today. A market watcher noted that the recent correction would have once taken six weeks, but now was over in a couple. He likened it to an overall speeding up of society. It once took days to get photos back. Now they’re posted faster than you can blink your eyes. I think that there is something to that.
TORONTO EXCHANGE: Toronto rose 76.
BONDS: Bonds fell back, but I believe that it’s trying to make a bottom.
THE REST: The dollar was quiet again. Crude oil continues to rally.
Bonds –Bearish as of Jan. 9.
U.S. dollar – Bullish as of Feb.20.
Euro — Bearish as of Feb. 20.
Gold —-Bearish as of Feb. 20.
Silver-— Bearish as of Feb. 20.
Crude oil —-Bullish as of Feb. 14.
Toronto Stock Exchange—-Bullish as of Feb. 12.
We are on a long term buy signal for the markets of the U.S., Canada, Britain, Germany and France.

Monetary conditions (+2 means the Fed is actively dropping rates; +1 means a bias toward easing. 0 means neutral, -1 means a bias toward tightening, -2 means actively raising rates). RSI (30 or below is oversold, 80 or above is overbought). McClellan Oscillator ( minus 100 is oversold. Plus 100 is overbought). Composite Gauge (5 or below is negative, 13 or above is positive). Composite Gauge five day m.a. (8.0 or below is overbought. 13.0 or above is oversold). CBOE Put Call Ratio ( .80 or below is a negative. 1.00 or above is a positive). Volatility Index, VIX (low teens bearish, high twenties bullish), VIX % single day change. + 5 or greater bullish. -5 or less, bearish. VIX % change 5 day m.a. +3.0 or above bullish, -3.0 or below, bearish. Advances minus declines three day m.a.( +500 is bearish. – 500 is bullish). Supply Demand 5 day m.a. (.45 or below is a positive. .80 or above is a negative). Trading Index (TRIN) 1.40 or above bullish. No level for bearish.
No guarantees are made. Traders can and do lose money. The publisher may take positions in recommended securities.
 Taking the position that the Stock Market is vunerable to rising bond interest rates Goldman issues a warning below. Martin Armstrong also has an opinion in this recent article Rising Interest Rates & The Coming Banking Crisis. – Robert Zurrer for Money Talks
If the 10-year U.S. Treasury yield hits 4.5 percent by year-end, the economy would probably muddle through — stocks, not so much, according to Goldman Sachs Group Inc.
Goldman’s base-case scenario calls for a 10-year yield of 3.25 percent by the end of 2018, though a “stress test” out to 4.5 percent indicates such a move would cause stocks to tumble, economist Daan Struyven wrote in a note Saturday. He also said the economy would probably suffer a sharp slowdown but not a recession.
“A rise in rates to 4.5 percent by year-end would cause a 20 percent to 25 percent decline in equity prices,” the note said.
While a recent drop in stocks may have been fueled by concerns tied to the 10-year yield approaching 3 percent, many strategists have said they felt equities could continue to rise until reaching 3.5 percent or 4 percent.

-
I know Mike is a very solid investor and respect his opinions very much. So if he says pay attention to this or that - I will.
~ Dale G.
-
I've started managing my own investments so view Michael's site as a one-stop shop from which to get information and perspectives.
~ Dave E.
-
Michael offers easy reading, honest, common sense information that anyone can use in a practical manner.
~ der_al.
-
A sane voice in a scrambled investment world.
~ Ed R.
Inside Edge Pro Contributors

Greg Weldon

Josef Schachter

Tyler Bollhorn

Ryan Irvine

Paul Beattie

Martin Straith

Patrick Ceresna

Mark Leibovit

James Thorne

Victor Adair