
Bonds & Interest Rates
Dead right on rising Bond interest rates have been Bob Hoye & Ross Clark of Institutional Advisors. From their alert at July 2016 yields have risen from 1.8 to yesterday’s close of 2.91%, a big move as you can see below. But that’s not all. Read this report for what is expected after the overbought situation cools down – Robert Zurrer for Money Talks

Red Alert: 10-Year Yields Move into Overbought Territory
The rise in Treasury Bond yields that started following our signal in July 2016 has come in two waves. The first produced overbought readings into December 2016 and was followed by a drift lower through September. Since then they have moved higher, gaining momentum in the last five weeks as 10-Year yields reached 2.8%. This has produced overbought Exhaustion Alerts and Sequential 9 Sell Setups in the daily and weekly charts. Such ‘Signs of Strength’ coming out of a consolidation pattern are generally confirmation of a breakout. If minor corrections of one to four weeks hold above the breakout and the January low, we can look forward to sustained movement to the upside.
Click Image for Larger Version

The monthly data has an RSI(14) of 67. This matches the highs dating back to 1981. In the declining interest rate environment of the last three decades rates have peaked seven times with an RSI between 60 and 67. Note that the first month with a lower low in the yield became the catalyst for the next sustained move down.
However, in the two decades leading up to 1981 the strong momentum consistently pushed the RSI above 67. It reached 90 in 1966, 81 in 1969, 71 in 1974 and 82 in 1980. Minor corrections were followed by higher yields. The four important highs in yields did not occur until a bearish divergence was formed.
We’ll monitor the current move with a close eye on progressively higher lows in the monthly chart.
Click Image for Larger Version

The long bond price (inverse to yields) has now broken the bottom of the rising channel drawn from 1984. (We account for the anomaly in prices since February 27, 2015.)
December 2016 experienced three weekly Capitulation Alerts as prices tested the 100-month moving average. Note that the three previous Capitulation Alerts (1986, 1999 & 2006) saw prices retest the 100-month moving average six to thirteen months later, just as we experienced in October through December. January then staged a clear violation to the downside. Each close below the moving average since 1986 has resulted in an upside reversal in the following month.
A failure to turn higher by the end of February will be a complete change of the long-term character and imply that the major uptrend in interest rates is occurring.
Click Chart for Larger Version

Opinions in this report are solely those of the author. The information herein was obtained from various sources; however, we do not guarantee its accuracy or completeness. This research report is prepared for general circulation and is circulated for general information only. It does not have regard to the specific investment objectives, financial situation, and the needs regarding the appropriateness of investing in any securities or investment strategies discussed or recommended in this report and should understand that statements regarding future prospects may not be realized.
Investors should note that income from such securities, if any, may fluctuate and that each security’s price or value may rise or fall. Accordingly, investors may receive back less than originally invested. Past performance is not necessarily a guide to future performance. Neither the information nor any opinion expressed constitutes an offer to buy or sell any securities or options or futures contracts. Foreign currency rates of exchange may adversely affect the value, price or income of any security or related investment mentioned in this report. In addition, investors in securities such as ADRs, whose values are influenced by the currency of the underlying security, effectively assume currency risk. Moreover, from time to time, members of the Institutional Advisors team may be long or short positions discussed in our publications.
BOB HOYE,
INSTITUTIONAL ADVISORS
EMAIL bhoye.institutionaladvisors@telus.net
WEBSITE www.institutionaladvisors.com

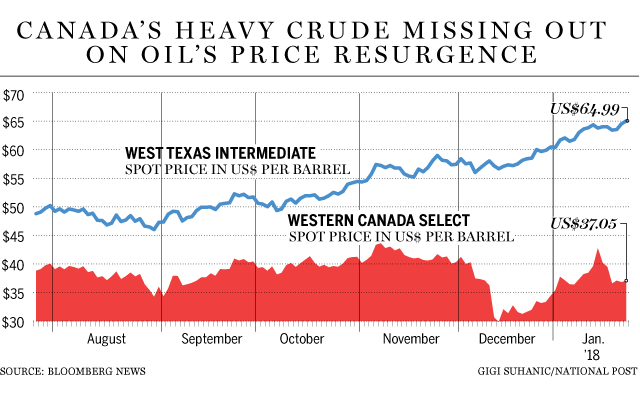
While the east coast of Canada imports 700,000 Barrels a day of World Prices, the rest of Canada sells 2/3 of its production of oil at prices that are $25 to $30 a barrel less than world prices. Natural gas sells at 60% of the World Price. Reasons why…
….also from Michael: Why Won’t Canadians Scream ENOUGH!

 Must read: A report from someone who shorted this market and covered it right on the bottom February 9th. That is one hell of a trade.
Not only that but Peter Grandich has been correct being short the bonds and recently stated that he is as bullish as he has been in 34 years on Gold – Robert Zurrer
A Brief Look At The Markets by Peter Grandich
Stock Market – I had noted in my February 10th observation, that I had covered my short position on the morning of the 9th. I stated, “A significant reason for taking profits in my short positions was the personal technical work that I do, suggested the short-term selling was exhausted. Sure enough, the DJIA rallied 700 points from when I covered. I believe we can see the market rally back hard next week, as the first sell-offs in Parabolic Arc formations are almost always assumed to be buying opportunities.”
As I make this blog post, morning stock index futures indicate another 300 point rise to the already-huge rally since covering my shorts. I believe this qualifies as “rallying back hard”. The question is, was the previous sell-off just a blip or a true warning shot? If a picture is worth a thousand words, this photo should explain my answer:
- Bonds – While the stock market thinks it was just a momentary blip, the bond market has clearly viewed a major sea change and is acting accordingly. The POTUS has “joined the swamp” in insanely out-of-control spending and debt crisis, that just may make the can unable to be kicked down the road anymore. The warning shot will become this, if the 10-year T-Bond gets above (and stays) 3%

Dollar – Any questions?
%20100vw,%20300px">)
- I stated in my February 14th interview with Goldseek.com that, during my 34-year career in and around the financial arena, I never been more confident in a gold rally. I continue to point out how gold has been tracing-out a series of higher lows since early 2017, while the “Battle of The Bulge” resistance line for the bears remains the $1, 375 – $1,400 area. Now with any resemblance of fiscal responsibility being tossed aside by the POTUS, at a time when other bullish factors to own gold just keep increasing, I believe its “when” we get above (and stay there) $1,400, not if.
http://petergrandich.com/blog/

A reader asked me about ‘Bond Vigilantes’ after reading this article: ‘Bond Vigilantes’ are Saddled Up and Ready to Push Rates Higher.
- There’s reason to be concerned about bond vigilantes, who are no longer under “lock and key” and are free to push yields higher, Ed Yardeni told CNBC.
- Yardeni coined the term “bond vigilantes” in the 1980s to refer to investors who sell their holdings in an effort to enforce fiscal discipline.
- People are looking more at the domestic situation and saying, ‘You know what, maybe we need a higher bond yield,'” Yardeni says.
This is complete silliness. There are no “Bond Vigilantes”.
Fundamentally, there is no way to dump holdings to enforce “fiscal discipline” because someone has to hold every bond issued until it comes to term.
However, there is a record speculative building up against bonds in the futures market.
Hedge Funds Push Record Bets Shorting Treasuries
Bloomberg reports Hedge Funds’ Biggest Short in Bonds Faces Make-or-Break Moment.
Hedge funds and other large speculators are more convinced than ever that the 2018 bond-market rout will resume in the days ahead.
The group, known for trading on momentum, boosted short bets in 10-year Treasury futures to a record 939,351 contracts, according to Commodity Futures Trading Commission data through Feb. 6. That means the violent market moves on Feb. 5, when the Dow Jones Industrial Average suffered an unprecedented drop and 10-year yields fell almost 14 basis points, weren’t enough to dissuade wagers that rates are headed higher. The next gut-check comes Wednesday, with the latest read on consumer prices.
Speculators’ positioning matters because it can push momentum to extremes, and can serve as a contrarian indicator since these traders are among the quickest to switch directions when prices turn against them. By contrast, longer-term holders like asset managers are seen as more likely to stay the course. Their net long in 10-year futures is the highest since October 2015.
30-Year Long Bond Positioning

The chart from COTbase is not to scale. Moreover, the bars represent the price of the bond, not the yield on a 30-year bond.
However, we can see, that when it comes to shorting 30-year treasuries, small speculators display terrible timing. They are positioned for another beating if the yield on 30-year treasures declines.
10-Year Note Positioning

Small speculators have been short the 10-year note since the beginning of last year. They are now almost as net short as the big speculators. Bloomberg cites a record short position. Bloomberg may be counting options.
The top half of the chart is from CotPriceCharts. Those small and large spec bars are to scale. I overlaid a chart of yield for the same time frame.
There is also free COT data at FreeCOTData but it does not separate out small from big specs.
COT Data Releases
Generally, the data in the COT Reports is from Tuesday and released Friday. The CFTC receives the data from the reporting firms on Wednesday morning and then corrects and verifies the data for release by Friday afternoon.These reports have a futures only report and a combined futures and options report.
The charting services take the data and produce charts, some of them free.
A key point to remember is you are always looking at stale data. In volatile weeks positions can change rapidly. The data released on February 9, for February 2, is very suspect. We get a new report on February 16.
Another VIX-Like Opportunity
Speculators have been adding leverage, getting shorter and shorter as yields increase. This is a recipe for disaster at turns.
Let’s not confuse increasing speculation with ‘bond vigilante’ myth.
The widespread beliefs that the Trump tax cuts will fuel investment and inflation will rise because of wages are both half-baked at best. For now, as long as traders are on the right side of things, it doesn’t really matter why.
One reason yields have been rising is the opposite of what people think. For discussion, please see Trapped Funds Myth: Foreign Cash Repatriation Boom in Reverse.
By Mike “Mish” Shedlock
Last week, everyone focused on the stock market sell-off. Reasonably enough, given the pace of the declines. But the analysts failed to pay enough attention to the very important shift. That change may be more important than Trump’s victory in the presidential election. Will the critical switch make gold shine – or dull?
Three Important Legacies of Yellen’s Fed Tenure
A crucial change is behind us. Powell is the new boss. Yellen is out. For better or worse, she doesn’t serve as the Fed Chair any longer. Although economists rated Yellen’s tenure very highly, President Trump didn’t renominate her for the position. Rightly or not? We don’t care. Let journalists debate endlessly – we will analyze the crucial Yellen’s imprints on the Fed, which could affect the gold market in the future.
First, Yellen focused mostly on the labor market, not without some successes. We don’t attribute it solely to her, but the unemployment rate fell from 6.7 to 4.1 percent under her tenure. As a reminder, the Fed has a dual mandate: maximum employment and stable prices. Although many Fed officials used to worry about high inflation, she was different. Yellen didn’t fear the uptick in inflation as long as there was a slack in the labor market. She, thus, believed that ultra low interest rates could and should stay near zero for far longer than previously thought to combat unemployment. Yellen hiked them not earlier than in December 2015. Since then, she gradually raised them to the range of 1.25 percent to 1.5 percent, which is still very low. The gradual tightening was positive for gold, which would have likely struggled more, had monetary policy been more aggressive. If Jerome Powell continues this cautious policy, gold may shine, despite rising interest rates.
Second, Yellen managed to start the unwinding of the Fed’s massive balance sheet, without triggering stock market turmoil. After unconventional actions of Bernanke, she had to get back to normal monetary policy, but not too fast. She definitely succeeded. If anything, the Fed is behind the curve. This is why gold wasn’t strongly hit by the Fed’s tightening. The U.S. central bank raised interest rates a few times, but the financial conditions remained easy.
Third, Yellen mastered communication with the public. She held quarterly news conferences and smoothly telegraphed the Fed’s moves well in advance. Thanks to well-planned expectations guidance, Yellen – contrary to Bernanke who triggered a taper tantrum by his unexpected remarks in 2013 – avoided any major stumbles. The clear communication transformed gold’s reaction function. The yellow metal now reacts more to the changes in the rate hike expectations than to real monetary policy decisions. Sell the rumor, buy the fact – as one can see in the chart below.

Chart 1: Gold prices under Yellen’s Fed tenure
Jerome Powell – Great Continuator or Game Changer?
Jerome Powell is now the new Fed Chair. Analysts expect that he will continue Yellen’s stance. But will he? How you play depends on your opponent. Yellen faced a sluggish recovery. But Powell sees tax cuts, higher economic growth, very low unemployment and perhaps finally rising wages. He will have to deal with the accelerating inflation, so Powell could move faster on normalization. Actually, such a scenario scared some investors last week into deciding to sell their equities. As people weren’t sure what to expect of Powell, good economic data turned out once again to be bad news for the financial markets. Surprisingly strong payrolls make traders to worry that the Fed will tighten its stance more. Hence, unless Powell convinces the markets that he will continue Yellen’s gradual approach, gold may react paradoxically for a safe-haven: decline on bad news and rise on good news.
But will he intervene to calm the financial markets? We don’t bet on that. Greenspan cut interest rates after the stock market declined 35 percent in the three months after he became the Fed Chair, but the current downturn is much smaller. Actually, we have seen some rebound since Friday. Another paradox: the correction in stock prices may help Powell in doing his job, because lower equity prices could relieve concerns about the formation of dangerous asset bubbles.
Conclusions
The conclusion is clear: although the latest declines were a tough welcome for Powell, they may actually be helpful for him. He is expected to continue Yellen’s policy. It is generally true, but economic conditions changed as well as the composition of the FOMC in 2018. It is now more hawkish than last year.
Given these developments, the shift from Yellen to Powell may importantly strengthen the hawks among the Fed. Hence, unless the correction evolves into turmoil, we still expect three (or even four) hikes this year. Indeed, according to CME data, the Fed remains on track to lift the federal funds rate in March. The market odds of a hike are above 75 percent. Higher interest rates should theoretically be negative for gold. But the usual link seems to be broken now. The part of the answer is the U.S. dollar. Another issue is that we are in the late stages of the economic cycle – as the cycle matures, volatility increases and investors start to buy more gold as a hedge.
By Arkadiusz Sieron

-
I know Mike is a very solid investor and respect his opinions very much. So if he says pay attention to this or that - I will.
~ Dale G.
-
I've started managing my own investments so view Michael's site as a one-stop shop from which to get information and perspectives.
~ Dave E.
-
Michael offers easy reading, honest, common sense information that anyone can use in a practical manner.
~ der_al.
-
A sane voice in a scrambled investment world.
~ Ed R.
Inside Edge Pro Contributors

Greg Weldon

Josef Schachter

Tyler Bollhorn

Ryan Irvine

Paul Beattie

Martin Straith

Patrick Ceresna

Mark Leibovit

James Thorne

Victor Adair