
Gold & Precious Metals

02:50 – 19:24 Featured Guest: A word to the wise – big name analyst, Greg Weldon issues a major warning for investors. Hint: the game’s changed.
….also from Michael: Dr. Michael Berry Ph.D: Prepare Yourself For Higher Rates


Critics of “New Age” monetary policy have been predicting that central banks would eventually run out of ways to trick people into borrowing money. There are at least three reasons to wonder if that time has finally come:
Wage inflation is accelerating
Normally, towards the end of a cycle companies have trouble finding enough workers to keep up with their rising sales. So they start paying new hires more generously. This ignites “wage inflation,” which is one of the signals central banks use to decide when to start raising interest rates. The following chart shows a big jump in wages in the second half of 2017. And that’s before all those $1,000 bonuses that companies have lately been handing out in response to lower corporate taxes. So it’s a safe bet that wage inflation will accelerate during the first half of 2018.

The conclusion: It’s time for higher interest rates.
The financial markets are flaking out The past week was one for the record books, as bonds (both junk and sovereign) and stocks tanked pretty much everywhere while exotic volatility-based funds imploded. It was bad in the US but worse in Asia, where major Chinese markets fell by nearly 10% — an absolutely epic decline for a single week.

Normally (i.e., since the 1990s) this kind of sharp market break would lead the world’s central banks to cut interest rates and buy financial assets with newly-created currency. Why? Because after engineering the greatest debt binge in human history, the monetary authorities suspect that even a garden-variety 20% drop in equity prices might destabilize the whole system, and so can’t allow that to happen.
The conclusion: Central banks have to cut rates and ramp up asset purchases, and quickly, before things spin out of control.
So – as their critics predicted – central banks are in a box of their own making. If they don’t raise rates inflation will start to run wild, but if they don’t cut rates the financial markets might collapse, threatening the world as we know it.
There’s not enough ammo in any event
Another reason why central banks raise rates is to gain the ability to turn around and cut rates to counter the next downturn.
But in this cycle central banks were so traumatized by the near-death experience of the Great Recession that they hesitated to raise rates even as the recovery stretched into its eighth year and inflation started to revive. The Fed, in fact, is among the small handful of central banks that have raised rates at all. And as the next chart illustrates, it’s only done a little. Note that in the previous two cycles, the Fed Funds rate rose to more than 5%, giving the Fed the ability to cut rates aggressively to stimulate new borrowing. But – if the recent stock and bond market turmoil signals an end to this cycle – today’s Fed can only cut a couple of percentage points before hitting zero, which won’t make much of a dent in the angst that normally dominates the markets’ psyche in downturns.
Most other central banks, meanwhile, are still at or below zero. In a global downturn they’ll have to go sharply negative.
 \
\
So here’s a scenario for the next few years: Central banks focus on the “real” economy of wages and raw material prices and (soaring) government deficits for a little while longer and either maintain current rates or raise them slightly. This reassures no one, bond yields continue to rise, stock markets grow increasingly volatile, and something – another week like the last one, for instance – happens to force central banks to choose a side.
They of course choose to let inflation run in order to prevent a stock market crash. They cut rates into negative territory around the world and restart or ramp up QE programs.
And it occurs to everyone all at once that negative-yielding paper is a terrible deal compared to real assets that generate positive cash flow (like resource stocks and a handful of other favored sectors like defense) – or sound forms of money like gold and silver that can’t be inflated away.
The private sector sells its bonds to the only entities willing to buy them – central banks – forcing the latter to create a tsunami of new currency, which sends fiat currencies on a one-way ride towards their intrinsic value. Gold and silver (and maybe bitcoin) soar as everyone falls in sudden love with safe havens.
And the experiment ends, as it always had to, in chaos.
It was a rough week for investors in stocks and stocks of all kinds. The S&P 500 lost 5%. Emerging Markets also lost 5%. Gold Stocks, which had weakened before the broader equity market have been hit hard. They (GDX, GDXJ) also lost 5% last week. The HUI Gold Bugs Index (which excludes royalty companies unlike GDX) lost 7%. After a strong start to the year, gold stocks have essentially given back all their gains. Nevertheless, we remain extremely optimistic on gold stocks over the next 12-18 months as trends in the economy and stock market should begin to support Gold after the second quarter.
Historically speaking some of the best performance in Gold and gold stocks occurred during or after a bear market in stocks. The best examples can be found in the 1970s and 2000s as the charts show. Gold surged after the bottom in stocks in 1970 and continued to perform very well during the 1973-1974 bear market. After a brief but sharp bear in 1975-1976 Gold rebounded strongly as the S&P 500 began a mild bear market in 1977. Years later Gold emerged from a significant bottom in 2001 while the stock market endured its worst bear market in a quarter century. Gold continued to perform even after the market bottom in late 2002. Gold emerged from the global financial crisis before the stock market but continued to make new highs after the stock market bottomed in March 2009.
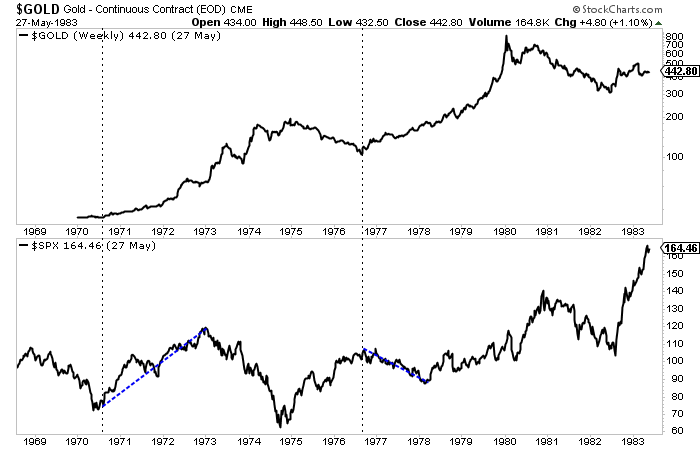
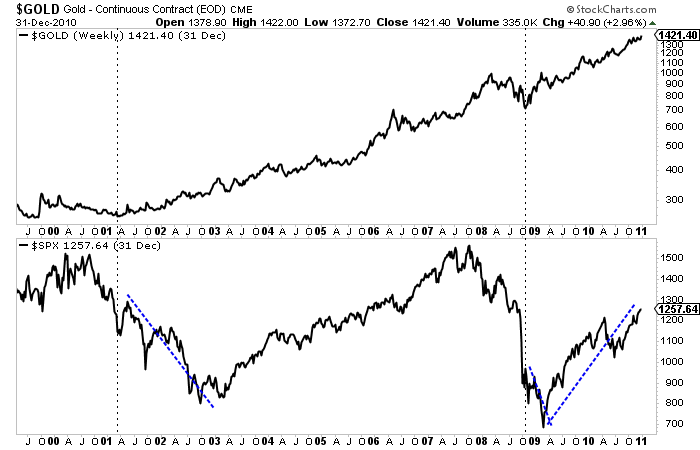
This performance is not just random. It makes quite a bit of fundamental sense. As we know, Gold is driven by falling or negative real rates. Typically policy makers in response to a recession or bear market will pursue policies that lead to falling or negative real rates. These policies are not reversed until the economy gains strength. Gold can also benefit from inflationary recessions, which we saw in the 1970s. Perhaps we are headed for that outcome at somepoint but I digress.
The best comparison to today may be the mid 1960s. Although the Gold price was fixed until 1971, we can use gold stocks to study the macro picture of the 1960s and how it may relate to today.
Gold stocks and the stock market were positively correlated during the 1960s but gold stocks dramatically outperformed and especially from 1964 to 1968. That outperformance accelerated after 1963 as inflation and bond yields began to rise to higher and higher levels in the years ahead. That would soon negatively impact the stock market in both nominal and real terms. The Dow peaked in 1966 while the S&P 500 did not peak until 1973 (as it made marginal new highs in 1969 and 1973). In real terms stocks would peak in 1966 or 1968 (depending on which index you use).

Economic fundamentals appear to be headed in a direction that is bullish for Gold and gold stocks and less positive for the stock market. While inflation has yet to be unleashed, the markets are showing that inflationary pressures are forming. This will impact corporate margins (which are extremely high) as well as profits. Higher inflation also leads to higher bond yields which means higher costs to service debt. That is a problem for the economy and equity market due to the debts that have piled up in recent years.
So the question now is where is the threshold for when inflation and bond yields start affecting the economy and stock market in a way that is favorable for precious metals?
With respect to the 1960s and 1970s, the answer would be 1964.
When precious metals begin and sustain outperformance against the stock market it will signal that the threshold or inflection point has been reached. That outperformance will also go a long way in helping Gold make its major breakout.
It is not yet time for Gold and gold stocks to shine but it is getting very close. Gold remains in a bullish consolidation pattern that should give way to a breakout later in the year. Meanwhile, gold stocks and Silver are lagging badly but that does not have us concerned. The next few months could prove to be the best buying opportunity in precious metals since the end of 2015. Quality juniors that are bought on weakness over the medium term should deliver fantastic returns over the ensuing 12 to 18 months.
Let’s not go into great detail about sentiment and internals indicators trying to ascertain something already fully in play. The stock market has finally cracked, making an A-B-C correction in micro time per a 30 minute chart. Sentiment is in play from the negative side, volatility is now intense and while we will gauge the macro regularly going forward, we also are in the realm of straight TA. So #486 is going to be a breeze for us this weekend as we get down mainly to more TA and less theory across various markets.

Table of Contents

Wrap Up (a basic summary based on conclusions from work done in this week’s report)
-
US Stock Market: So we had anticipated a bottom and a bounce. Last week the US market bottomed, bounced, dropped, bottomed and bounced again. SPX reversed on Friday from a logical point and this could get over bearish participants thinking “rut roh, why did I puke?” and starting to chase. I think this is the type of market where you buy a logical low and hope that a rally ensues or else don’t blindly chase the reactions.
-
There could well be another shoe to drop after a bounce plays out. Let’s watch sentiment and macro indicators to gauge the proceedings.
-
Market Internals: The few divergences we had, like those noted in the Semi sector manifested in a hum dinger of a correction. Now the market is finally in motion with herds running every which way. You can’t ask for better if you are like me. A market in a robo trend or melting up day after day is not fun. A market that is running on emotion and becoming volatile in both directions… is. When things smooth out we’ll again gauge internals.
-
3 Amigos: Stocks vs. Gold got whacked from a point lower than the ultimate target allowed for by the monthly chart. Let’s keep open minds both ways here and go week to week. 10yr yields are essentially at target and 30yr dwells below target, all with Gross & Dalio plastered across the media as poster boyz of the new bond bear (that isn’t quite yet). The yield curve unsurprisingly steepened with the market disturbance but remains in a long-term flattening trend.
-
Amigos bottom line: no confirmations of trend changes yet.
-
Global Stock Markets: In some cases egregiously overbought and correcting, like
the US. Also subject to bounce potentials like the US.
-
Commodities: USD-centric ‘Inflation trade’ still alive because USD is still bearish on its larger trends, despite bounce.
-
Precious Metals: Sector’s best ‘epic buy’ (ala Q4 2008) would be if the ‘inflation trade’ ends in global liquidation and the sector gets wiped out. But if stock markets are taking the 1st of more hits to come, this would be very supportive and if gold at least holds its own vs. commodities and silver leads gold, so much the better. Constructive here even if an inflationary phase grinds along.
-
Currencies: USD bearish but bouncing.
-
Sentiment: Sentiment got cleaned very well last week, to the point where a solid bounce across asset markets is not only possible, but likely. Friday’s reversal may have been the start. Let’s see how the pig comes out of the gate early this week.
US Stock Market
SPX and its fellows made an A-B-C correction (i.e. short-term down-up-down whipsaw) in micro time last week. The SMA 200, per the SPX chart is generally the line in the sand that sparked Friday’s bullish reversal. SPX has 2 significant gaps, one as noted above in the mid-2800s and the other as noted in an update in the mid-2400s.
Double Click For Larger Image


-
I know Mike is a very solid investor and respect his opinions very much. So if he says pay attention to this or that - I will.
~ Dale G.
-
I've started managing my own investments so view Michael's site as a one-stop shop from which to get information and perspectives.
~ Dave E.
-
Michael offers easy reading, honest, common sense information that anyone can use in a practical manner.
~ der_al.
-
A sane voice in a scrambled investment world.
~ Ed R.
Inside Edge Pro Contributors

Greg Weldon

Josef Schachter

Tyler Bollhorn

Ryan Irvine

Paul Beattie

Martin Straith

Patrick Ceresna

Mark Leibovit

James Thorne

Victor Adair