
Stocks & Equities
What goes up, must come down. And it was finally the stock market’s turn to take some profits aside. Friday’s 2.13% decline in the S&P 500 was the bookend to a week’s drop of 3.86% – all while the majority of companies this week produced positive earnings and sales surprises. The correction this week served as a bearish engulfing pattern on the weekly chart, a reversal pattern of some renown.

No news event, no central bank catalyst, and no bubble bursting caused investors to sell this week. Merely, selling begot selling. Post the election in 2016, we haven’t had a 3% drawdown in the S&P 500. Looking at the counter, it has been essentially 311 trading days from the last 3% drawdown. So reversion to the mean is the name of the game.
The news this week could have fueled the advance further but it did not. Of the 251 companies that have reported their fourth quarter 2017 earnings, 80% have beaten sales estimates and 75% have beat on earnings estimates. The number of companies reporting sales surprises is record-setting with the 5-year average at 56%. The materials sector has had the largest upside surprise from estimates, at around 11%, while energy has had the largest downside difference between actual and estimated earnings, at -12%. The last report I read from FACTSET showed the earnings growth rate for Q4 stands at 13.4%, up from the estimated rate of 11% on Dec 31. Analysts are projecting S&P 500 earnings growth of 16.8% for the full 2018 year; that’s up from 12% at the beginning of the year as more companies have increased their guidance as a result of the reduction in corporate taxes.
So earnings are strong to very strong just as Seth Davis described his portfolio in the movie Boiler Room (2000): “Investors are selling stocks because earnings were better than expected.” Would make zero sense this week but that’s essentially what happened. Stock valuations are high, and it was time that a pause takes place in an otherwise uninterrupted advance in stocks.
The US stock market is mean reverting. The trend accelerated higher in January and the release valve was needed. It’s here now. With the kind of momentum we’ve seen, it’s very difficult to say that the bullish trend from November 2016 can end this immediately. A bearish reversal is formed when the bulls fail to rally prices to a higher high in the month to come. Calling a top here would be premature. In the article, Records Were Made to Be Broken, Chris Puplava showed in a study he did that the average returns for the S&P 500 from 1928 to today after the weekly relative strength indicator hit 80 were 4.23%, 8.46%, and 13.63% looking at forward returns 3, 6, and 12-months after the event. Momentum like we’ve had, without the parabolic move, usually paints a positive outlook for returns in the near future. So as we revert, don’t hit the red alert.
That said, certain stocks are trading in parabolic moves, many standard deviations away from their 200-day moving average. In such cases, it would be hard-pressed to say such moves could be prolonged so take precautions to set stop losses. Setting stop losses is just good unemotional risk management. As Steve Nison, a valued technician who formalized Japanese Candlesticks in the US through his books says, “all long-term trends begin as short-term moves”. The crystal ball is cloudy. Though the economy is strong, and Treasury yields have been rising on those terms, nobody knows at which point the top will show up.
For more information about Financial Sense® Wealth Management, our investment models, or investment services, click here to visit our website.

Solar Minimum Continues
January’s Sunspot count came in at 6.7, which was down from December’s 8.2. The following chart includes the latest post and covers Solar Cycle 24.
The high was 145 in February 2014, which compares to the high of 238 in September 2003.
With the decline in solar activity, the number of Spotless days continues to grow. It’s the way it works. So far, this year there has been 17 days, or 52% for the year. In all of 2017, the number was 104 days or 28% and the year before it was 32 days or 9%. For 2015 the count was zero, as it essentially was back to 2010.
On the weather front (pun not intended), there has been a brief warming in the El Nino region, which shows in the next chart.

The main thing is that on the longer-term, the El Nino and its warming influence is waning.

Cosmic Stuff
As solar activity diminishes the Earth’s magnetic field also diminishes. This lets more cosmic rays through, which prompts more clouds. This not only increases the probability of precipitation. By reflecting more of the sun’s energy to outer space it forces cooling.
This influence is beyond weather, it is climate and it is changing. The current part of the decline has yet to bring the average temperatures down. It will.
The chart below shows the steady rise in cosmic radiation as the sun’s activity declined. It begins in 2015 and the feature is the decrease in cosmic radiation with a strong, but brief solar outburst. So the concept works on the nearer-term.
The theory about cosmic ray influences is gaining widespread acceptance.

The next chart is from the Danish Met and it shows the brief surge in the mean temperature. The current number is not down to the mean for this week. Thank heaven for small mercies. However, the restoration of the mean is now probable.
Danish Met: Arctic Mean Temp

Source: Ice Age Today
Unusual Weather Reports
From the Northern Hemisphere:
“First Snow in 50 Years Paralyses Southern Morocco” – January 30.
Then from the Southern Hemisphere:
“Summer Blizzard in Tasmania” – January 31.
Wherever it occurs snow needs clouds and cool.
Northern Hemisphere Snow Content

Part of the season was at the high-side of normal. Lately it is in the middle of normal.
This, of course, depends upon cold and precipitation. The following link to the Great Lakes Ice Cover shows a material increase for this season.
Readers are invited to contemplate the establishment’s insistence that expanding ice and snow cover is caused by Global Warming.
Have a Happy Groundhog Day.
Great Lakes Ice

Global Temps: Satellite

Source: Dr. Roy Spencer
• Highlights Are the El Ninos of 1998 and 2016

Link to January 26, 2018 Bob Hoye interview on TalkDigitalNetwork.com: https://www.howestreet.com/2018/01/26/equity-markets-have-taken-on-a-life-of-their-own/
Listen to the Bob Hoye Podcast every Friday afternoon at TalkDigitalNetwork.com
 Monday’s monster stock selloff is exhibit A for why I frequently recommend a 10 percent weighting in gold, with 5 percent in bullion and jewelry, the other 5 percent in high-quality gold stocks, mutual funds and ETFs.
What began on Friday after the positive wage growth report extended into Monday, with all major averages dipping into negative territory for the year. The Dow Jones Industrial Average saw its steepest intraday point drop in history, losing nearly 1,600 points at its low, while the CBOE Volatility Index, widely known as the “fear index,” spiked almost 100 percent to hit its highest point ever recorded.
Gold bullion and a number of gold stocks, however, did precisely as expected, holding up well against the rout and helping savvy investors ward off even more catastrophic losses. Klondex Mines and Harmony Gold Mining, among our favorite small-cap names in the space, ended the day up 4.6 percent and 4.8 percent, respectively. Royalty company Sandstorm Gold added 1.4 percent.
The research backs up my 10 percent weighting recommendation. The following chart, courtesy of BCA Research, shows that gold has historically outperformed other assets in times of geopolitical crisis and recession. Granted, the selloff was not triggered specifically by geopolitics or recessionary fears, but it’s an effective reminder of the low to negative correlation between gold and other assets such as equities, cash and Treasuries.
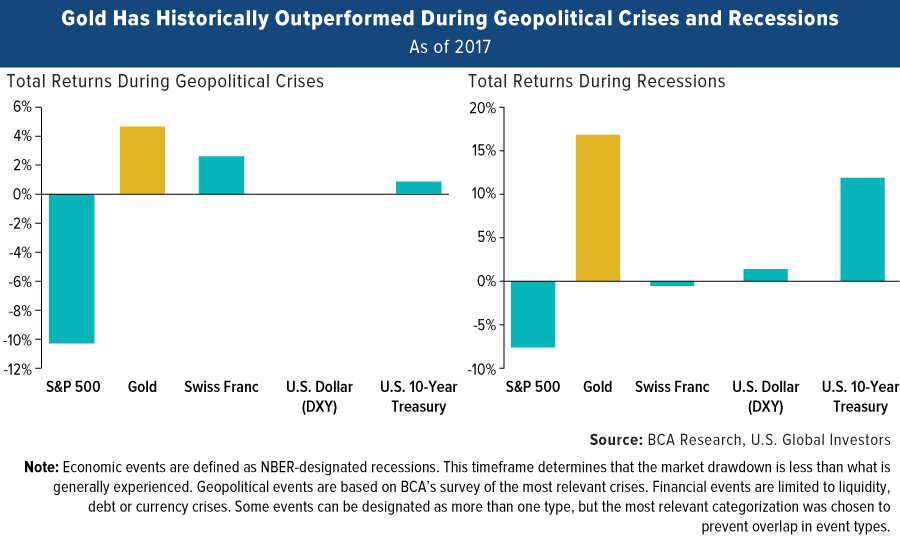
“We expect gold will provide a good hedge against a likely equity downturn, as the bull market turns into a bear market” in the second half of 2019, BCA analysts write in their February 1 report.
The reemergence of volatility and fear raises the question of whether we could find ourselves in a bear market much sooner than that.
So how did we get here, and what can we expect in the days and weeks to come?
Gold Has Helped Preserve and Grow Capital in Times of Rising Inflation
It’s important to point out that the U.S. economy is strong right now, so the selloff likely had little to do with concerns that a recession is near or that fundamentals are breaking down. The Atlanta Federal Reserve is forecasting first-quarter GDP growth at 5.4 percent—something we haven’t seen since 2006. And FactSet reports that S&P 500 earnings per share (EPS) estimates for the first quarter are presently at a record high. A correction after last year’s phenomenal run-up is healthy.
Several factors could have been at work, including algorithmic and high-frequency quant trading systems that appear to have made the call Monday that it was a good time to take profits. Other investors seemed to have responded to Friday’s report from the Labor Department, which showed that wages in December grew nearly 3 percent year-over-year, their fastest pace since the financial crisis. This is a clear sign that inflationary pressure is building, raising the likelihood that the Federal Reserve will hike borrowing costs more aggressively than some investors had anticipated.

As I’ve explained many times before, gold has historically performed very well in climates of rising inflation. When the cost of living heats up, it eats away at not only cash but also Treasury yields, making them less attractive as safe havens. Gold demand, then, has surged in response. This is the Fear Trade I talk so often about.
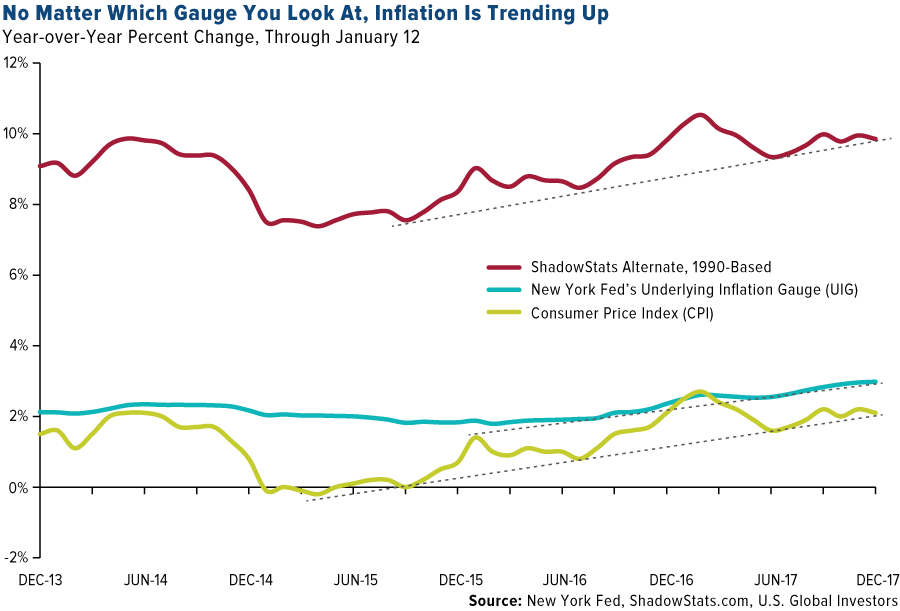
But which measure of inflation is most accurate? The Fed’s preferred gauge, the consumer price index (CPI), rose 2.1 percent year-over-year in December. Then there’s the New York Fed’s recently launched Underlying Inflation Gauge (UIG), which claims to forecast inflation better than the CPI by taking into consideration a “broad data set that extends beyond price series to include the specific and time-varying persistence of individual subcomponents of an inflation series.” The UIG rose nearly 3 percent in December. And finally, the alternate CPI estimate, which uses the official methodology before it was revised in 1990, shows that inflation could be closer to 10 percent.
Whichever one you choose to look at, though, they all indicate that inflation is trending up.
Making predictions is often a fool’s game, but I believe that after lying dormant for most of this decade, inflation could be gearing up for a resurgence on higher wages and borrowing costs. Now might be a good time to rebalance your gold holdings to ensure a 10 percent weighting.
“This pick-up in inflation and inflation expectations is positive for gold,” says BCA, “which we’ve shown to be an attractive hedge against rising prices.”
Long-Standing History of Performance
Besides being favored as a safe haven in times of crisis, gold has a history of attractive performance over the long term. Compared to many other asset classes, the yellow metal has been very competitive in multiple time periods.
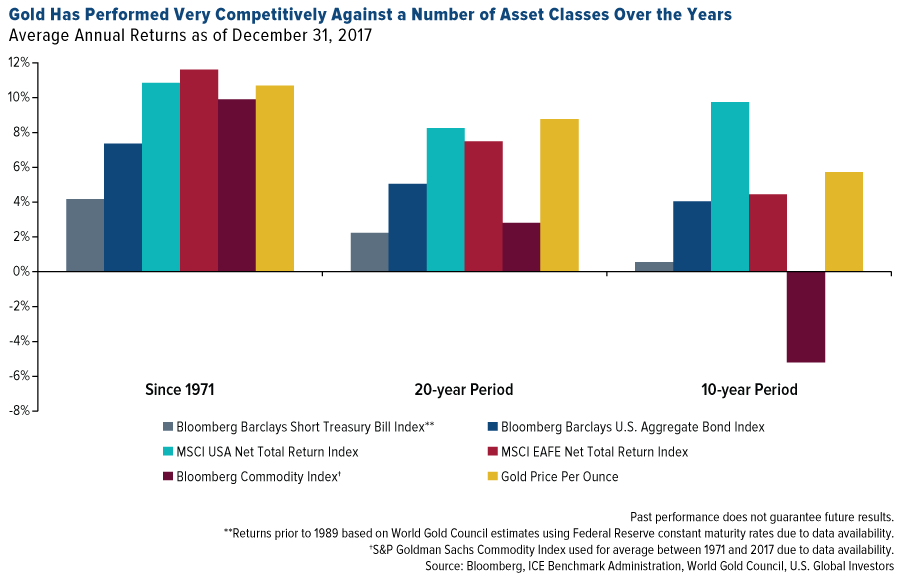
Since 1971, when President Richard Nixon finally took the U.S. off the gold standard, gold has outperformed all asset classes except domestic and international equities, as of December 31, 2017. In the 20-year period, gold crushed domestic and foreign stocks, bonds, cash and commodities. Most impressive is that, in every period measured above, the precious metal has beaten cash, bonds and commodities.
Having a 5 to 10 percent weighting in gold and gold stocks during these periods could have helped investors minimize their losses in other asset classes.
To learn more about gold’s role in times of rising inflation, click here.


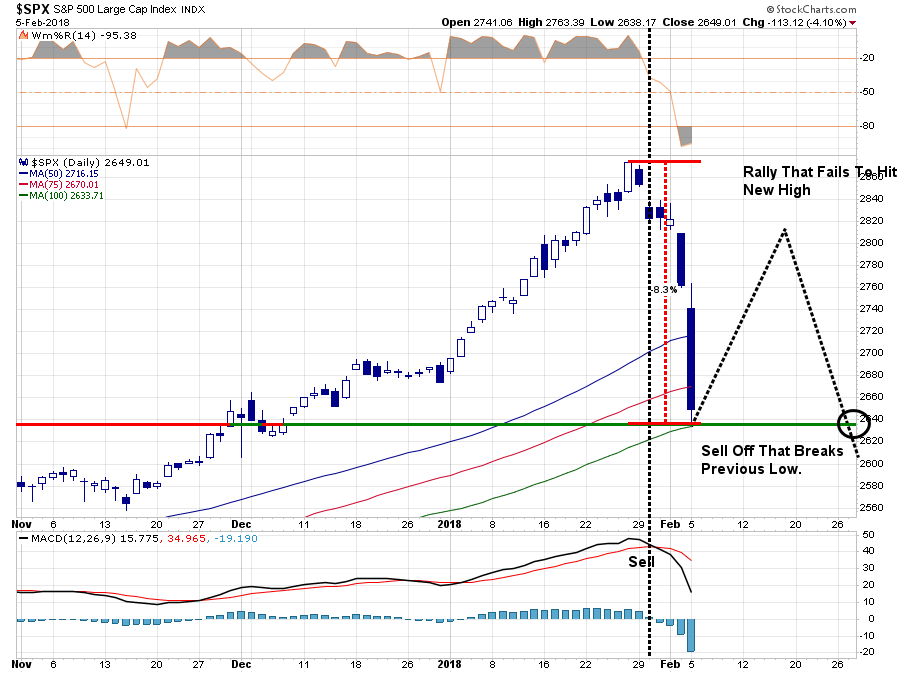
In this past weekend’s missive, I discussed the recent market sell-off:
“Well, this past week, the market tripped ‘over its own feet’ after prices had created a massive extension above the 50-dma as shown below. As I have previously warned, since that extension was so large, a correction just back to the moving average at this point will require nearly a -6% decline.”
Chart updated through Monday

 Before turning to the action I would like to put where we are in the “everything” bubble into perspective, as I had an insight this weekend, which everyone else may already have thought of, but it was new to me so I thought I would share it…
The Weakest Links…
When the stock bubble burst in March 2000, it was the most speculative elements with the highest imagination potential — i.e., the dot-com stocks — that signaled the end of the mania when they broke. Similarly, in the real estate bubble,
…also from King World:
James Turk – Phase 2 Will Pave The Way For $11,000 Gold

-
I know Mike is a very solid investor and respect his opinions very much. So if he says pay attention to this or that - I will.
~ Dale G.
-
I've started managing my own investments so view Michael's site as a one-stop shop from which to get information and perspectives.
~ Dave E.
-
Michael offers easy reading, honest, common sense information that anyone can use in a practical manner.
~ der_al.
-
A sane voice in a scrambled investment world.
~ Ed R.
Inside Edge Pro Contributors

Greg Weldon

Josef Schachter

Tyler Bollhorn

Ryan Irvine

Paul Beattie

Martin Straith

Patrick Ceresna

Mark Leibovit

James Thorne

Victor Adair