
Bonds & Interest Rates
While investors are justifiably focused on what may be the opening crescendo of a long overdue sell-off in stocks, there is not, as of yet, as feverish a discussion of the parallel sell-offs in bonds and the U.S. dollar, which have been underway for at least a year and a half in bonds and 14 months for the dollar. I contend that this should be widely understood as the root causes of the jittery Dow, and are ultimately far more important. A continued decline in the dollar and bonds holds the potential to ignite inflation while increasing mortgage rates, borrowing costs, and federal deficits. These developments would strike at the very heart of the economic foundation that has supported the country since the Financial Crisis of 2008, and threaten to push the economy into a recession that the Fed may be powerless to confront.
Secretary of the Treasury, Steve Mnuchin, stunned markets late last month when he said that a cheaper dollar would be a welcome development for the U.S. economy. The dollar sold off sharply as Mnuchin’s words appeared to be taken as proof that the Trump Administration overtly embraced a weaker dollar. To quell the uproar, President Trump himself, freshly arrived in Davos, Switzerland, had to “clarify” the Secretary’s comments, explaining, as only ‘the Donald’ can, that by “weaker” Mnuchin really meant “stronger.”
The exchange did provide a fresh twist on our decades-old “strong dollar policy,” which traditionally works like this: The President and/or senior Fed officials refer all questions about the health and trajectory of the U.S. dollar to the Secretary of the Treasury, who proclaims loudly and clearly, with no trace of irony, that “a strong dollar is in the national interest.” These comments reassure the markets, the dollar rises, and the operation is complete. Although this protocol is one of the simplest Washington has to offer, the Trump Administration managed to get it wrong on its first try.
Despite the fact that Trump’s vocal support for a “strong dollar” was not accompanied by any indication that he would actually do anything to support it, his words temporarily reversed the dollar’s 24-hour skid. But apart from reacquainting us to the absurdity of a “policy” that is simply based on mouthing a canned phrase, the episode raises a couple of key issues. Trump claimed that the economy is surging and, as a result, the dollar will keep getting stronger and stronger. The problem with these assertions is that neither is true.
Last week’s newly released Q4 GDP report from the Bureau of Economic Analysis (BEA) shows that the economy grew at 2.6% in the Fourth Quarter, bringing the entire year’s GDP growth rate to 2.4%, only .2% higher than the 2.2% GDP growth that we have averaged over the prior three years (2014-2016). And while 2.4% is marginally higher than the average growth we have had since the end of the 2008 financial crisis, it is still significantly below the average over the past century, and even weaker than two years of Obama’s second term.
The news is also surprisingly weak on the trade and employment fronts, another two areas for which Trump has shown particular enthusiasm. Contrary to the supposed “record job creation,” average monthly job gains in 2017 were 17% slower than the combined averages in 2015 and 2016, based on data from the Bureau of Labor Statistics. In fact, job growth in 2017 was its slowest pace since 2010. Similar disappointments can be found in America’s trade balance, which, according to Trump, has improved dramatically due to his “tough” negotiations and our resurgent manufacturing sector. But according to the U.S. Census Bureau, average monthly 2017 trade deficits (through November) were 11% wider than 2016, and 14% wider than the average over the prior 4 years. What’s worse is that these increases come at a time when a falling dollar, in theory, should have narrowed the gap!
Given all this, one would be hard-pressed to find the “boom” Trump describes, especially if one is also claiming that such windfalls were not occurring under Obama. But since when have facts ever mattered in Washington or on Wall Street?
So if Trump is wrong about the economy, jobs, and trade, what should we make of his view that “the dollar will get stronger and stronger?”
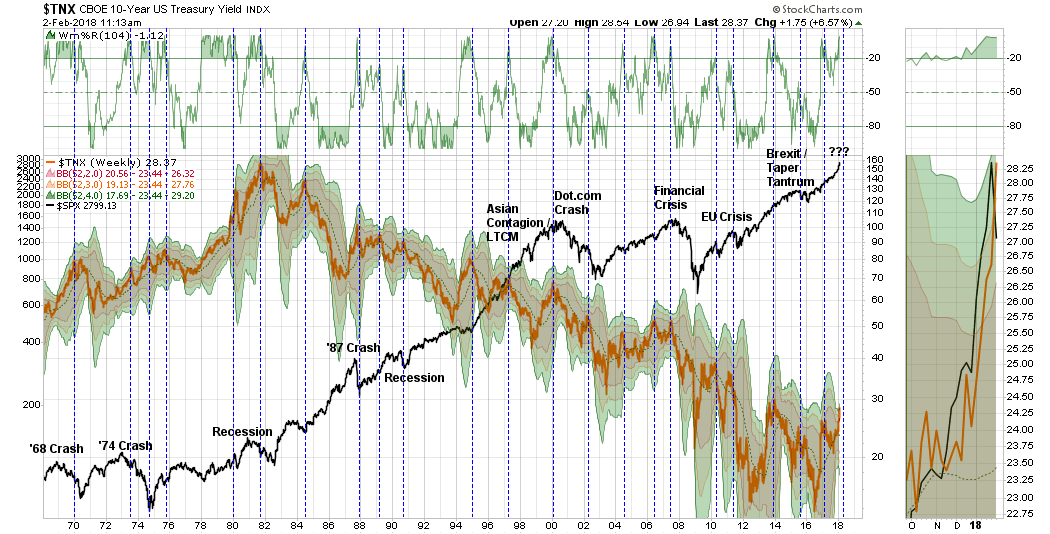
While the financial media has been focused on the stock market, most have dismissed the significance of the declining dollar. 2017 saw the first annual; decline in the dollar in five years and its largest decline in 14 years. 2018 is off to an even worse start, with the dollar registering its steepest January decline since 1987. In fact, against the Chinese yuan, January was the weakest month for the dollar since 1994. The current decline in the dollar index that began in December 2016 is now the longest continuous decline in the last 12 years. And while other recent declines have been steeper (see chart below), this one is distinct because it is occurring against a set of economic conditions that should be bullish for the dollar. Economic growth is assumed to be strong, consumer confidence is high, and the Fed is expected to keep raising interest rates and actually shrink its balance sheet (which would diminish the supply of dollars).

Data from Yahoo Finance, BEA, & Bloomberg
Created by Euro Pacific Capital
So if the dollar is falling now, with everything supposedly going in its favor, what should we assume will happen if the dollar’s luck runs out? A recession, which typically brings with it a decline in GDP and consumer confidence, and which may cause the Fed to reverse policy, may likely knock out the remaining supports for the dollar and result in deep declines. But given the nearly universal optimism that prevails in financial and political centers, it’s unlikely that these concerns are widely shared.
Over the past century, the U.S. economy has experienced a recession, on average, every six and a half years. Despite the fact that more than a decade has passed since our last recession began, few forecasters see another one looming. But interest rates are currently creeping up further and faster than nearly anyone had predicted. At 2.85%, the yield on the 10-year Treasury is currently at its highest level in nearly 4 years. Except for a few days in December 2013, yields haven’t been higher than 3% since mid-2011. It’s very possible that rates on the 10-Year Treasury will relatively soon break through 3%, perhaps lifting mortgage rates and bank loan rates into territory that we haven’t seen for well over a decade.
But it’s absurd to expect that yields won’t go considerably higher than 3%, especially given how the supply of Treasury bonds coming to market will balloon in coming years. As reported last week by the Wall Street Journal, the Treasury Borrowing Advisory Committee – a group of private banks that advises the Treasury – estimated that $955 billion of Treasury debt will come to the market this year (up from $519 billion last year), and that the issuance will surpass $1 trillion in fiscal 2019 and 2020. The Journal reports that the Committee ramped up its estimates due to the recently passed tax cuts. So the issuance of Treasuries may spike just as demand for them may wane due to a possible slowing economy and a falling dollar. Just today, the Associated Press reports that a potential budget deal being discussed in Congress would grant both parties their respective spending priorities, resulting in a $1 trillion deficit as soon as next year. Recall that the only other times that we ran deficits that large were the years 2009-2012, a period in which the Federal Reserve was buying nearly half a trillion per year of Treasury debt through its Quantitative Easing program. But now the Fed has promised to effectively sell bonds to shrink its balance sheet, in a process that could be called “Quantitative Tightening.” This is a recipe for an enormous decline in the bond market, which could send yields much higher.
Does anyone really expect that our current economy could absorb rates on the 10-year that might hit 4% or higher without slowing? Perhaps they are just too numbed by success to care at this point. In fact, if rates rise above 4%, what is there to prevent them from surging much higher? It’s ironic that as stock market investors ignore the collapse in bond prices, the one thing that might prevent a bond market crash would be for the stock market to crash first, thereby forcing the Fed’s hand. Yet the markets seem unconcerned.
Since the Federal Reserve and the U.S. Government began intervening in the markets in the wake of the 2008 financial crisis, there has been almost no downside volatility in stocks. With the exception of a trivial 8% decline in the opening two weeks of 2016, the nearly 300% rally in the Dow since March of 2009 has been achieved with hardly a step backwards. The 10% and 20% corrections that were fairly commonplace throughout much of the 20th Century, now seem to be relics of the past. In fact, despite the recent breakneck speed of ascent (40% gain in just 15 months) and the record level valuations (stocks trading around 27 times trailing earnings), the volatility index, which is commonly viewed as a measure of investor fear, is remarkably, almost historically, low.
It does seem that fear and worry have been thoroughly banished from Wall Street.
But the dollar itself may be a window into the troubled souls of otherwise carefree investors. Even in the market surge of the past decade, there have been some isolated moments when daily declines are significant. By looking at what “safe haven” choices investors make on the market’s worst days, we can potentially see what may happen if the market experiences sustained selling.
If we look at the average of 10 worst market days each year during the five years from 2008 to 2012, 50 days when the Dow dropped by at least 100 points, we can see that the dollar tended to rally in the panic. During those days, the dollar index rallied 80% of the time, and on average rose .6% on the day. This seems to reflect that the dollar maintained its “safe haven” status. But, in more recent years, that has changed considerably. Averaging the 10 worst market days of each year in the market from 2013 to 2017, the dollar fell on those 50 days by approximately .3%, and it only rose 26% of the time.

Data from Yahoo Finance, BEA, & Bloomberg
Created by Euro Pacific Capital
Past performance is not indicative of future results
This shift in sentiment could be extremely significant in the years ahead. This is why a simultaneous collapse in bond prices and the dollar could be so significant. It could show that rising interest rates do not reflect improved growth, as so many stock market bulls conveniently claim, but a loss of confidence in the dollar and the creditworthiness of the United States.
The onset of both of our previous recessions (2000 and 2008) inspired the Fed to cut interest rates by at least 500 basis points. Currently the Fed Funds rate is still under 1.5%. If a recession comes, 150 basis points in cuts before the rate hits zero may not be nearly enough to provide the stimulus that the markets have come to expect. That may mean that the next recession might almost assuredly bring with it another round of quantitative easing from the Fed. But the Fed has already prepared the currency markets for its balance sheet to shrink. Imagine the reaction when the opposite occurs.
A recession that brings on another dose of QE could help to create the perfect conditions to help push the dollar to record lows, continuing its long-term bear market that began in the early 1970s. The low for the dollar Index in 2008, just before the dollar was saved by the financial crisis, was just above 70. It is currently just above 89, having traded above 104 as recently as January of 2017. My guess is the next leg down could take the dollar index to 60. To support the currency, the Fed would have to follow the example of Paul Volcker, who hiked interest rates in the 1980s when the dollar was collapsing. Of course, such moves to prop up the dollar during a recession will be acutely unpopular and may bring on a recession worse than the one seen in 2008. If the Fed lacks the courage to administer such medicine, a dollar index at the 40 level might not be ruled out.
All this adds up to a possibly rough road for investors who maintain 100% exposure to the U.S. dollar.
Read the original article at Euro Pacific Capital

Unfortunately for crypto investors “HODLING” onto Ripple, their huge gains have been wiped out in just the past few weeks. While Ripple’s price surged to massive percentage gains in a short period, it came down just as fast. Unbelievably, Ripple’s price surged from less than a penny in March 2017 to a peak of $2.81 on Jan 1st, 2018.
Ripple’s stunning price increase would have made investors during Holland’s 17th Century Tulip Bubble, quite envious. Ripple’s price increased a staggering 46,700% in a mere nine months:

Ripple was trading at $0.006 at the beginning of March 2017 and then shot up to a peak of $2.81 on Jan 1st. An investor who placed a $100 bet on Ripple at that time, would have earned $47,000 if they were able to cash out at the top. Not bad. However, I doubt most individuals cashed out near the top… maybe a few.
Unfortunately, there is this idea put forth by many Crypto Aficionados that holding, or “HODLING” onto Bitcoin and the Cryptos for a long period is the way to go. I have even seen some of these crypto aficionados record videos of themselves, wearing hats that say, “HODL,” telling their followers to hold onto their cryptos for much more significant gains in the future.
One of the more highly touted crypto aficionados in the alternative media is claiming that the new target price for Bitcoin is $13,888. While anything is possible in the future, as Bitcoin’s price continues to head lower, down to its next stop at $6,500, the $13,888 Bitcoin price target by the end of February seems less and less likely.
Okay… now that I said that I want to make something perfectly clear. I had a much different opinion of Bitcoin and the Crypto markets last year. It wasn’t until I began to witness the tremendous amount of fraud, corruption, and leverage in the crypto market did I change my mind. Regardless, I believe the SELLOFF in the Crypto Market will continue until the Bubble has popped for good.
Today, Ripple’s price was down another 20% at the lows:

While it may be unpleasant for crypto investors to read my negative opinion about the market, I have to provide the information as I see it. Even though there is a chance Bitcoin and the Crypto prices will move higher and see some nice percentage gains for a while, if I were holding onto Bitcoin, I would certainly CONSIDER cashing out on price gains, rather than waiting for Bitcoin to reach $100,000. Please understand, I am not giving out any investment advice, just sharing what I would do.
Currently, Ripple is trading at $.70, down 75% from its high of $2.81. While investors who purchased Ripple for a few pennies are still sitting on nice gains… they are still SITTING on gains. You don’t enjoy profits until you cash out.
I will end this brief post by stating the following: When the CryptoMarket finally capitulates, the alternative media community can finally get back to focusing on GOLD & SILVER… the true stores of wealth.
Check back for new articles and updates at the SRSrocco Report.
 The Dow sets a startling record
- The biggest drop since 2011
- Plus: What’s next for the stock market?
Investors took a sledgehammer to the face yesterday as the major averages posted their worst drop in more than six years.
The Dow shed 1,175 points (its biggest point lost in history) to close lower by a staggering 4.6%. The S&P 500 wasn’t far behind, posting a loss of more than 4%. In a dramatic shift, the major averages flipped from extremely overbought to painfully oversold in a matter of days.
The stock market carnage is the top story at many major media outlets. Everyone wants to know what pushed stocks down an open elevator shaft. Was it earnings? The Nunes memo? A Trump tweet?
Nope.
The truth is the market has grinded higher without a correction for too long. Stocks were too hot. Volatility was dead. Something had to give.
Check out this chart:
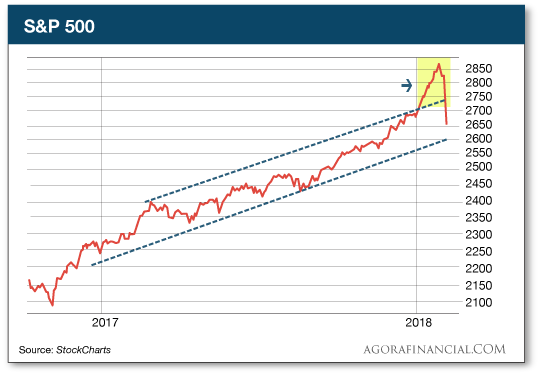
The S&P 500 grinded higher for the past 15 months. You can clearly see the upward channel it carved out during 2017. It was a historically smooth run, with no significant shakeouts spooking investors — just a slow, orderly grind higher.
But look how the trend accelerated in January. Stocks went parabolic as they blasted through the roof almost every single day. Toward the end of the month, the major averages were all higher by at least 7%.
That’s clearly unsustainable. But investors didn’t care. They were making money hand over fist, lulled to sleep by a market that never went down. So it’s no surprise that a 4% drop is sending shockwaves of panic across Wall Street. None of us remember what a drop of this magnitude feels like!
All is not lost, of course. The major averages are now back to levels we haven’t seen since December. Generations of wealth haven’t disappeared into thin air — just seven weeks of gains. That should put this week’s drop into perspective.
Believe it or not, yesterday’s biggest losers weren’t stock market investors. As it turns out, volatility traders are the ones who have suffered the most during the market’s breakdown this week, causing some hidden panic in the markets late last night that you probably didn’t see…
The unusually smooth rally has encouraged big bets against volatility using inverse VIX funds such as the VelocityShares Daily Inverse VIX Short Term ETN (XIV). These trading vehicles go up when the Volatility index goes lower. Naturally, many traders have viewed this as a “sure thing” trade every time the market drops. They simply bet against volatility, the market bounces, and they collect their winnings.
That’s not what happened on Monday. Instead of a bounce off Friday’s lows, stocks tumbled and volatility spiked, sending XIV lower.
But the real panic happened after hours. XIV traders slammed the sell button as fears of a volatility event spread. XIV was eventually halted, down a staggering 80% after hours after dropping just 14% during Monday’s session.
We don’t have any complex bets on volatility in our portfolio. But that doesn’t mean a volatility unwind won’t affect the markets in the days ahead. We’ll have to look for signs of contagion and act appropriately.
Barring any of these nasty volatility concerns creeping into the stock market, we should look for a potential relief rally to materialize soon. When and how the market bounces should give us some clues as to what to expect and how we should trade the return of some exciting market action.
Buckle up. It’s going to be a wild ride…
Sincerely,
Greg Guenthner


Last week, I discussed the continuation of the “market melt-up.” To wit:
“Since the beginning of the year, the acceleration in the markets has continued unabated. As I showed yesterday, the acceleration in the S&P 500 has now gone parabolic.”
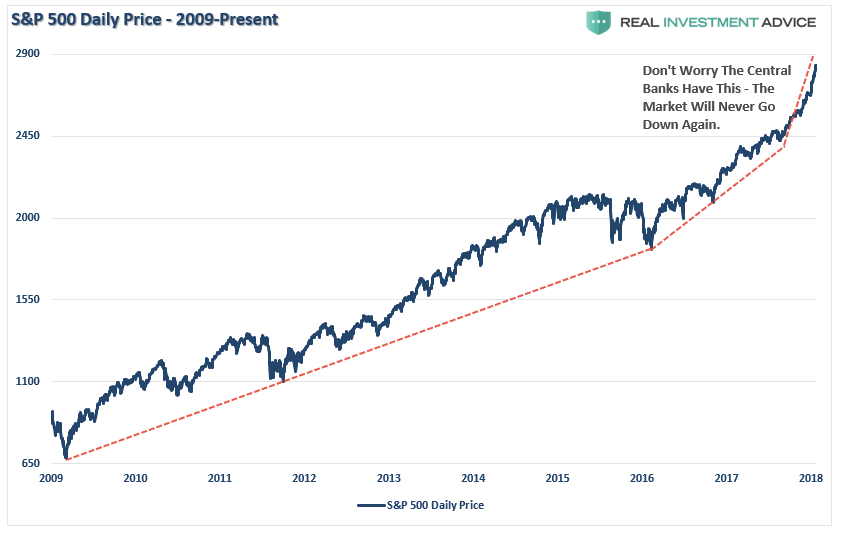
“Never before in recent history has the market been this overbought and extended from longer-term averages which suggests that a correction that reduces such conditions is highly likely in the near-term.”
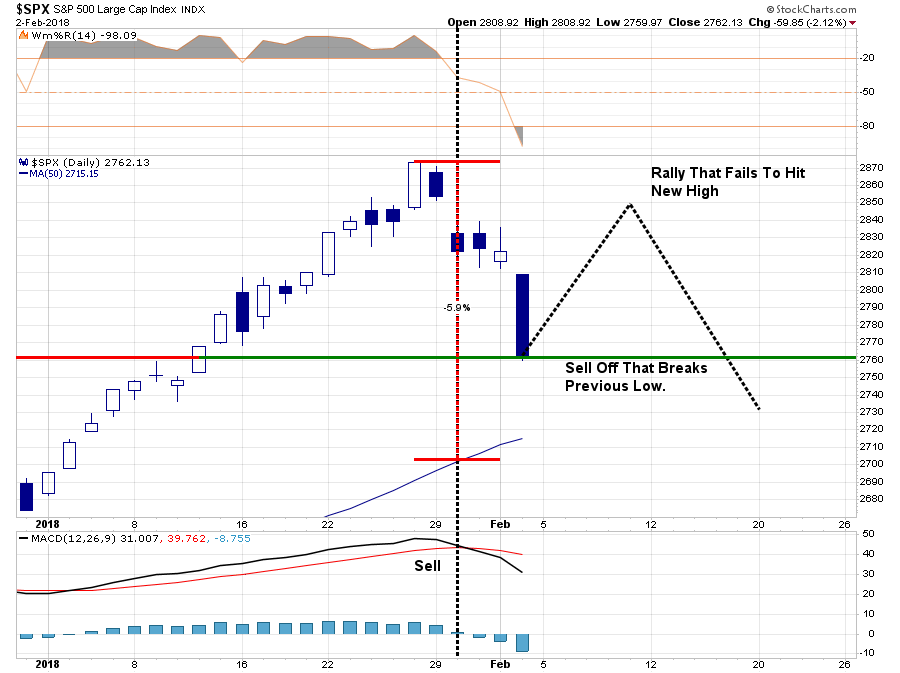
Well, this past week, the market tripped “over its own feet” after prices had created a massive extension above the 50-dma as shown below. As I have previously warned, since that extension was so large, a correction just back to the moving average at this point will require nearly a -6% decline.
I have also repeatedly written over the last year:
“The problem is that it has been so long since investors have even seen a 2-3% correction, a correction of 5%, or more, will ‘feel’ much worse than it actually is which will lead to ’emotionally driven’ mistakes.”
The question now, of course, is do you “buy the dip” or “run for the hills?”
Don’t do either one, yet.
Yes, corrections do not “feel” good. But they are part of a “healthy” market cycle. In more normal, healthy, bullish trends corrections should be used as buying opportunities to increase exposure to equity risk in portfolios.
However, the recent parabolic acceleration in the markets heading into the New Year was neither normal or healthy. Much of it had to do with the massive liquidity injection by the Federal Reserve at the end of 2017 as shown below.

But, after the stumble this past week, it will be interesting to watch the next the Fed’s balance sheet over the next month to see if they continue with their planned $30 billion / month reduction.
At the moment, this is the expected correction we have been discussing over the last several weeks. It is also something we had planned for by reducing overweight positions and adding a short-hedge to portfolios.
With the markets on a short-term sell signal (noted by gold vertical dashed lines in the chart above,) the current correctional process is underway and still has room to go at this juncture. But, with the market now oversold on a VERY short-term basis a rally over the next week, or so, would not be surprising.
It is the outcome of that rally that is most important to the current bull market advance.
This is what we are looking for to drive our next set of portfolio actions:
- If the market rallies back and sets a new closing high, the bullish trend will be confirmed and equity allocations will remain at target levels and hedges removed.
- If the market rallies back BUT FAILS to set a new high, a series of actions will take place.
- At the point of rally failure, portfolio hedges will be modestly increased.
- If the subsequent decline breaks the previous low, the hedges will be further increased and tactical trading long positions will be reduced.
Why is this important?
A Hint Of 1987
A recent article on Zerohedge discussing a view of Albert Edwards is salient to this discussion.
“Certainly, as we explained at our Conference, the current conjuncture feels similar to just before the 1987 equity crash. All that was missing was the slanging match over the weak dollar between the US and Europe.”
He’s right. There are many similarities between today and 1987. Recently passed tax legislation reform, exuberance in the markets, and a strong market rally.
And then the crash.
But no one could have seen that coming? Right?
(We have an in-depth report, titled 1987, coming out next week ONLY for our newsletter subscribers and those who have expressed an interest in our soon to be released RIA Pro.
If you are not currently on our email list and want a copy of the report click here.)
Actually, there were five technical signals, that when considered along with fundamental factors should have been enough to warrant caution at a minimum…that is if you were paying attention.
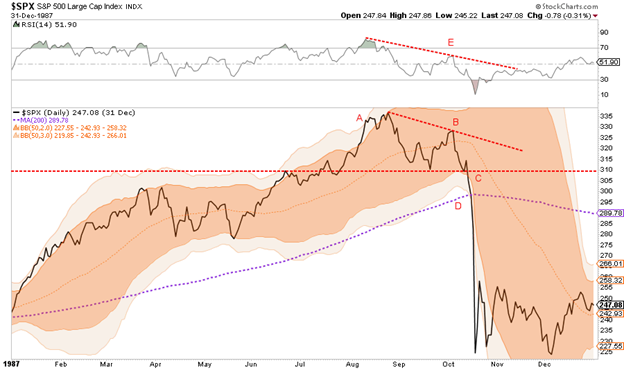
The graph above, from our 1987 article, highlights the technical indicators which are explained in the report along with a summary of the myriad of fundamental factors that preceded Black Monday. There are certainly many differences between today and 1987, but as we highlight in the report there are many similarities as well worth considering.
Along with plummeting stock prices in October of 1987, interest rates also declined sharply as money sought the relative safety of bonds.
It is here that I also agree with Albert Edwards:
“Every man, woman, and child seems to have decided that the US 10y bond yield has broken out of its long-term downtrend and we are in a bond bear market. Our own excellent Technical Analyst, Stephanie Aymes, shows that 3% (not 2.6%) is the key long-term breakout yield we should be watching. But she thinks that 2.64% was also significant as this means the RSI downtrend has now been broken and a run to 3% is now perfectly plausible. That though does not mean the bond bull market is over.”
With yields now closing on 2¾% and the 30y closing on 3.0%, many see this as a great time to dump bonds and switch into equities. Really?
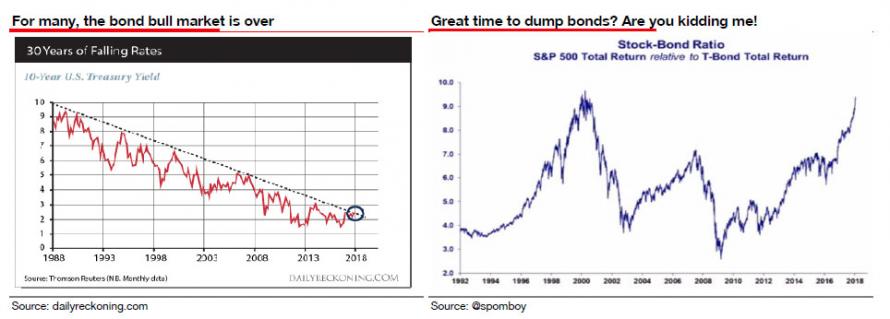
“Well, I expect that the true extent of how close the US is to actual outright deflation, and hence how high real yields currently are, will soon be revealed. But before US 10y yields turn negative, expect them to visit 3% first.“
He is absolutely right. Despite a rampant rise in the markets, the recent spate of economic growth has been due to massive natural disasters across the lower third of the U.S. The impetus from those rebuilding efforts are now running their course and we are already seeing a weakness in the numbers.
But wages are crushing it, and employment is booming?
Yes, wages are rising but only for the top 20% of workers.
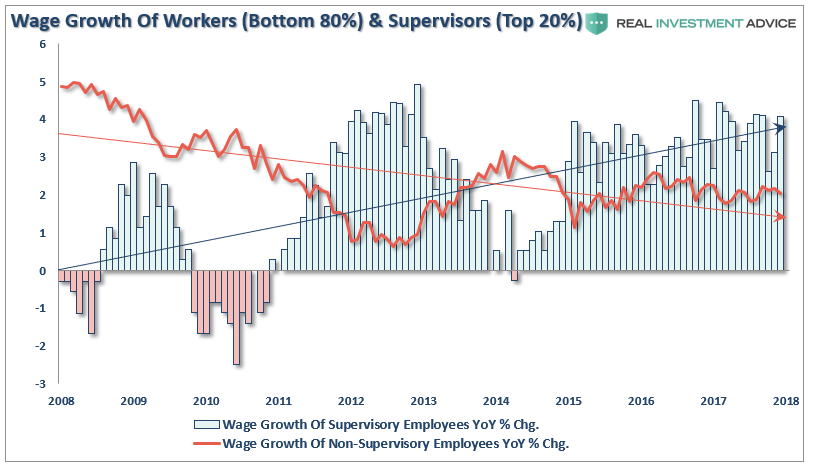
And employment in the key demographic is not.

The Next Bull Market
Edwards is correct. There are several important points to understand about bonds.
- All interest rates are relative. With more than $10-Trillion in debt globally sporting negative interest rates, the assumption that rates in the U.S. are about to spike higher is likely wrong. Higher yields in U.S. debt attracts flows of capital from countries with negative yields which push rates lower in the U.S. Given the current push by Central Banks globally to suppress interest rates to keep nascent economic growth going, an eventual zero-yield on U.S. debt is not unrealistic.
- The coming budget deficit balloon. Given the lack of fiscal policy controls in Washington, and promises of continued largesse in the future, the budget deficit is set to swell back to $1 Trillion or more in the coming years. This will require more government bond issuance to fund future expenditures which will be magnified during the next recessionary spat as tax revenue falls.
- Central Banks will continue to be a buyer of bonds to maintain the current status quo, but will become more aggressive buyers during the next recession. The next QE program by the Fed to offset the next economic recession will likely be $2-4 Trillion which will push the 10-year yield towards zero.
The next bull market is coming, it just won’t be in stocks.
It will be in the U.S. Treasury market which will coincide with the next recessionary drag in the economy within the next 12-18 months (at the most).
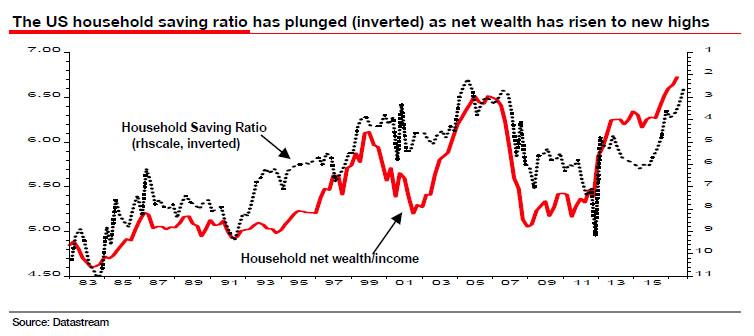
As I have written previously, interest rates have everything to do with economic growth. Since economic growth is almost 70% driven by consumption, with savings rates extraordinarily low and debt hitting record levels, small increases to interest rates will have an immediate negative impact on the consumptive capability of U.S. citizens.
The chart below goes to my point. Currently, interest rates are 4-standard deviations above their 1-year moving average. (For an explanation read this.)
How often has this happened going back to 1965?
Never.
Negative events such as the S&L Crisis, Asian Contagion, Long-Term Capital Management, etc. all drove money out of stocks and into bonds pushing rates lower, recessionary environments are especially prone at suppressing rates further. Given the current low level of interest rates, the next recessionary bout in the economy will very likely see rates near zero.
Furthermore, given rates are already negative in many parts of the world, which will likely be even more negative during a global recessionary environment, zero yields will still remain more attractive to foreign investors. This will be from both a potential capital appreciation perspective (expectations of negative rates in the U.S.) and the perceived safety and liquidity of the U.S. Treasury market.
However, what you will notice is that each time rates were as overbought as they are currently, they coincided with either a recession, a correction, or a major market crash.
Could this time be different? Sure. It’s possible.
But probably, it won’t be. The stock market is a reflection of the economy, not the other way around. Higher interest rates are a drag on economic growth which will impact earnings and valuations for the market.
Not tomorrow. Or even next week.
But over the next several months, higher interest rates, if they remain elevated for long, will have a deleterious effect on the economy.
Valuations will become problematic.
Furthermore, the safety of bonds becomes much more attractive when the yield is significantly above the dividend yield in stocks. (Why take the risk is stocks for a sub-2% yield when I can get 3% in a U.S. Treasury?)
That’s not hard math.
Things are finally starting to get interesting.
See you next week.
Market & Sector Analysis
Data Analysis Of The Market & Sectors For Traders
S&P 500 Tear Sheet
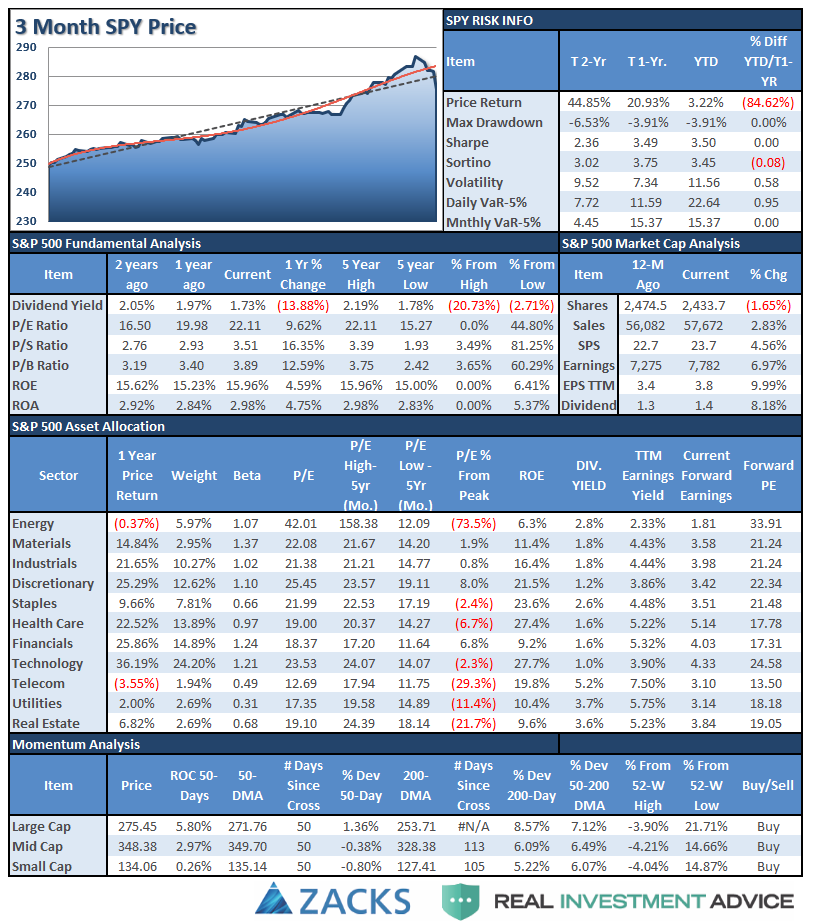
Performance Analysis
We are updating this analysis, it will return next week.
ETF Model Relative Performance Analysis
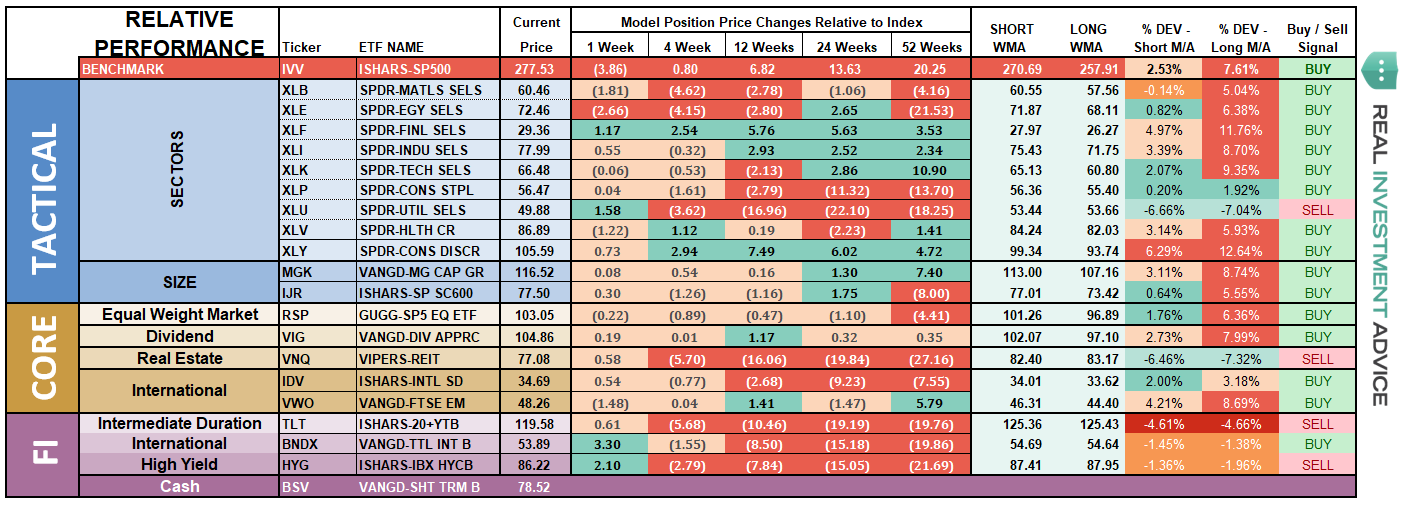
Sector & Market Analysis:
Well, that escalated quickly.
Last week I wrote:
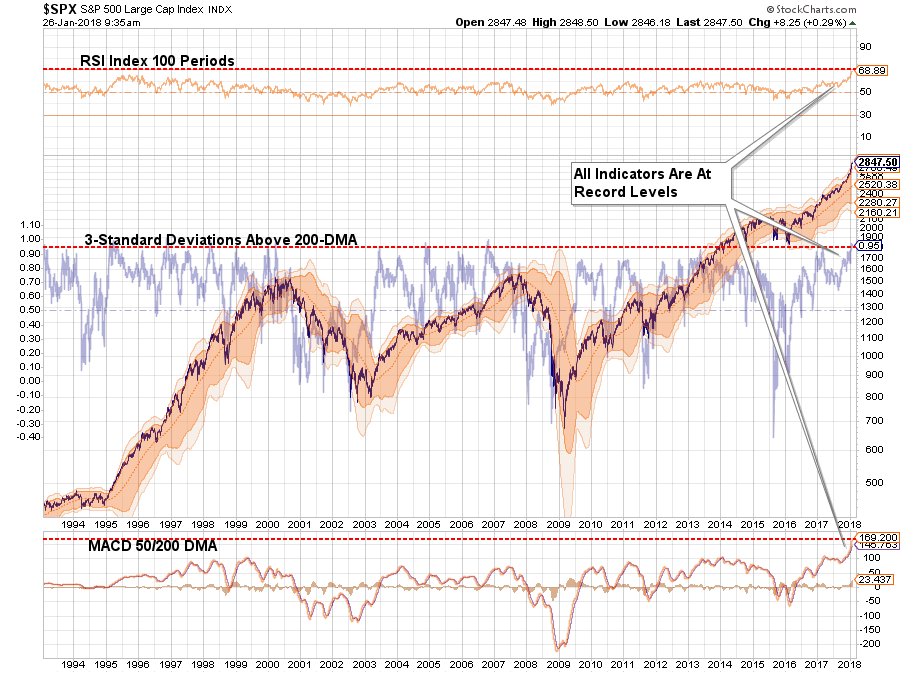
“This is just getting a bit TOO extreme. Take a look at the sectors below. Every sector is pushing 2- and 3-standard deviations of longer-term moving averages.
This isn’t normal.”
The reversal came this past week.
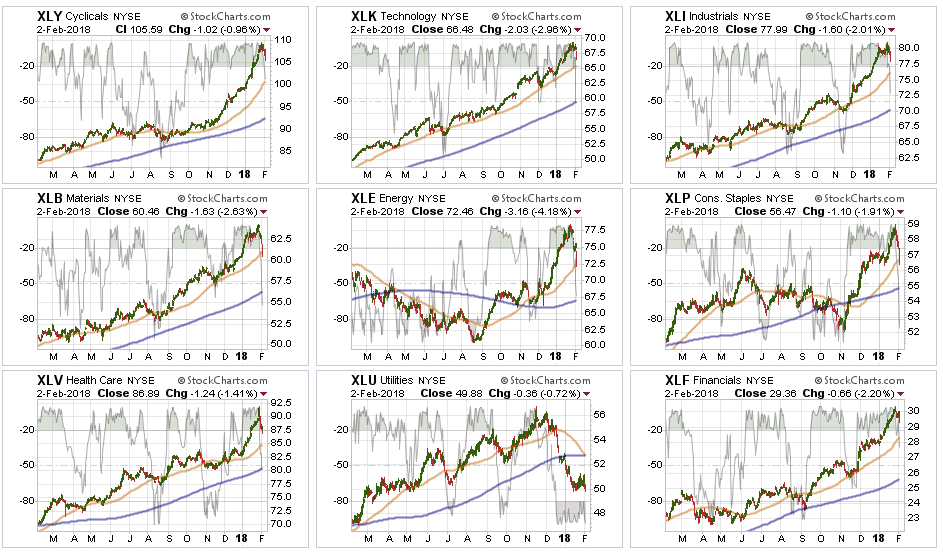
Every Sector was in sell-off mode last week, in particular on Friday, as money left the markets entirely. Basic Materials, Energy, and Staples all broke their 50-dma, while Healthcare, Financials, Discretionary, Technology, and Industrials are still heading towards it.
While it is VERY likely we will get a counter-trend bounce next week, there is still likely more selling to come as we head into February. The question is whether current bullish trends will hold, or not? I suspect they will, for now, which will keep portfolios primarily allocated to the long-side. However, we will monitor and adjust holdings accordingly.
Utilities, we remain long the sector for now but are re-evaluating our holdings with the recent break in support. With the sector very oversold, we are likely going to see a bounce in the days ahead so we will reconsider our holdings and sell into strength if we don’t see improvement in short order.
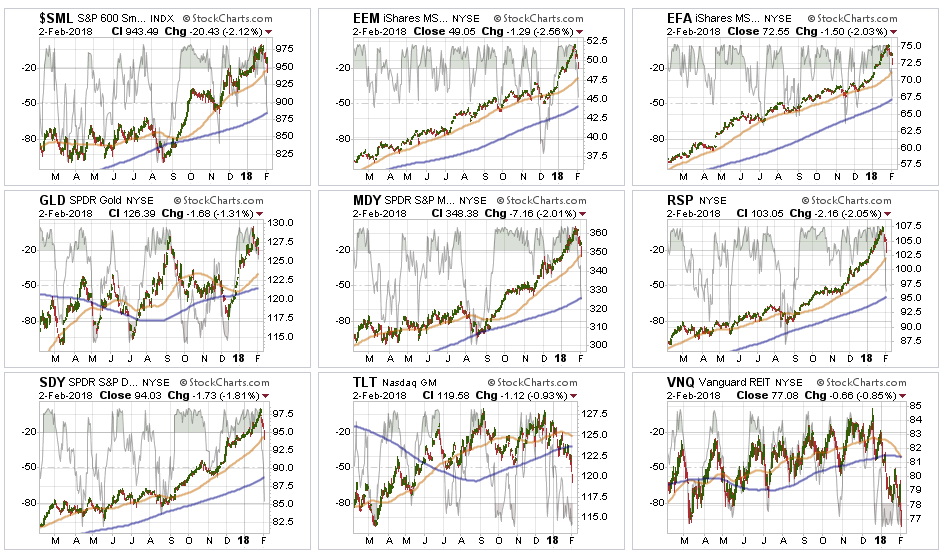
Small and Mid-Cap index We hare repeatedly suggesting taking profits and rebalancing to portfolio weights in recent months. The sell-off last week explains why. While markets all remain positively trending currently, risk is rising that something more may be on the horizon. Use any bounce next week to rebalance holdings and raise stops if you have not already.
Emerging Markets and International Stocks As noted above, rebalancing portfolio weights and reducing some risk is prudent here as well. Trends remain positive, but there is risk of a bigger correction on the horizon so a bit of risk management remains prudent.
Gold – we have been on the lookout for a pullback in the overbought condition of gold to add it to portfolios. We may be getting that opportunity. A pullback to support at the 50-dma should provide a good opportunity to add a trading position to the metal. We will keep you apprised.
S&P Equal Weight & Dividend Stocks – Dividend stocks are flirting with support, but are now back to oversold conditions. After a hefty rise, we will look to trim back positions on a rally in the next week.
Bonds and REIT’s – We remain long these sectors currently, but they are both testing our long-term stop loss levels. With rates GROSSLY extended, as noted in the main missive above, we will look for a rally to re-evaluate our holdings. We still expect interest rate sensitive holdings to be important during a “risk off” rotation, although that wasn’t the case this past week. Our conviction on these positions continues, but we are still honoring our longer-term stop-loss levels and will exit accordingly if needed.
Sector Recommendations:
The table below shows thoughts on specific actions related to the current market environment.
(These are not recommendations or solicitations to take any action. This is for informational purposes only related to market extremes and contrarian positioning within portfolios. Use at your own risk and peril.)
I am republishing last week’s table to as we had recommended reducing positions across the board due to the sharp ramp in asset prices.
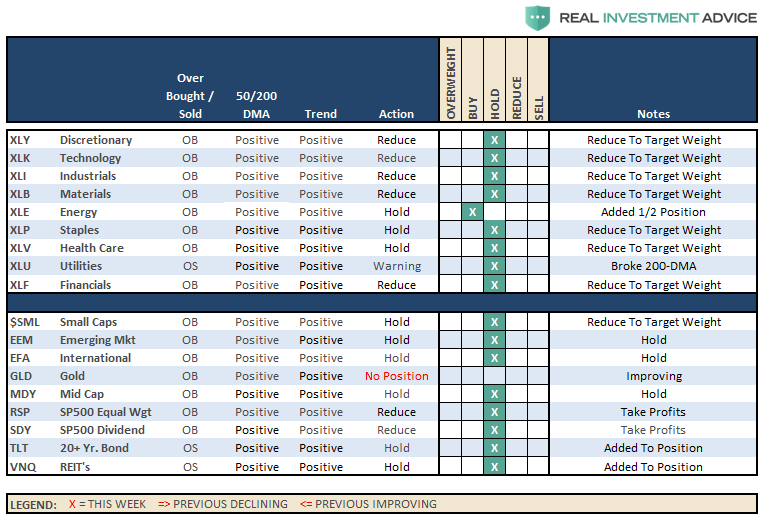
Currently, HOLD, all positions until we get a better understanding of the current correction as noted above. I will update strategy and actions on Tuesday.
Portfolio Update:
Over the last several weeks, we have repeatedly noted the near parabolic rise in the markets and the addition of hedges being added to our portfolios. As noted in the main body of this weekly missive, we shouldn’t make rapid, emotionally based, decisions based on an initial correction.
It is what the market does “next” which will determine our next course of actions.
As far as portfolios go, we continue to maintain our current positions.
- We have taken profits in some of our positions that were most grossly extended.
- We added a short S&P 500 position which is currently working.
- Interest rates, in the very short-term, are not cooperating with our interest rates sensitive exposure and we are monitoring those positions very closely for our next actions.
Currently, everything remains within our longer-term tolerance bands for risk controls. While corrections certainly do not “feel” good, it is important we don’t let short-term pickups in volatility derail longer-term investment strategies.
While positions are certainly under-pressure currently, we are monitoring them closely. We do not recommend making wholesale changes to investments based on a minor market correction which remains well confined to a long-term bullish trend. We are highly concerned about the underlying risk and remain focused on capital controls.
THE REAL 401k PLAN MANAGER
The Real 401k Plan Manager – A Conservative Strategy For Long-Term Investors
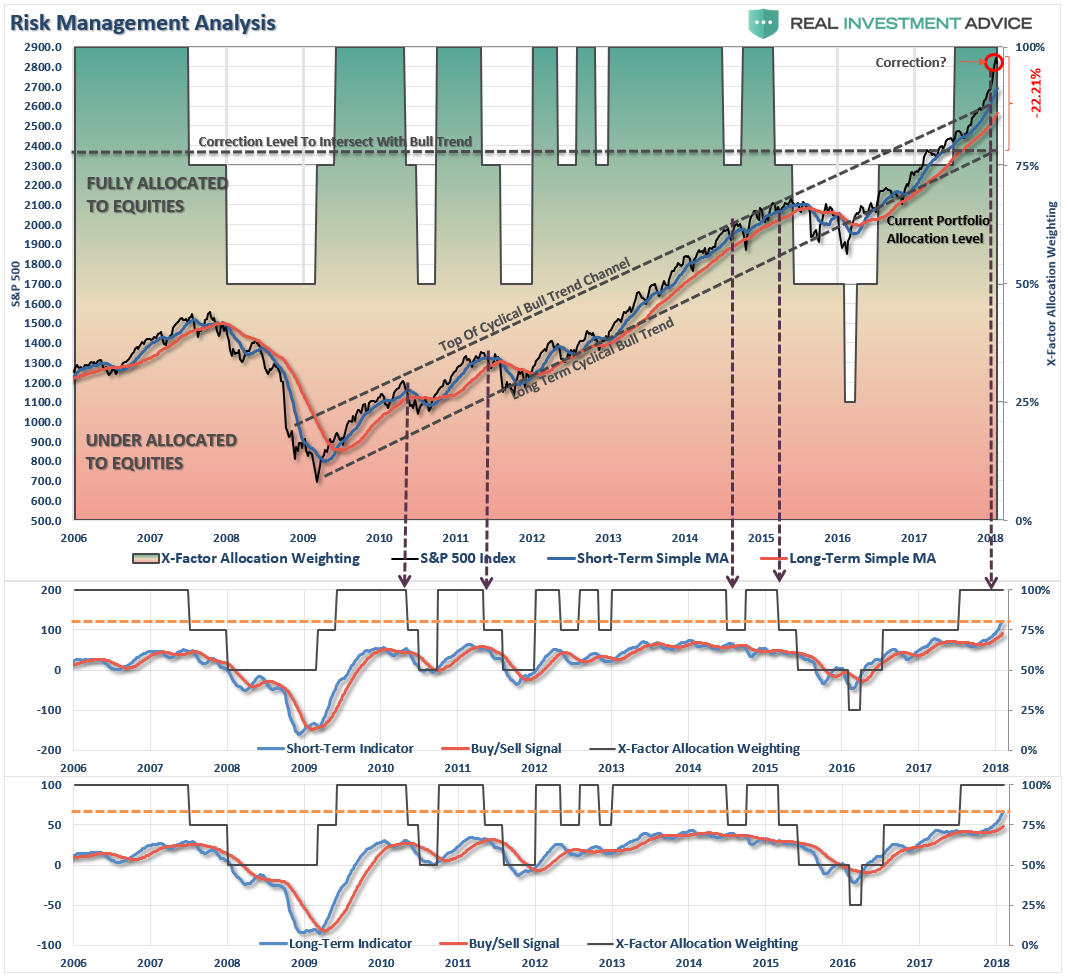
There are 4-steps to allocation changes based on 25% reduction increments. As noted in the chart above a 100% allocation level is equal to 60% stocks. I never advocate being 100% out of the market as it is far too difficult to reverse course when the market changes from a negative to a positive trend. Emotions keep us from taking the correct action.

Don’t Panic….Yet.
As I penned last week:
“Over the last several weeks, I have noted how the current advance just keeps getting “nuttier.” The acceleration of the advance is not only unsustainable, it is also dangerous, as eventually it will lead to a very sharp reversion that few investors are ready for.
But, I know. It hasn’t happened yet.
However, just because it hasn’t happened yet, does not mean it won’t. As with everything in life, ‘timing’ is everything.”
Well, it happened.
And yes, it certainly did not “feel” good.
But as noted repeatedly throughout this weekend’s missive, it is important NOT to mistake a short-term correction for a full-blown reversion. I have circled the “crash” in RED in the chart above…if you can see it.
Keeping perspective is always important.
While this COULD be the beginning of a larger corrective process that will require further action, it is simply WAY to early to know for sure. As I laid out in the main body above, the actions of the market over the next week, or two, will determine our next major course of action.
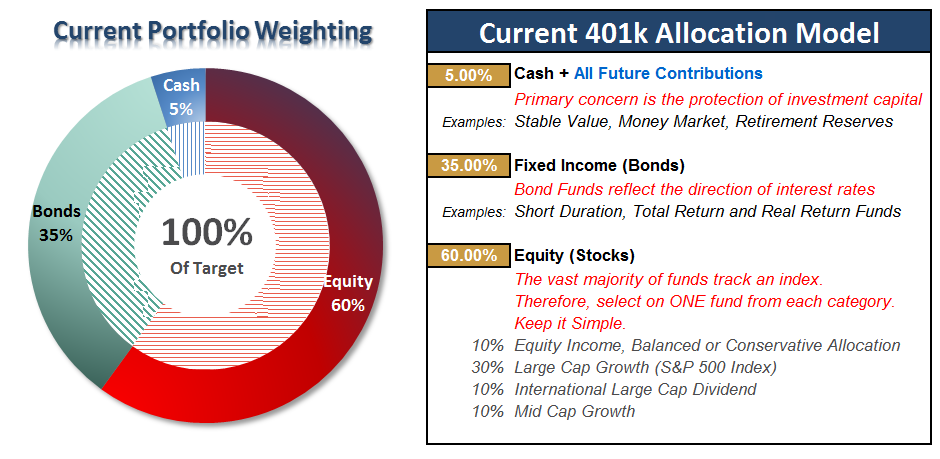
Continue adding All NEW contributions to cash or cash equivalents like a stable value fund, short-duration bond fund or retirement reserves. We will use these funds opportunistically to add to weightings when the market decides where it is headed next.
If you need help after reading the alert; don’t hesitate to contact me.
Current 401-k Allocation Model
The 401k plan allocation plan below follows the K.I.S.S. principle. By keeping the allocation extremely simplified it allows for better control of the allocation and a closer tracking to the benchmark objective over time. (If you want to make it more complicated you can, however, statistics show that simply adding more funds does not increase performance to any great degree.)
401k Choice Matching List
The list below shows sample 401k plan funds for each major category. In reality, the majority of funds all track their indices fairly closely. Therefore, if you don’t see your exact fund listed, look for a fund that is similar in nature.

Lance Roberts

Lance Roberts is a Chief Portfolio Strategist/Economist for Clarity Financial. He is also the host of “The Lance Roberts Show” and Chief Editor of the “Real Investment Advice” website and author of “Real Investment Daily” blog and “Real Investment Report“. Follow Lance on Facebook, Twitter and Linked-In

-
I know Mike is a very solid investor and respect his opinions very much. So if he says pay attention to this or that - I will.
~ Dale G.
-
I've started managing my own investments so view Michael's site as a one-stop shop from which to get information and perspectives.
~ Dave E.
-
Michael offers easy reading, honest, common sense information that anyone can use in a practical manner.
~ der_al.
-
A sane voice in a scrambled investment world.
~ Ed R.
Inside Edge Pro Contributors

Greg Weldon

Josef Schachter

Tyler Bollhorn

Ryan Irvine

Paul Beattie

Martin Straith

Patrick Ceresna

Mark Leibovit

James Thorne

Victor Adair