
Timing & trends
 For the people most immersed in the tech sector, it’s hard to think of a more controversial topic than the ultimate impact of artificial intelligence (AI) on society.
By eventually empowering machines with a level of superintelligence, there are many different possible outcomes ranging from Kurzweil’s technological singularity to the more dire predictions popularized by Elon Musk.
Despite this wide gap in potential outcomes, most technologists do agree on one thing: AI will have a profound impact on the society and the way we do business.
THE ECONOMIC IMPACT OF AI
Today’s infographic comes from the Extraordinary Future 2017, a new conference in Vancouver, BC that focuses on emerging technologies such as AI, autonomous vehicles, fintech, and blockchain tech.
In the below infographic, we look recent projections from PwC and Accenture regarding AI’s economic impact, as well as the industries and countries that will be the most profoundly affected.


Jack Crooks tells us that if you must get anything right, get the US dollar right. Near term prepare for a weak CDN Dollar to 74 cents.
….also from Mike: Great Advice from Guests James Thorne & Paul Beattie

What is happening in the crude oil market is unprecedented. Commercial short positions have now reached unimaginable levels (see stunning chart below).

Meanwhile, Commercial Euro Shorts Hit All-Time Record! —–continue reading HERE
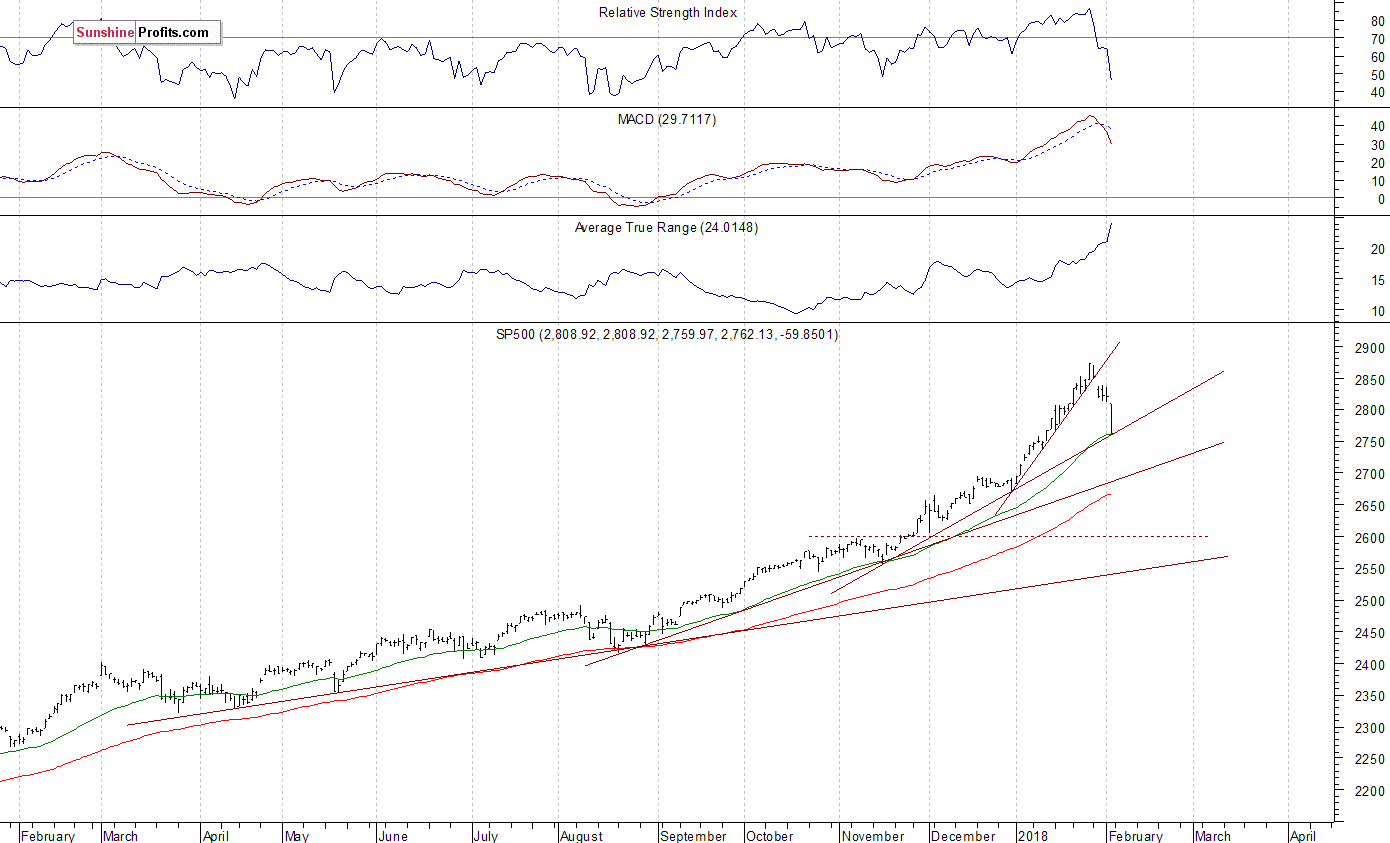
The main U.S. stock market indexes lost 2.0-2.5% on Friday, breaking below their three-day-long consolidation as investors reacted to quarterly corporate earnings, economic data releases, among others. The S&P 500 index accelerated its short-term downtrend following breakout below the level of 2,800. It currently trades 3.9% below its January 26 record high of 2,872.87. The broad stock market retraced more than 50% of its month-long rally off the December 29th local low at 2,673.61. The Dow Jones Industrial Average was relatively weaker, as it lost 2.5% on Friday, and the technology Nasdaq Composite fell 2.0%.
The nearest important level of support of the S&P 500 index is at around 2,750, marked by the January 11 daily gap up of 2,750.80-2,752.78. There is also an important Fibonacci retracement of 61.8% of the month-long rally at the level of 2,749.73. The next potential support level is at 2,720-2,740, marked by some previous consolidation. On the other hand, resistance level is now at 2,780-2,800, marked by previous level of support. The resistance level is also at around 2,835, marked by last week’s local highs.
There is a pretty big chance that the index reached some major medium-term high on Friday a week ago. It broke below its month-long upward trend line on Tuesday following gap-down opening of the trading session, confirming reversal of the uptrend. Will it retrace all of its January rally or even continue lower? The index is at its three-month-long upward trend line. For now, it looks like a downward correction:
Negative Expectations Again
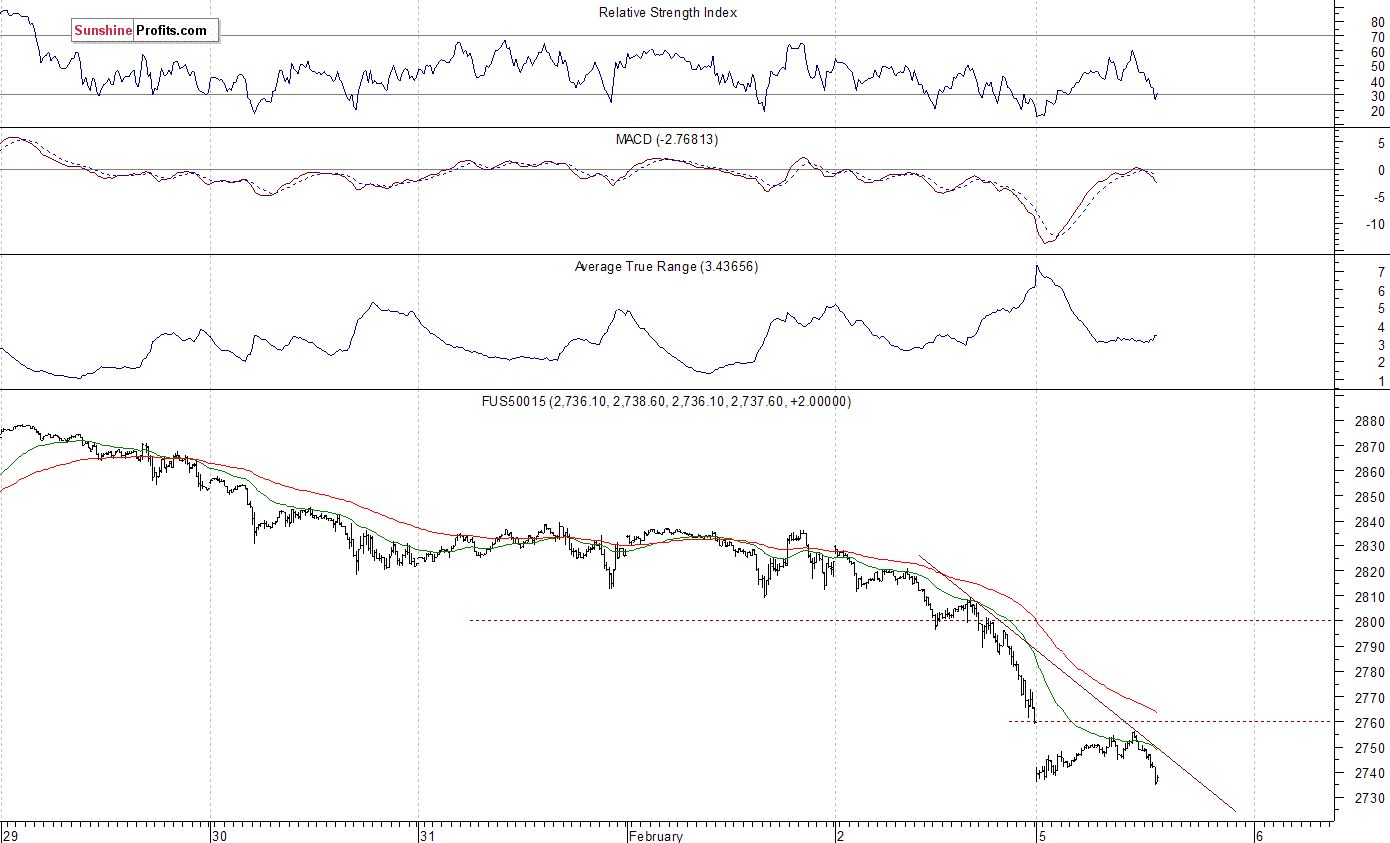
The index futures contracts trade 0.8-1.2% lower vs. their Friday’s closing prices this morning. So, investors’ expectations before the opening of today’s trading session are very negative again. The European stock market indexes have lost 1.0-1.4% so far. Investors will wait for the ISM Non-Manufacturing PMI number release at 10:00 a.m. The market expects that it was at 56.5 in January. However, this data release probably won’t affect the overall negative market sentiment today. Investors will also wait for more quarterly corporate earnings announcements.
The S&P 500 futures contract trades within an intraday consolidation, as it fluctuates following an overnight move down. The market remains close to its local lows, well below its Friday’s panic end-of day-lows. It continues its short-term downtrend, as it retraces more of January move up. The nearest important level of resistance is at around 2,760, marked by an overnight gap down and Friday’s daily low. The next level of resistance is at 2,780-2,800, among others. On the other hand, support level is at 2,730-2,740, marked by short-term local lows. The next level of support is at 2,700-2.720. The futures contract is well below its Friday’s session lows, as the 15-minute chart shows:
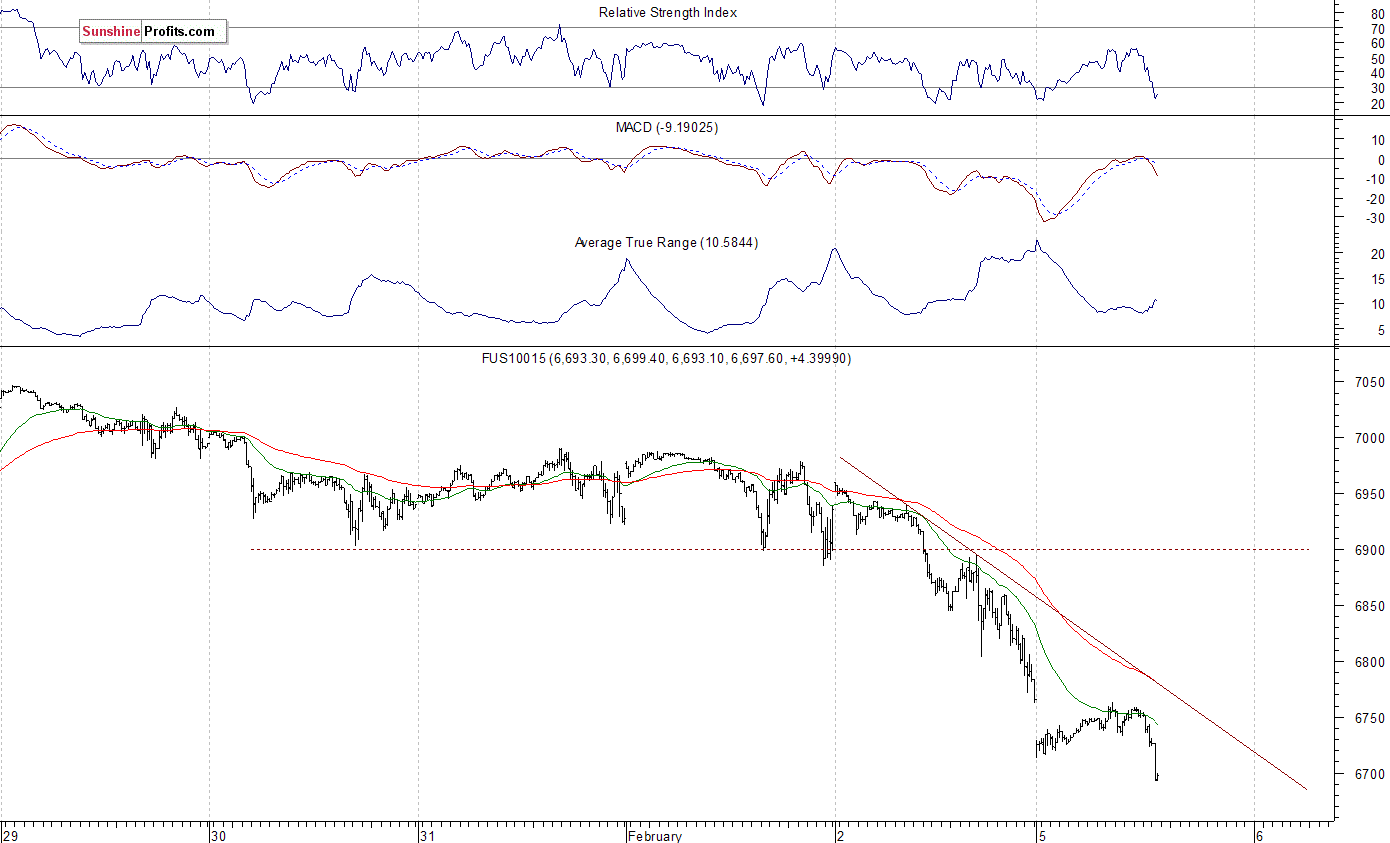
Nasdaq At New Lows
The technology Nasdaq 100 futures contract follows a similar path, as it continues its short-term downtrend today. It extends its Friday’s sell-off after an overnight gap-down opening. The nearest important level of resistance remains at around 6,750-6,760, and the next resistance level is at 6,800, among others. On the other hand, potential support level is at 6,680-6,700. The Nasdaq futures contract trades below its short-term downward trend line, as we can see on the 15-minute chart:
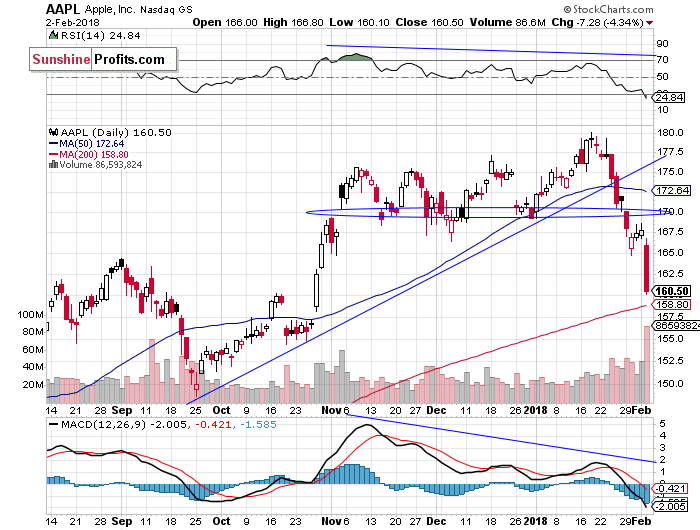
Let’s take a look at Apple, Inc. stock (AAPL) daily chart (chart courtesy of http://stockcharts.com) – worth mentioning because Apple’s market capitalization is around $850 billion, which is more than two times current value of all the cryptocurrencies combined. The stock reached new record high around three weeks ago, following short-term consolidation along the support level of $175. The market got closer to $180 mark, but it failed to continue higher. Consequently, the stock retraced its January advance and continued lower. It accelerated its decline on Friday, as it got closer to $160. We can see some short-term oversold conditions, but no confirmed positive signals so far:
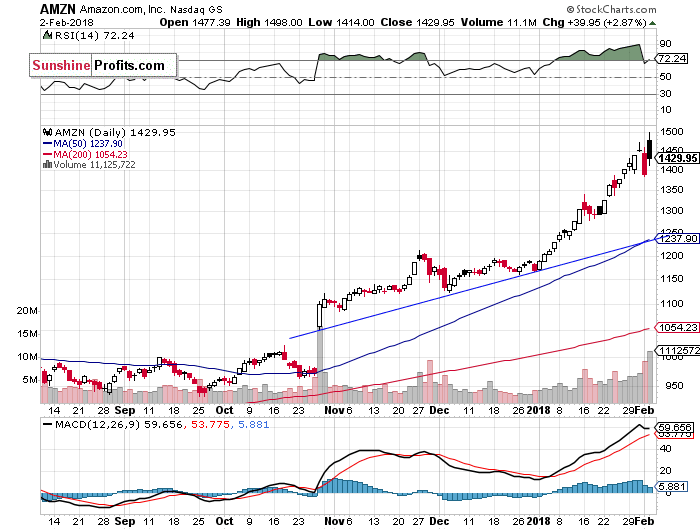
On the other hand, Amazon.com, Inc. stock (AMZN) was relatively strong vs. the broad stock market. Despite an overall weakness, it further extended its month-long rally recently. The stock even reached new record high on Friday, before closing slightly lower. It remained above the level of $1,400 following bouncing off $1,500 mark. The market may be trading within some medium-term topping pattern here:
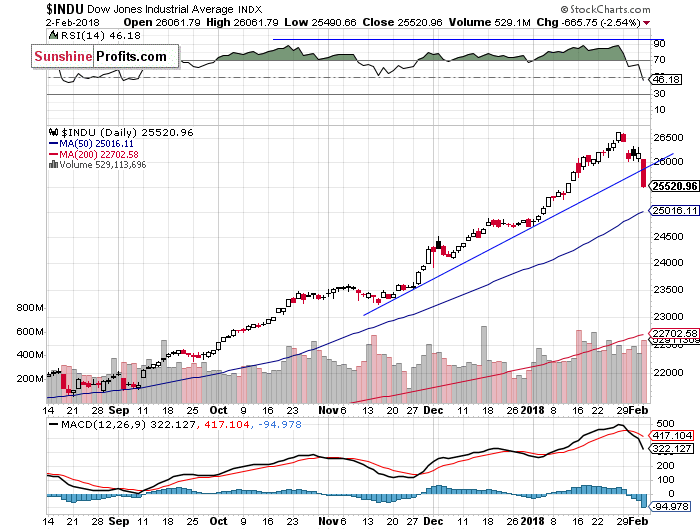
The Dow Jones Industrial Average daily chart shows that blue-chip index broke below its short-term consolidation on Friday. The price broke below the level of 26,000 and continued lower. We still can see medium-term negative technical divergences – the most common divergences are between asset’s price and some indicator based on it (for instance the index and RSI based on the index). In this case, the divergence occurs when price forms a higher high and the indicator forms a lower high. It shows us that even though price reaches new highs, the fuel for the uptrend starts running low.
The DJIA broke below its three-month-long upward trend line. Is this a new downtrend or still just correction? For now, it looks like a downward correction, because it retraces relatively small amount of its months-long rally:
Concluding, the S&P 500 index sold off on Friday, as it lost more than 2% following breakout below its three-day-long consolidation and the support level of 2,800. The broad stock market continued its short-term downtrend after some important economic data, quarterly earnings releases. Investors took profits off the table following the unprecedented month-long rally. Is this a new downtrend or just downward correction? For now, it looks like a quick correction, but a little more downside and we may see some panic in the stock market. Friday’s sell-off sets the tone for weeks to come – new record highs seem like some very unlikely scenario now.
The S&P 500 index traded around 7.5% above its December 29 yearly closing price on Friday January 26. This almost month-long rally seems unprecedented. The legendary investor John Templeton once said that “bull markets are born on pessimism, grow on skepticism, mature on optimism and die on euphoria”. So, was this an euphoria phase of the nine-year-long bull market? It’s hard to say, but some major downside risks are growing.
We still can see some medium-term overbought conditions. We can use indicators such as Relative Strength Index (RSI), Stochastic Oscillator, Money Flow Index to identify overbought conditions. For example, one can view a given market as “overbought” if the RSI indicator for this market is above 70. Paying attention to the overbought/oversold status of the market is very useful, but there are many other factors that need to be considered before placing a trade.
If you enjoyed the above analysis and would like to receive free follow-ups, we encourage you to sign up for our daily newsletter – it’s free and if you don’t like it, you can unsubscribe with just 2 clicks. If you sign up today, you’ll also get 7 days of free access to our premium daily Gold & Silver Trading Alerts. Sign up now.
Thank you.
Paul Rejczak
Stock Trading Strategist

Pay close attention to where commodities are relative to equities right now. Compared to the S&P 500 Index, materials are extremely undervalued, the most since at least 1970. This makes now a very attractive entry point—or as natural resource investors Goehring & Rozencwajg Associates writes in its quarterly report, there could be “a proverbial fortune to be made” if investors take advantage of this once-in-a-generation opportunity.
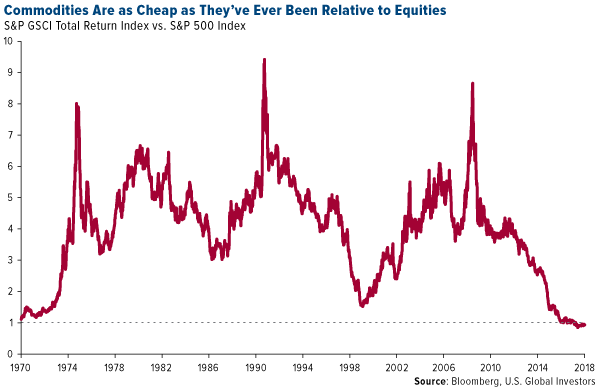
“When commodities are this cheap relative to stocks, the returns accruing to commodity investors have been spectacular,” the firm continues:
For example, had an investor bought the Goldman Sachs Commodity Index (or something equivalent) in 1970, by 1974 he would have compounded his money at 50 percent per year. From 1970 to 1980, commodities compounded annually in price by 20 percent. If that same investor had bought commodities in 2000, he would have also compounded his money at 20 percent for the next 10 years.
Past performance doesn’t guarantee future results, of course, but the implications here are very compelling if mean reversion takes place. There have been few times that I can remember when an asset class looked as favorable as commodities do now. If you agree, it might be time to consider adding exposure to materials, energy and mining to your portfolio.
Oil Just Had Its Best January Since 2006—Further Gains Ahead?
Energy in particular looks very attractive. West Texas Intermediate (WTI) crude oil, the American benchmark, logged its best January since 2006, gaining more than 7 percent on scorching hot demand, sustained production cuts by the Organization of Petroleum Exporting Countries (OPEC), deteriorating output from Venezuela and a record-setting stockpile drawdown. U.S. oil inventories declined for 10 straight weeks as of January 24, the longest stretch ever recorded, before jumping again in the week ended January 31.
What’s more, the U.S. Energy Information Administration (EIA) just reported that, thanks to the revitalized shale revolution, the U.S. produced over 10 million barrels of oil per day in November, the first time it’s done so since 1970. This puts the country on a path to catch up with and possibly exceed Russia, which produced an average 11 million barrels a day in 2017, and world leader Saudi Arabia, whose energy behemoth Saudi Aramco produces around 12.5 million barrels a day.
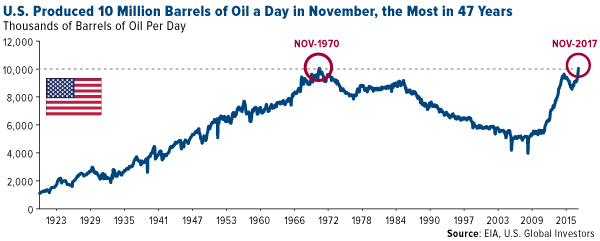
As I’ve written many times before, the American fracking industry is largely responsible for keeping global oil prices low, which has been a huge windfall to the world economy. In its coverage of the news that U.S. output topped 10 million barrels, the Financial Times put it best, writing that American frackers have “boosted the U.S. economy, creating tens of thousands of jobs, bolstered its energy security, created new international relationships and given Washington new freedom to use sanctions as a tool for strategic influence.”
But shouldn’t all this extra supply halt the oil rally and put a damper on producer and explorer stocks? Not so fast.
Companies Just as Profitable with $65 Oil as They Were with $100 Oil
In the years since oil prices cratered—and subsequently began to rise—energy companies have become much more efficient and have learned to do more with less. As the Financial Times notes, U.S. frackers are producing what they are today while employing only three quarters of the workforce they had in the days of $100-a-barrel oil. ExxonMobil, the largest American producer, is in expansion mode, with plans to ramp up its shale mining in the Permian Basin to 500,000 barrels a day by 2025.
It’s not just American companies that have grown lean and mean in this climate of lower oil prices. Says the chief financial officer of Royal Dutch Shell: “We are able to do the same for less.”
Europe’s largest producer this week reported that profits tripled in 2017, generating nearly as much cash flow as when oil prices hovered around $100.
According to the Wall Street Journal, the company has “fundamentally revamped the way it designs and executes projects and is working to deliver another $9 billion to $10 billion of savings in the coming years” through restructuring and by paying down loads of debt.
As a result, Shell has rewarded its shareholders well, delivering a dividend yield of nearly 6 percent, among the highest in the entire industry.
These rewards could continue, as Goldman Sachs now sees Brent jumping to $82.50 within the next six months, up from just under $70 today. Hedge funds’ net long position on Brent hit an all-time high of more than 584,000 contracts last week, according to ICE Futures Europe and reported by Bloomberg. WTI net long positions also surged, according to the U.S. Commodity Futures Trading Commission, to nearly 500,000 contracts, the most since 2006.
To learn more about energy and commodities, click here!

-
I know Mike is a very solid investor and respect his opinions very much. So if he says pay attention to this or that - I will.
~ Dale G.
-
I've started managing my own investments so view Michael's site as a one-stop shop from which to get information and perspectives.
~ Dave E.
-
Michael offers easy reading, honest, common sense information that anyone can use in a practical manner.
~ der_al.
-
A sane voice in a scrambled investment world.
~ Ed R.
Inside Edge Pro Contributors

Greg Weldon

Josef Schachter

Tyler Bollhorn

Ryan Irvine

Paul Beattie

Martin Straith

Patrick Ceresna

Mark Leibovit

James Thorne

Victor Adair