Stocks & Equities

Buying Opportunity in Stocks

This video explores the possibility that stocks are currently giving us a brief pull back before the next powerfully rising intermediate cycle begins.

https://blog.smartmoneytrackerpremium.com/

Screen Shot 2018-01-31 at 6.10.22 AM

What Could Possibly Go Wrong?

Bear-Possibly-Go-Wrong

What goes up, eventually comes down.

That is just reality.

The bull market that began in 2009, has now entered the final stage of “capitulation” as investors throw caution to the wind and charge headlong into the markets with reckless regard for the consequences.

Of course, it isn’t surprising given the massive amounts of liquidity continually injected into the financial markets and global Central Banks have now figured out that continually rising financial markets solve much of the world’s ills. Simply, with enough liquidity, you can cover up bad (credit risks) by guaranteeing holders they will never default.

It’s genius.  It’s a “no lose” investment scheme.

Unfortunately, we have seen this repeatedly in the past.

In the 1980’s it was “Portfolio Insurance” – a “no lose” investment program that eventually erupted into the crash of 1987. But not before the market went into a parabolic advance first.

In the 1990’s – it was the dot.com phenomenon which was “obviously” a “no lose” proposition. Even after Alan Greenspan spoke of “irrational exuberance,” two years later the market went parabolic once again.

Then in 2006-2007, banks invented the CDO-squared, a collateralized derivative obligation based on other collateralized derivative obligations. It was a genius way to invest with “no risk” because the real estate market had never crashed in history.

Today, it is once again an absolute “certainty” that markets will rise from here as global Central Banks have it all under control.

What possibly could go wrong?

Here is your weekend reading list.


Economy & Fed


Markets

  • 5-Scenarios That Could Crash The Market by Tyler Durden via ZeroHedge
  • The Real Source Of The Meltup by Brian Maher via The Daily Reckoning
  • Investing Environment Has Been Perfect, But Could End Soon by James Mackintosh via WSJ
  • BofA Warns Of Frothy Market by Mark DeCambre via MarketWatch
  • Is This The Most Sustainable Bubble Ever? by Simon Maierhofer via MarketWatch
  • Is Anyone Paying Attention by Sven Henrich via Northman Trader
  • Davos: Should You Unload Your Stocks by Shawn Langlois via MarketWatch
  • Are You Ready For The Next Market Melt-DOWN by Michael Kahn via Barron’s
  • Dalio: First Comes The Boom, Then The Bust by Edward Harrison via Credit Writedowns
  • Gauging Contemporary Bubbles by Chris Hamilton via Economica Blog
  • Are Stocks Headed For A Nasty Surprise by Anora Gaudiano via MarketWatch
  • Yusko’s 10-Surprises For 2018 by Robert Heubscher via Advisor Perspectives
  • A Market Valuation That Defies Comparison by Michael Lebowitz via RIA
  • It’s More Than A Matter Of Trust by Doug Kass via RIACryptocurrency Mania
  • Beyond The Bitcoin Bubble by Steven Johnson via NYT
  • Coinbase Is Teaming Up To Unleash Crypto On WallStreet by Frank Chaparro via BI
  • IRS Fears Bitcoin Could Starve Government by Holden & Malani via NYT
  • How To Value Cryptocurrencies by John Biggs via Tech Crunch

  • Research / Interesting Reads

  • Why The Next Downturn Won’t Be Like 2008 by Wolf Richter via Wolf Street
  • The Bubble That Could Break The World by James Rickards via The Daily Reckoning
  • The Possibilities Are Frightening by Kevin Muir via The Macro Tourist
  • The Financial Road Map For 2018 by Nomi Prins via The Daily Reckoning
  • Barron’s Roundtable: Bright Outlook For Economy & Stocks by Lauren Rublin via Barron’s
  • Marks: Future Returns Are Low For Every Asset Class by Tyler Durden via ZeroHedge
  • Rising Markets Not Bullish For Everyone by Steven Rattner via NYT
  • Why CAPE Naysayers Are Wrong by Rob Arnott via Research Affiliates
  • The Trendiest Rally In U.S. History by Dana Lyons via The Lyons Share
  • This Market Is Literally Off The Chart by Jesse Felder via The Felder Report

  • “Strategy without tactics is the longest path to victory; tactics without strategy is the noise before defeat.” – Sun Tzu, The Art of War

    Questions, comments, suggestions – please //lance@realinvestmentadvice.com/” target=”_blank” rel=”noopener noreferrer”>email me.


    Lance Roberts

    lance_sig

    Lance Roberts is a Chief Portfolio Strategist/Economist for Clarity Financial. He is also the host of “The Lance Roberts Show” and Chief Editor of the “Real Investment Advice” website and author of “Real Investment Daily” blog and “Real Investment Report“. Follow Lance on FacebookTwitter and Linked-In

    WORLD’S LARGEST SILVER MINES: Suffer Falling Ore Grades & Rising Costs

    Worlds-Largest-Silver-Mines-Falling-Ore-Grade-Rising-Costs-FIMAGEThe world’s two largest silver mines have seen their productivity decline substantially due to falling ore grades and rising costs.  Gone are the days when silver mines could produce silver at 15-20 ounces per ton.  Today, the Primary Silver Mining Industry is likely producing silver at an average yield of 4-5 ounces per ton.

    In my newest video, I discuss the changes that have taken place in the world’s two largest silver mines, the Cannington Mine in Australia and the Fresnillo Mine in Mexico.  Falling ore grades and rising energy costs have contributed to the doubling and tripling of production costs at many silver mining companies.  Investors who believe it still only costs $5 an ounce to produce silver, as it did in 1999, fail to grasp what is taking place in the silver mining industry:

    A big problem that has confused investors is the reporting of the “CASH COST” metric by the mining industry.  Some silver mining companies can brag that they have a very low cast cost of $5 an ounce, but they arrive at that figure by deducting their “by-product credits.”  By-product credits are the revenues they receive from producing copper, zinc, lead, and gold along with their silver.

    For example, Hecla Mining stated their silver cash cost of $0.16 per ounce for the first three-quarters of 2017.  They were able to report that very low $0.16 cash cost by deducting $175 million of their zinc, lead and gold revenues.  Hecla’s three silver mines had total revenues of $278 million, but they deducted $175 million in by-product credits to get the low $0.16 cash cost.  They deducted 63% of their revenues to arrive at that low meaningless cash cost.

    According to Hecla’s financial statements, they only made $4.2 million in net income on a total of $417 million in total revenues Q1-Q3 2017 (including $140 million from their Casa Berardi Gold Mine).  Thus, their net income profit was only 1% of their total revenues. How bad would Hecla’s losses have been if they deducted $175 million of their supposed by-product metals’ revenue from their bottom line?  How about a loss of $171 million?  So, please disregard the Cash Cost metric as it is totally meaningless.  Cash cost accounting does nothing to determine the profitability of a mining company.

    As the silver mining industry continues to suffer from falling ore grades, costs will only increase going forward.  However, the biggest impact on the silver mining industry will be the decline in global oil production.  In my next video, I will do an update on the worsening U.S. Shale Oil Industry, even though production continues to increase.

    What Do Quincy Jones, Serena Williams and Blockchain Have in Common?Fr

    COMM-cryptocurrencies-01262018

    Two big themes last week at Inside ETFs, the Comic-Con of exchange-traded funds attended by more than 2,300 advisors and investors, were innovation and disruption. Like all other industries, the investing world has seen its fair share of disruption in the past quarter-century—think indexing, passive investing, the rise of robo-allocation and now blockchain and cryptocurrencies. This year marks the 25th anniversary of the first ever ETF, and today total ETF assets top $3 trillion. That’s a far cry from the estimated $40 trillion sitting in mutual funds worldwide, but exchange-traded funds are rapidly catching up as investors seek cheaper, more innovative and tax-efficient instruments.

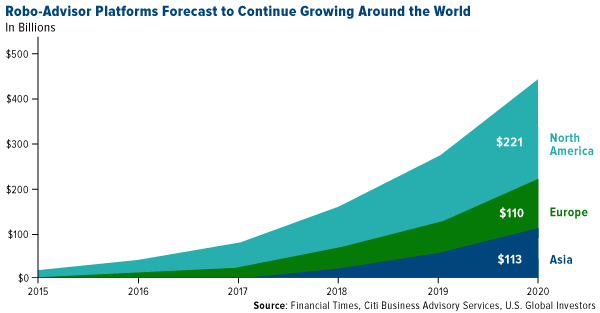
    Consider robo-advisors, which emerged only 10 years ago. Who would have thought in the mid-2000s that so many investors would be comfortable enough with the idea of a machine managing their money? And yet here we are. By 2020, Citi analysts predict, assets controlled by robo-advisors could reach close to $450 billion globally.

    Robo advisor  platforms forecast to continue growing around the world click to enlarge

    Disruption was definitely top of mind during many of the presentations and interviews at Inside ETFs, including that of producer and composer Quincy Jones, who was at the conference to promote a new stock index that tracks music and entertainment companies. “Q” is the very definition of a legend, having been at the center of some of the most influential musicians, actors, and artists over the course of his long career. With a record 79 Grammy Award nominations to his name, he’s made an indelible impression on the music, television, and film we all consume and enjoy, whether we’re aware of it or not.

    When CNBC’s Bob Pisani asked Jones if he was ready for the day when robots write and perform music, the 84-year-old Jones said, “You can’t stop the technology,” adding that he was among the earliest experimenters of synthesizers. (Anyone remember the synthy theme song to the old 1960s-1970s detective show, Ironside? That was composed by Quincy Jones.)

    “You got to always stay curious. You got to be willing to take a chance,” he said.

    Tennis star Serena Williams being interviewed by Barry Ritholtz at Inside ETFs 2018

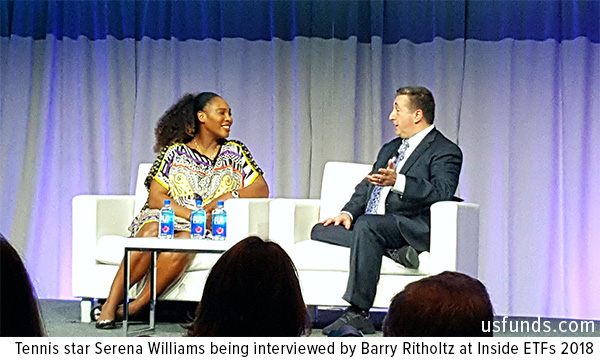
    A similar forward-thinking attitude was expressed by Serena Williams, who was also in attendance. The tennis virtuoso and four-time Olympic gold medal winner, who bagged her 23rd Grand Slam last year while pregnant, is a savvy businesswoman in her own right, sitting on the board of online survey firm SurveyMonkey and Oath, a subsidiary of Verizon that controls a number of media outlets such as HuffPost, Yahoo and Tumblr.

    When asked why she was drawn to tech firms in particular—her husband Alexis Ohanian co-founded Reddit—Williams said, “This is a new time, and I don’t want to be left behind.”

    I couldn’t agree more with Jones and Williams.

    Embracing Disruption with HIVE Blockchain Technologies

    Curiosity and a willingness to embrace change and innovation are what led me to invest in HIVE Blockchain Technologies and agree to become its chairman last year. As many of you know, HIVE is the first publicly-traded company engaged in the mining of virgin digital currencies, including bitcoin, Ethereum, Litecoin, Dash, Monero and many more.

    I’m thrilled to be at the forefront of this new technology that’s already disrupting our industry and reshaping how transactions are made and companies raise funds across the globe. The year 2017 was the real catalyst, bringing cryptocurrencies into mainstream conversations as bitcoin hit an all-time high of nearly $20,000 apiece in mid-December.

    Total crypto market cap briefly cracked $830 billion earlier this month yet has since receded to around $540 billion, with strong pressure being exerted by the global equities bull market. A record $33.2 billion flowed into stocks in the week ended January 24, according to investments data provider EPFR Global. U.S. stocks alone attracted $7 billion, while emerging markets saw inflows reach $8.1 billion, the second-highest amount recorded in a week.

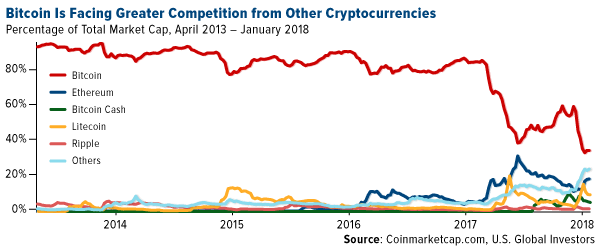
    Competition among digital currencies is also heating up. Although bitcoin remains the top dog, it faces tough competition from the likes of Ethereum, Litecoin, Ripple and the other nearly-1,500 coins on the market today. It now accounts for about 40 percent of the entire market, down from almost 100 percent just a few years ago.

    Bitcoin is facing gretaer competition from other cryptocurrencies
    click to enlarge

    What’s important to remember is that digital currencies are, at the moment, highly volatile and speculative. Unlike gold and other hard assets, they haven’t been tested in all economic backdrops. Bitcoin was created only in 2009, after the worst months of the financial crisis, and it’s existed mainly in an environment of rising equity prices and gradually improving economic conditions. How investors might use it in the next recession or major market correction is unknown at this point.

    Coinbase Generated $1 Billion in Sales Last Year

    Having said that, the crypto space is rapidly maturing in a number of different ways. Every day, more and more businesses accept the currency as a form of payment. Investors can now buy bitcoin futures. Fidelity and USAA both allow account holders to monitor their cryptocurrency holdings. Blockchain ETFs are appearing on the market—though a couple of proposed bitcoin ETFs have hit roadblocks getting approval from the Securities and Exchange Commission (SEC). And I overheard at the Canaccord Genuity Blockchain Conference in Toronto last week that as many as 10,000 millionaires have been created from Ethereum.

    Last year, the cryptocurrency trading platform Coinbase booked $1 billion in revenue, almost double what company executives had expected for 2017. Founded only six years ago and boasting more than 13.5 million accounts, Coinbase has recently closed the door on any additional venture capital, leaving investors to hope for an initial public offering (IPO) sometime in the near future.

    Coinbase is about to face some serious competition, though, as smartphone-only trading app Robinhood will begin allowing customers to trade bitcoin and Ethereum next month—all commission-free.

    World Gold Council: Cryptocurrencies Are No Substitute for Gold

    Several attendees at Inside ETFs and the blockchain conference raised concerns that cryptocurrencies are on a path to replace gold as a safe haven investment. I’ve mentioned multiple times before that I do not see this to be the case, for a number of reasons. Unlike bitcoin, gold has thousands of years’ worth of history to justify its role as a currency and store of value. Central banks own gold, as do institutional and retail investors. It’s widely used not just as money but also as jewelry and in dentistry and electronics. The metal, in fact, can be found in the very computer hardware used to mine bitcoin.

    Now, in a new report, the World Gold Council (WGC) takes the position that, while cryptocurrencies and blockchain technology are attractive, they simply don’t and can’t usurp gold’s place in investors’ portfolios.

    What’s more, “there isn’t any quantifiable evidence that gold holdings are directly suffering from competition from cryptocurrencies,” the WGC writes.

    Tennis star Serena Williams being interviewed by Barry Ritholtz at Inside ETFs 2018

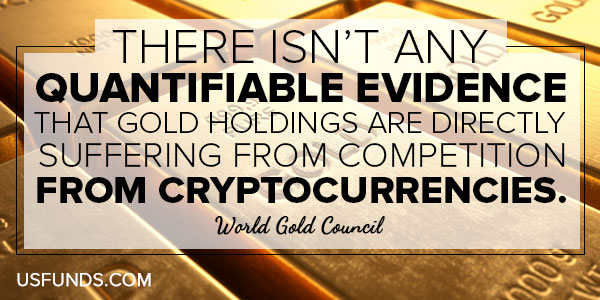
    Need proof? According to the group, bitcoin currently trades around $2 billion a day on average. That’s less than 1 percent of the $250 billion in gold bullion that’s traded every day. Remember, gold is one of the most liquid currencies in the world, with a highly developed and accepted market structure.

    There are several other important differences between the two asset classes, and I highly recommend you read the full report. You can do so by clicking here.

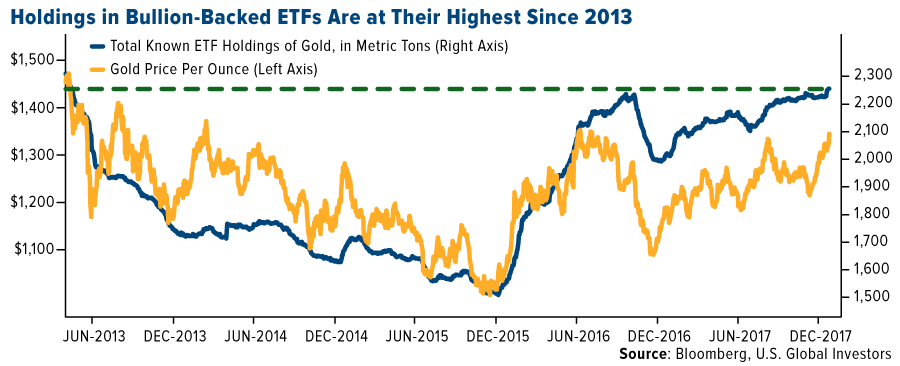
    Investors Pile into Gold-Backed ETFs Ahead of Potential Jump in Inflation

    Coming back full circle to ETFs, Bloomberg reported last week that holdings in gold bullion-backed funds rose to their highest level since 2013 on a weaker U.S. dollar, rising geopolitical risk and growing expectations that inflation could finally heat up in 2018.

    Holdings climbed to 2,250 metric tons earlier last week, the highest amount since May 2013, when gold prices were still in the $1,400 to $1,500-an-ounce range.

    Holdings in bullion backed ETFs are at their highest since 2013
    click to enlarge

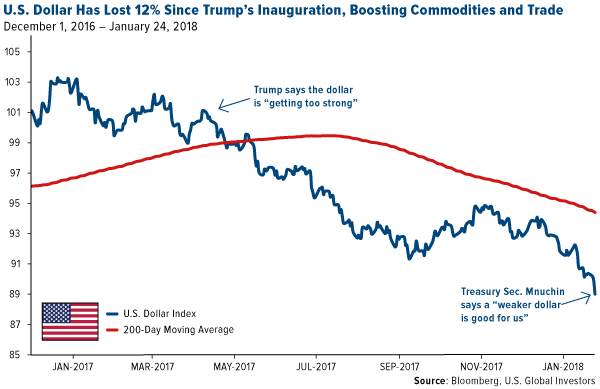
    The U.S. dollar has plunged in value for the past several weeks, dipping more than 1 percent last Wednesday alone—the biggest one-day pullback in 10 months—following Treasury Secretary Steven Mnuchin’s comment at the World Economic Forum in Davos, Switzerland, that a weaker buck “is good for us as it’s related to trade and opportunities.” The greenback similarly tanked back in April 2017 when President Donald Trump said the dollar is “getting too strong.” Soon after, it fell below its 200-day moving average.

    US dollar has lost 12 percent since Trumps inaug
    click to enlarge

    Last Thursday, however, Trump walked back Mnuchin’s (and his own) comment, telling CNBC that the dollar “is going to get stronger and stronger, and ultimately I want to see a strong dollar.”

    In any case, this has all been constructive for the price of gold, which Thomson Reuters GFMS now sees hitting $1,500 an ounce this year. If you remember, $1,500 was approximately my estimate after analyzing gold’s performance in the months following the December rate hikes in 2015 and 2016.

    According to Thomson Reuters, the price appreciation could be driven by “concerns that the United States may pull out of NAFTA.”

    Doing so, of course, would be highly inflationary—and inflation, as I point out in last week’s episode of Frank Talk Live, has historically been a tailwind for gold. The tax overhaul is already helping to boost wages at Walmart, Starbucks and elsewhere, and the U.S. recently slapped fresh tariffs on imported washing machines and solar cells. In response, South Korea opened two cases against the U.S. at the World Trade Organization (WTO).

    And let’s not discount geopolitical noise. Last week, the “Doomsday Clock” was moved 30 seconds closer to midnight and now stands only two minutes away. That’s the closest to midnight the symbolic barometer has come since 1953, when both the U.S. and Russia first began testing thermonuclear weapons—among the most disruptive advancements of the past 100 years.

    Curious to learn more about what’s driving gold? Click here!

    All opinions expressed and data provided are subject to change without notice. Some of these opinions may not be appropriate to every investor. By clicking the link(s) above, you will be directed to a third-party website(s). U.S. Global Investors does not endorse all information supplied by this/these website(s) and is not responsible for its/their content.

    Frank Holmes has been appointed non-executive chairman of the Board of Directors of HIVE Blockchain Technologies. Both Mr. Holmes and U.S. Global Investors own shares of HIVE, directly and indirectly.

    The U.S. Dollar Index (USDX, DXY) is an index (or measure) of the value of the United States dollar relative to a basket of foreign currencies, often referred to as a basket of U.S. trade partners’ currencies.

    Holdings may change daily. Holdings are reported as of the most recent quarter-end. None of the securities mentioned in the article were held by any accounts managed by U.S. Global Investors as of 12/31/2017.

    Does Size Matter? – Strategy of the Week

    Screen Shot 2017-09-19 at 2.00.45 PM

    perspectives commentary

    In this week’s issue: 

    • Stockscores’ Market Minutes Video – The Morning Stair Master
    • Stockscores Trader Training – Does Size Matter?
    • Stock Features of the Week – Profiting from a Correction

    Stockscores Market Minutes – The Morning Stair Master

    Stocks are making most of their move in the opening hour and then going sideways for the rest of the day. There are some situations where stocks will trend all day long. I discuss this, my market analysis and the day trade of the week on PFE in this week’s Market Minutes.

    Click here to watch.

    To get instant updates when I upload a new video, subscribe to the Stockscores YouTube Channel

    Trader Training – Does Size Matter?

    Investors often group stocks by their market capitalization, the total value of the company based on the price of their shares multiplied by the number of shares outstanding. Microcap stocks might have 20,000,000 shares out with a price of $0.50 – these tend to dominate the TSX Venture Exchange. A company with a few hundred million is more of a real business but still considered a small company compared to the large cap stocks that dominate the major market indexes, each valued at many billions of dollars. Apple, currently the largest company listed in North America, has a market cap of $865 Billion.

    There are significant differences in how stocks small cap stocks trade compared to large caps. It is important to understand these differences so you can approach trading them in the right way. Here are some things to consider:

    Liquidity – liquidity is a measure of how actively a stock trades and how smooth the price movements are for a stock. Generally, large cap stocks are more actively traded and make less volatile changes in price. Small cap stocks don’t have as many investors which makes them subject to a higher level of price volatility. This means that the reduced liquidity of small cap stocks makes them riskier. A stock that does not trade actively can make big price swings because of the actions of one large investor.

    From a practical standpoint, this means you can suffer a bigger loss than you plan for in your risk management. You may plan to exit a trade if the stock hits your stop loss point at $5. However, if the stock is not very liquid and many investors try to exit at the same time, you could end up getting out at a much lower price than what you had planned for.

    Correlation – every stock has some correlation to what the overall market is doing. If the general market is going up in value, most stocks will also go up. Large cap stocks tend to be more closely correlated to the market index. If you look at a chart comparing Microsoft (MSFT) with the Nasdaq 100 (QQQ) you will find that they move all most exactly the same way.

    This makes it important to analyze the market index as well as the stock when considering the purchase of large cap stocks. Even if the large company you are considering is doing great things in its business, it may not perform well if the overall market heads lower.

    This also means that large cap stocks can outperform small cap stocks when the overall market is strong. We have seen this over the past year; small cap stocks have been flat while the large cap stocks have moved in a strong upward trend with the overall market.

    If the overall market breaks its long term upward trend, we may see money look for market beating returns in small cap stocks because this group is not so closely correlated to what the overall market is doing.

    Performance – small cap stocks have a greater capacity for percentage return, up or down. Smaller companies tend to have a less diverse business which means they can go up or down rapidly based on the performance of their products or services. Consider how a company making a smart watch would do if it was successful. For a company like Apple, the launch of a smart watch might bring in a few billion dollars in sales but that, in the context of their overall business, will not have a huge impact on earnings. If a small cap company had the same success with the same product (and it was their only product), the effect on their stock price would be massive.

    Of course, the failure of a business can also have a huge effect on share price. We often see small cap biotech stocks suffer painful and sudden sell offs when a drug that they are developing fails to get approval.

    This defines the risk reward trade off that comes with selecting between market caps when investing. Large stocks have a hard time significantly beating the overall market. Small caps can achieve this but they can also suffer significant losses. With smaller cap stocks, risk management is more important.

    Yield – many investors like stocks that pay a dividend since they rely on their portfolio for income. Most small cap stocks are working to grow earnings and use their capital to reinvest in their business. Once companies get large, they begin to return their earnings to shareholders as dividends. If you want to collect dividends, you will generally focus on larger cap stocks.

    Fun – historically, I have found that trading smaller cap stocks is more fun. It is enjoyable to buy a stock at $5 and watch it go to $10 in a few days. That can happen with small cap stocks, it is rare with large cap.

    Of course, making good returns is always going to be fun and you ultimately have to go to where the trend is strong. Large cap stocks have been in an upward trend for a number of years making it likely that any investor in boring, large cap stocks has felt pretty good watching them go up, even it has been slow and steady.

    Stock Features of the Week – Fear Rising

    In this week’s Market Minutes video, I highlight the optimism building in the chart for the VXX. That means there is a slow growth in fear and the expectation for a near term pullback in the market. A good way to profit from a correction is by trading the VXX or some of the similar ETNs like UVXY or TVIX.

    It is important to recognize that the charts for the major market indexes have not broken down yet and they remain in strong upward trends. However, the chart of the VXX is giving a short term buy signal that we should not ignore for an early signal that weakness may be coming.

    1. VXX
    Break up from a rising bottom for the VXX, breaking its downward trend line. Support at $27.50.

    Screen Shot 2018-01-30 at 6.26.53 AM

    If you wish to unsubscribe from the Stockscores Foundation newsletter or change the format of email you are receiving please login to your Stockscores account. Copyright Stockscores Analytics Corp.

    References


    Disclaimer
    This is not an investment advisory, and should not be used to make investment decisions. Information in Stockscores Foundation is often opinionated and should be considered for information purposes only. No stock exchange anywhere has approved or disapproved of the information contained herein. There is no express or implied solicitation to buy or sell securities. The writers and editors of this newsletter may have positions in the stocks discussed above and may trade in the stocks mentioned. Don’t consider buying or selling any stock without conducting your own due diligence.