
Energy & Commodities
 Last week the U.S. Global Investors office was visited by a living legend in the junior mining industry, billionaire founder and executive chairman of Ivanhoe Mines, Robert Friedland. In case you don’t know, back in the mid-1970s, Robert was caretaker of an apple orchard south of Portland that one of his buddies from Reed College would often visit. That buddy’s name was Steve Jobs, who later went on to found a little company he named—what else?—Apple.
Before Robert and Steve Jobs began palling around, Jobs was known as shy and withdrawn. It was Robert who taught him his skills in what’s been described by many as “reality distortion.” Having seen numerous speeches by Robert over the years, I can attest to his masterful ability to utterly command a room of hundreds with his electric charisma. Some of that charisma must have rubbed off on Jobs, helping the future iPhone innovator evolve into the shrewd, larger-than-life business leader he’s celebrated as today.
Robert’s “reality distortion” was on full display during his visit. I was pleased and honored, as were my U.S. Global team members, to have the opportunity to hear his unique insights on a wide range of issues, from the debilitating smog in Delhi, India; to China’s efforts to become the world’s leading electric vehicle (EV) economy; to Ivanhoe’s development of the Kamoa-Kakula Copper Project in the Democratic Republic of Congo, independently ranked as the largest high-grade copper discovery in the world.
Robert made a very compelling case for Kamoa-Kakula, which he calls “the most disruptive Tier One copper project in the world today.” In its first year of production, its average copper grade is estimated to average an ultra-high 7.3 percent. Because the site is flat and uninhabited, and wages are paid in local currency, the cash cost for the life of the mine is projected to be a low, low $0.64 per pound of copper. As of my writing this, copper is priced at $3.20 a pound, so the margin is significant. After an initial $1.2 billion in capital costs to develop the project, the company expects a payback period of only 3.1 years.
It’s all a very attractive proposition.
Robert Friedland: You’re Going to Need a Telescope
I reminded Robert that we’re bullish on both copper and the industries it supports, including the imminent EV revolution and massive electricity demand in emerging markets, especially China and India. EVs, as I’ve pointed out before, require three to four times as much copper as traditional gas-powered vehicles. By 2027, as much as 1.74 million metric tons of copper will be needed to meet EV demand alone, up from only 185,000 tons today, according to the International Copper Association.
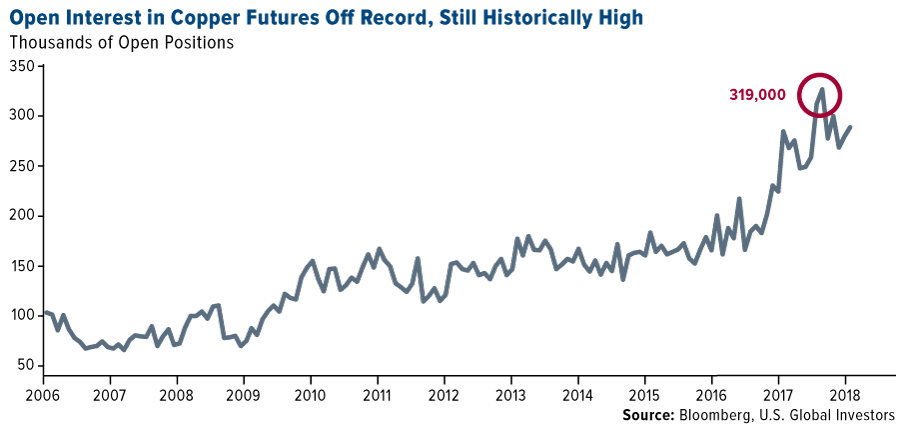
The red metal was one of the best performing commodities last year, surging more than 30 percent, and with investment demand near all-time highs, I predict another year of phenomenal returns. That would represent a third straight year of positive gains, something copper hasn’t accomplished this decade.
As you can see below, open interest in copper futures on the Chicago Mercantile Exchange (CME) is still historically high, even after cooling somewhat from its all-time high set in late July, when contracts hit an average 319,000 contracts. Open positions last month averaged more than 285,000, up 7.3 percent from the previous month and 26.9 percent from December 2016.
Robert expressed confidence that copper—along with aluminum, cobalt, nickel, platinum and scandium—will be among the biggest beneficiaries of the global transition to EVs and clean energy.
“You’re going to need a telescope to see copper prices in 2021,” he told us theatrically.
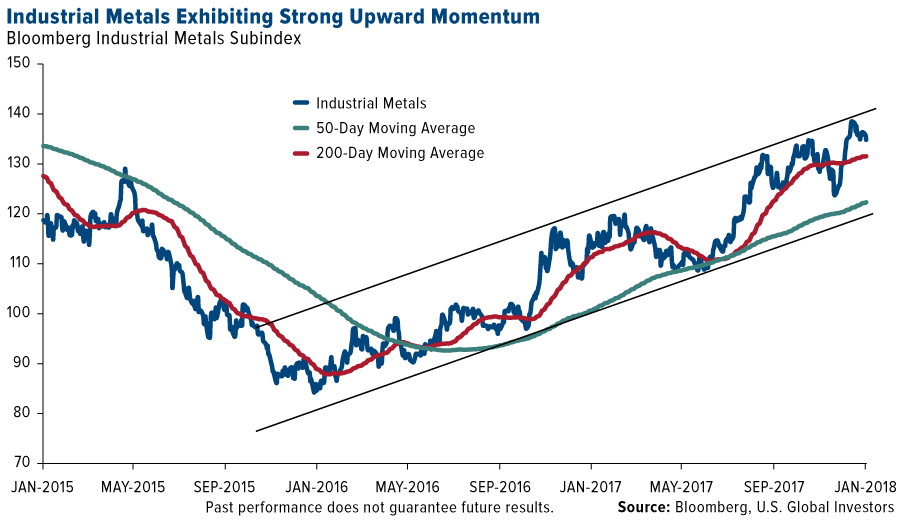
A rally is already in the works. From its recent low two years ago this month, the Bloomberg Industrial Metals Subindex, which tracks aluminum, copper, nickel and zinc, has surged more than 65 percent. Support looks strong, and copper prices could be headed even higher on global supply disruptions, as labor negotiations continue in Chile, the world’s top producer of the red metal.
“There are between 20 and 25 collective negotiations expected. If some of them lead to significant strikes, that would have a positive impact on [copper] prices,” explained Sergio Hernandez, vice president of Cochilco, Chile’s state copper commission.
Other fundamental trends are driving commodities, as I’ve noted earlier. The global purchasing manager’s index (PMI), a gauge of the manufacturing industry, is near a seven-year high. Construction confidence in the eurozone turned positive. And construction spending here in the U.S. hit $1.257 trillion in November, a new high.
China and India Cleaning Up Its Act
About half of all the copper produced globally every year is consumed by China. Last year, the Asian giant set a new record in importing the red metal. Imports climbed to a never-before-seen 17.35 million metric tons in 2017, up 2.3 percent from the previous year.

The metal is needed not just for the construction of new buildings but also to manufacture millions of new electric vehicles in the world’s largest auto market. Sometime this year, China is expected to announce when it plans to outlaw gas-powered vehicles, joining a growing number of other countries, including the U.K. (which is shooting for a 2040 ban), France (2040), Germany (2030), India (“next 13 years”) and more.
According to Bloomberg New Energy Finance, about 1,293 gigawatts per hour (GWh) are forecast for the lithium-ion battery market. That’s up spectacularly from only 19 GWh in 2015. About two thirds of the demand will come from China and the U.S.

To accommodate all these new EVs, China has pledged to build a charging station for every vehicle on the road by 2020. That equates to around 4.8 million charging outlets and stations, requiring a total investment of $19 billion. China had 190,000 charging stations at the end of September, so to call this goal ambitious is an understatement. The U.S., by comparison, has a little over 64,000 outlets and stations around the country, according to the Department of Energy.
Even William Ford Jr., Ford Motor’s executive chairman, acknowledged that the Chinese are more aggressive than most in their mission to fully embrace the electric vehicle. “When I think of where EVs are going,” Ford said in Shanghai last month, “it’s clearly the case that China will lead the world in EV development.”
Not only was China the largest importer of copper, crude oil, natural gas and other natural resources, it also outspent every other country in new clean energy capacity. The country invested as much as $132.6 billion in 2017, about 16 percent more than the U.S. and Europe combined. The government’s efforts already seem to be having a positive effect, as sales of face masks and air purifiers in Beijing have fallen dramatically compared to last winter.

Another market that’s in urgent need of clean energy is India. In Delhi, the country’s capital territory, the air quality has become so noxious and filled with heavy metals that the World Health Organization has likened it to smoking at least 50 cigarettes a day. The city’s chief minister, Arvind Kejriwal, went so far as to call it a “gas chamber.”
Shell Shelling Out for Electricity Provider
It’s not just governments seeking to diversify their energy mix. Royal Dutch Shell, the largest oil company in Europe, is steadily acquiring smaller providers of electrical power and natural gas. In December it announced a deal to buy retail energy provider First Utility. It’s just the latest in a series of purchases by large oil and gas companies looking ahead to the day when charging stations, rather than gas stations, might be the norm.
In an interview this month, Shell CEO Ben van Beurden sees the current energy transition as an opportunity.
“We have to embrace the future, and the future will include battery electric cars,” van Beurden said. “Importantly, I believe Shell can achieve this without destroying value in the company. It is about identifying real business opportunities to thrive through the energy transition.”
As my friend Robert Friedland sees it, those business opportunities lie in copper, aluminum, cobalt and other key industrial metals.
“We’re in the battery business,” he told us, adding that very little of lithium-ion batteries is actually lithium.
Racing for Bitcoin
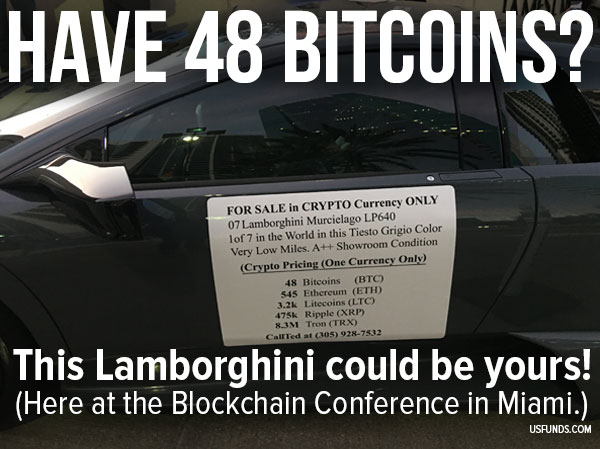
Last week I was in Delray Beach, Florida, attending the Black Diamond Investment Conference, where I was excited to see a 2007 Lamborghini Murcielago for sale. It wasn’t so much the fact that it was a Lamborghini but that the sellers were seeking payment in cryptocurrency only. In case you have 48 bitcoins lying around—valued at a little over half a million dollars at today’s price—you could be the proud new owner of a top-quality sports car. I’m pleased to see even more transactions being made in bitcoin and other cryptocurrencies.
All opinions expressed and data provided are subject to change without notice. Some of these opinions may not be appropriate to every investor. By clicking the link(s) above, you will be directed to a third-party website(s). U.S. Global Investors does not endorse all information supplied by this/these website(s) and is not responsible for its/their content.
The Purchasing Manager’s Index is an indicator of the economic health of the manufacturing sector. The PMI index is based on five major indicators: new orders, inventory levels, production, supplier deliveries and the employment environment.
The Bloomberg Industrial Metals Subindex is composed of longer-dated futures contracts on aluminum, copper, nickel and zinc. It reflects the return on fully collateralized futures positions and is quoted in USD.
Fund portfolios are actively managed, and holdings may change daily. Holdings are reported as of the most recent quarter-end. The following securities mentioned in the article were held by one or more of U.S. Global Investors Funds as of 12/31/2018: Ivanhoe Mines Ltd., Royal Dutch Shell PLC.


![]()
In this week’s issue:
- Stockscores’ Market Minutes Video – Don’t Chase the Wave
- Stockscores Trader Training – 3 Ways to Improve Your Trading Profits
- Stock Features of the Week – Abnormal Breaks
Stockscores Free Webinars
Stockscores Market Minutes – Don’t Chase the Wave
Most traders react to what has happened rather than think about what is going to happen next. This week’s Market Minutes looks at the importance of not chasing the wave when trading, but anticipating it. Plus, my regular weekly market analysis and the trade of the week on NKE.
Click here to watch on the Stockscores Youtube Channel
To get instant updates when I upload a new video, subscribe to the Stockscores YouTube Channel
Trader Training – 3 Ways to Improve Your Trading Profits
Traders are faced with a lot of information and one of the great challenges is knowing what techniques and skills are most important for trading success. This week, I share with you 3 things that I think every trader must do to maximize their trading profits.
Focus on Abnormality
Almost every stock that outperforms the market starts is upward trend with abnormal price and volume behavior. The Stockscores Market Scan tool has been built around this fact, offering specialized filters to find the stocks behaving abnormally.
However, not all stocks trading abnormally make market beating upward trends in the future. It is important to know how to qualify what are the best trading opportunities. Don’t consider stocks that are rallying in to resistance because they will usually get stuck at that resistance level. Be cautious with stocks making abnormal moves on low volume because the market activity is less trustworthy when there are fewer people trading the stock.
Keep it simple. If a stock starts to attract a crowd of traders, do your homework to find out what is going on and analyze the chart to see what the reward for risk trade off is.
Limit the Size of Your Losses
No matter how good your analysis, you will be wrong and lose money on some of your trades. With good risk management, you can be very profitable even if you are wrong more often than you are right. The key is to not suffer from big, portfolio crushing losses.
You can limit your losses by using a stop loss order with your broker or manually execute an exit when the stock falls to threshold that you determine to be the signal that the trade is not working.
I recommend only using a stop loss order when trading very liquid stocks in the very short term. I only use them when I am day trading.
Otherwise, I establish where support is and plan to exit if the stock closes below that threshold. This requires checking my holdings daily to see if there is a sell signal on any of them.
To determine the ideal stop loss point, I collect a lot of data from trades I have found and do what if analysis to find the ideal stop loss point. The method tends to be different for each of my strategies. For example, my Worm day trading strategy has been most profitable using a wide stop of -5 Reward for Risk element. A reward for risk element is based on the height of the entry signal candle, typically the difference between the closing price and low of that candle.
For a longer term strategy based on the daily charts, the ideal stop may be at -1.3 or -2 RR. I use large data sets to find the ideal but also constantly collect and check the data to see what is working the best. There is nothing wrong with changing your approach when the data tells you to.
Add to Your Winners (and NEVER add to your Losers)
Finally, I add to my winners, using the profits from an earlier position to mitigate the risk of a later one.
This is called scaling in and, simplified, this is how it works.
Suppose I buy a stock at $10 with a stop at $9. Later, the stock moves up and gives another buy signal at $12 with new support at $11. I can buy more at the point because my new stop loss point at $11 actually makes my first position profitable since I bought it at $10.
As the stock continues to move higher, I continue to add every time there is a new buy signal that has a stop loss point that is higher than my previous entry.
These 3 concepts are simple but take some time to learn. For more in depth discussion of them, consider one of the Stockscores trader training options found here.

This week, I ran the Abnormal Breaks Market Scans on Monday after the close and found a couple of stocks worth checking out.

1. LTRX
LTRX made an abnormal price move today on strong volume, breaking it up and through some short-term resistance. Still has to fight through some resistance as it tries to surpass last year’s highs around $4. 7/10

2. NVCN
NVCN (T.NVCN) is another abnormal mover today, breaking it steep downward trend line. Has strong support at $0.50 that should limit downside. 7/10.

If you wish to unsubscribe from the Stockscores Foundation newsletter or change the format of email you are receiving please login to your Stockscores account. Copyright Stockscores Analytics Corp.
References
- Get the Stockscore on any of over 20,000 North American stocks.
- Background on the theories used by Stockscores.
- Strategies that can help you find new opportunities.
- Scan the market using extensive filter criteria.
- Build a portfolio of stocks and view a slide show of their charts.
- See which sectors are leading the market, and their components.
Disclaimer
This is not an investment advisory, and should not be used to make investment decisions. Information in Stockscores Foundation is often opinionated and should be considered for information purposes only. No stock exchange anywhere has approved or disapproved of the information contained herein. There is no express or implied solicitation to buy or sell securities. The writers and editors of this newsletter may have positions in the stocks discussed above and may trade in the stocks mentioned. Don’t consider buying or selling any stock without conducting your own due diligence.
Victor points out that money is starting to move into the sold out Commodity sector which relative to stocks is down 75% in the last 7 years to an 18 year low. He also see the US Dollar oversold and due for a bounce. Transcript below:
The key aspect of market psychology so far this year has been a willingness to aggressively take on risk. We have seen aggressive buying of stocks and aggressive selling of bonds and the US Dollar.
The leading global stock market indices keep rising as risk appetite keeps rising and FOMO seems to be the driving force. Bank of America reports that the latest 4 week inflows into equities was the largest ever at $58 billion. The Investor’s Intelligence survey reports the Bull / Bear spread is 67% / 13% the highest since 1986. The DJIA rallied over 1000 points in 8 consecutive days…a record clip. There hasn’t been so much as a 3% correction in over a year. A weak USD helps support American stocks as ½ of the sales by the S+P 500 companies come from outside the USA. This is the Euphoric Stage of a rally and it could go a lot higher but I’m not jumping aboard. As Bob Farrell says, “The public buys the most at the top and the least at the bottom.”
Interest rates are also rising with the 2 year Treasury yield above 2% for the first time in 10 years and the 10 year Treasury yield at a 4 year high of 2.64%. (That’s a double from the 1.3% yields hit during the Brexit period, June 2016.) Last year saw a record sized flow of money ($2 Trillion) into the markets from the G4 Central Banks…the forecast for this year is that Central Banks will inject WAY LESS capital while governments are issuing more debt…therefore, this year the private sector is going to have to buy bonds…and that may mean interest rates will have to go higher to attract capital. The bond market “Kings” (Gross and Gundlach) predict that the 10 year Treasury yield will go higher and will cause (at least) a correction in the stock market. The Guarded Opportunity managed futures program that my son Drew manages has been short T-Notes since the end of November.
The American Financial Conditions Index is at its easiest in 10 years courtesy of a weak USD, strong stock markets and tight credit spreads. This may contribute to the FOMC raising s/t interest rates more in 2018 than the market is currently pricing.

The US Dollar Index hit 14 year highs a year ago, fell for most of 2017 and has made fresh 3 year lows YTD as the Euro makes 3 year highs (up 16% from a year ago)…despite the 2 year interest rate spread between the USA and Germany at a record wide >2.6%. Futures market speculators have an All Time Record large net long position in Euro against the USD. Trends in the FX markets often go WAY further than seems to make any sense…and then turn on a dime and go the other way. I think part of the weakness in the USD is an expression of the risk appetite trade. When the market is willing to take on risk capital moves away from the center (New York) and goes to the periphery (say, emerging markets.) If risk appetite gets “spooked” I expect the USD to rise sharply.

The Canadian Dollar “big event” for this week was the Bank of Canada meeting. They raised rates as expected but sounded a strong note of caution over NAFTA uncertainties. CAD traded through a 1 ¼ cent range on Wednesday and closed unchanged. I’ve been suspicious about the very strong December employment number reported by StatsCan…I’d look for a much weaker number for January if not an outright downward revision to the December number. I think it’s possible to see the Bank of Canada fall well behind the Fed this year in terms of raising interest rates. Western Canada Select oil continues to trade around $40 and Canadian NatGas is WAY cheaper than New York benchmarks. The NAFTA negotiating teams meet again in Montreal this coming week. Interestingly the Mexican Peso has risen about 7% since Christmas…apparently not worried about Trump pulling the plug on NAFTA.
I think CAD rallied from 7750 in mid-December to the January highs of 8100 because of a generally weak USD. I think USD is oversold and if it bounces back then the best candidate to short against USD is CAD. I’m short CAD.

Crude oil prices hit 3 year highs this week with WTI ~$65. Futures market speculators are massively net long crude. OPEC and IEA forecasts this week both predicted substantial increases in non-OPEC production this year…with the IEA predicting that “explosive” growth in American production together with substantial increases in Canada and Brazil will more than make up for any declines in Venezuela and Mexico. I think the crude oil market is about, “As Good As It Gets” and I’m short.
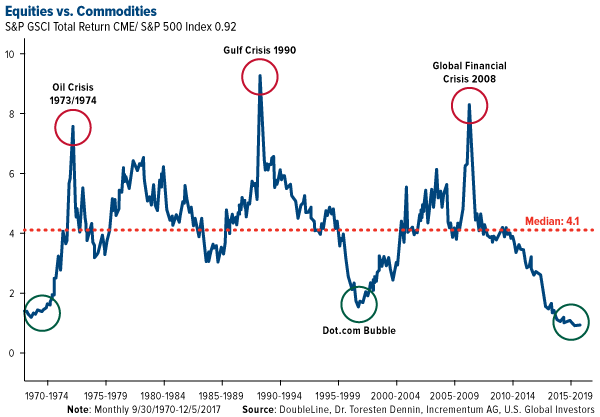
Commodity Indices are rising with the (energy heavy) Goldman Sacs commodity index up ~63% from the January 2016 lows at a 3 year high. The venerable Thompson Reuters Commodity Research Bureau Index (with a much greater weighting to the AG sector) is up ~26% from the January 2016 lows. Both indices are 40 to 50% below their All Time Highs. Despite these “decent” 2 year rallies the commodity indices have continued to fall relative to the major stock market indices. The CRB Index hit its All Time High in 2011 and, relative to the S+P 500 Stock Index it has fallen ~74% in the past 7 years to an 18 year low! The gold/S+P500 ratio has fallen ~70% in the same time period to an 11 year low.
I think “some” of the buying we’ve seen in the commodity and commodity currency sector over the past 2 years may have come from “some” rebalancing by macro asset allocators…they’ve taken money away from their big gains in the stock markets and re-positioned it in the relatively “really cheap” commodity sector.
Keep track of Victor at http://www.polarfuturesgroup.com
Table of Contents
Fundamental Stock Market Indicator 1-2
Global Growth Barometer 3
Economic Surprise Index 4
Investors Intelligence Sentiment 5
Bull/Bear Ratio Over 3.0 6
Bull/Bear Ratio Under 1.0 7
Bull/Bear Ratio Under 1.0 & Over 3.0 8
AAII Sentiment 9
Bull/Bear Ratio vs. Consumer Confidence 10
S&P 500 Put Call Ratio 11
Volatility 12
Volume 13
Dow Theory 14
S&P 500 Moving Averages 15-16
S&P 500 Sectors Stock Price Index & 200-dma 17
S&P 500 Sectors Stock Price Index Minus 200-dma 18
S&P 500 Sectors Stock Price Index Relative to S&P 19

Average of Consumer Comfort Index and Boom-Bust Barometer, which is CRB raw industrials spot price index divided by initial unemployment claims, four-week moving average.
Source: Bloomberg, Commodity Research Bureau, Department of Labor, and Standard & Poor’s Corporation.

As symbolized by the 3 Amigos, the macro backdrop is riding on to its destiny. That forward destiny is a top in stocks vs. gold (Amigo 1), a rise in long-term interest rates to potential if not probable limits (Amigo 2) and an end to the yield curve’s flattening trend (Amigo 3).
When our zany friends complete the journey, big changes are likely in the macro markets.

Let’s take a checkup on each Amigo and consider some implications as well.
Amigo 1: Stocks vs. Gold
Using the S&P 500 as an example, stocks/gold ratios are still trending up on the daily time frame.

The big picture allows for higher levels before this Amigo stops riding and the party crashes. Stocks vs. gold is a confidence indicator and confidence is intact and growing. In this case, confidence = mania. This is consistent with our ‘inflation trade’ theme since it is the US stock market that benefited first and most intensely from the Fed’s years of non-stop monetary fire hoses (ZIRP & QEs 1-3 with a side of Op/Twist).

Amigo 2: Long-term Interest Rates
Again sticking with the US for the example, 10yr and now even 30yr yields are gaining more attention out there among market analysts and media. This is 100% on track with our theme that by the time the 10yr hits 2.9% and the 30yr 3.3%, the sound of “BOND BEAR MARKET!!!!” will be deafening.
Here is the bullish 10yr yield. The daily pattern targets 2.9% and…

We have a handy cross reference by the long-term monthly chart. TNX is creeping through potential limiter #1, which is the EMA 110 (solid red line) with the EMA 140 out ahead around 2.9%. I like the target confluence by these two different time frames and views. If the 10yr is to move higher, that would come with ever increasing media noise about the new age of rising yields (and inflation).

Even the 30yr, which as been lagging, has been making a move of late and is in a bottoming pattern similar to the one that the 10yr has broken out of.

But the pattern above has not yet broken out like the 10yr and so, this is either a negative divergence or the 30 is going to play some catch up if it is going to go for its limiter at the monthly EMA 100. The question is, has Bill Gross already made a serious contrary indicator signal or is he going to be anointed the “Bond King” as the 30yr rises to the limiter? See: A Gross Signal Upcoming. His media-bellowed call was incredibly unfortunate in early 2011. Maybe this time he gets to look like a genius temporarily.

Amigo 3: The Yield Curve
The daily view of the 10yr-2yr is in a downtrend and flattening.

The flattening goes with the macro boom that is taking place. The curve is far from inversion, but contrary to popular belief, it is under no obligation to invert before the macro turns. Then again, a downtrend is a downtrend as long as it is in force… and in force it certainly is.

Bottom Line
Amigo 1 (Stocks vs. Gold): Stocks continue to trend upward vs. gold and this implies ongoing confidence in the boom. The last thing on players’ minds right now is playing defense. Insofar as gold has been strong, which we’d anticipated for this time frame for all the reasons (seasonal, CoT, ‘inflation trade’, etc.) belabored to this point, it’s real bull market will feature an end to the party in the risk ‘on’ stuff. Right now, it’s still party on Garth.
Amigo 2 (Long-Term Interest Rates): The rising interest rates story is gaining traction in the wider media. We have expected long-term yields to rise with the dynamic ending phase of the boom. The noise could become intense and set up a great contrary play as the 10yr and 30yr yields come to their long-term limits (if decades of uninterrupted history as a good guide) and Bill Gross – the Bond King – reclaims his throne.
Amigo 3 (10yr-2yr Yield Curve): It’s simple, it declines with a boom and it rises with a bust. We are in a boom. Risk is high and rising every week, but the trend is the trend for now.
How to play it? I am sticking to a regimen of deploying capital on opportunity, making sure to take ample profits, staying balanced (for example, currently balancing gold sector vs. broad market and favored commodity areas) and always being aware of cash levels. We discuss these aspects quite a bit in NFTRH, even as speculation continues. You can manage risk and still enjoy a bubble. You just need to remain conscious of the macro and conscious of your parameters and disciplines.
NFTRH.com and Biiwii.com

-
I know Mike is a very solid investor and respect his opinions very much. So if he says pay attention to this or that - I will.
~ Dale G.
-
I've started managing my own investments so view Michael's site as a one-stop shop from which to get information and perspectives.
~ Dave E.
-
Michael offers easy reading, honest, common sense information that anyone can use in a practical manner.
~ der_al.
-
A sane voice in a scrambled investment world.
~ Ed R.
Inside Edge Pro Contributors

Greg Weldon

Josef Schachter

Tyler Bollhorn

Ryan Irvine

Paul Beattie

Martin Straith

Patrick Ceresna

Mark Leibovit

James Thorne

Victor Adair