
Wealth Building Strategies
 The warning signs that a market crash is looming are becoming louder and more frequent. Despite this, most market participants are behaving like it can never happen. In fact, bullish trading is pushing the markets to new highs on an almost daily basis. The warnings are seen, heard and then ignored.
Join the few who will take advantage of what’s about to happen. The same few who profited handsomely when billions were lost in the last global economic crisis almost a decade ago rather than those who simply follow the herd.
For most people these warnings are like the graphic images printed on today’s packets of cigarettes, they spell out the dangers and yet all the same people are still smoking.
Warnings about an impending market crash are being made by people who predicted with considerable accuracy in 2006 and 2007 what was ahead when the US sub-prime mortgage market collapsed and triggered the global financial crisis.
The one thing these analysts can’t predict is an exact time and place for when the crash will happen. It’s the same reason people continue to smoke; nobody can say with certainty the number of cigarettes required to kill a person.
So, trading continues regardless until the day the sudden dramatic drop in prices exceeds the 10 per cent threshold that officially marks the point that the crash has arrived.
Just as smokers only decide to stop when the physician says: “Mr Smith, I regret to inform you that you have lung cancer.”
Swiss investor Marc Faber, also known as “Dr Doom”, predicts that stocks are set to plunge by 40 per cent or more. Mr Faber, the editor of ‘The Gloom, Boom & Doom Report’ recently told CNBC: “We have a bubble in everything.”
His caution is echoed by Nobel Prize-winning economist Robert Professor Shiller who has urged investors to tread cautiously because market valuations are at “unusual highs”.
In a recent interview with CNBC, he said: “We are at a high level, and it’s concerning,” highlighting that the only times valuations have been higher were in 1929 and 2000.
Mark Zandi is chief economist at Moody’s Analytics. In August he joined the chorus of analysts preaching caution after determining that the stock market is overvalued.
In an article in Fortune he said: “The stock market is due for a significant correction” adding, “stock returns in the next several years will be very pedestrian if they increase at all.”
Last month HSBC issued a Red alert warning. They’re looking at two key levels: 17,992 in the Dow Jones Industrial Average and 2,116 in the S&P 500.
“As long as those levels remain intact, the bulls still have a slight hope. But should those levels break and the markets close below, which now seems more likely, it would be a clear sign that the bears have taken over and are starting to feast,” said head of technical analysis Murray Gunn. “The possibility of a severe fall in the stock market is now very high,” he added.
However, according to Bill Blain, a strategist at Mint Partners, this time bond markets will trigger the mayhem.
According to Blain, stock markets don’t matter. “The truth is in bond markets. And that’s where I’m looking for the dam to break. The great crash of 2018 is going to start in the deeper, darker depths of the credit market,” he said.
“I’m convinced bond markets are the real bubble we should be watching, and it’s going to start in high yield…”
Blain’s opinion on a bonds inspired crash is echoed by Niall Ferguson in his piece in The Sunday Times this month.
Ferguson was warning about the sub-prime mortgage crisis over a year before the crash occurred. He spoke publicly about it on many occasions and in his book The Ascent of Money spelling out the dangers in graphic detail, which was published just as his predictions were coming true.
He sees a bonds sell off as a result of a series of events that will bring about the next economic crisis.
Ferguson firstly points to the effect of interest rate increases by the big four central banks — the Fed, European Central Bank, Bank of Japan and Bank of England — when the rate of economic expansion has already started to slow.
He explains: “History shows that monetary tightening acts with long and variable lags. But it does act, often on stock markets.”
Ferguson also points to global wage and inflation increases as the second contributory factor as we approach a demographic inflection point where the ratio of workers to consumers has peaked.
This has led Ferguson to the conclusion that the end of the 35-year bond bull market is imminent. “Bonds will sell off; long-term rates will rise. The question is whether inflation will increase as much or more. If not, then real (inflation-adjusted) interest rates will rise, with serious implications for highly indebted entities.”
He points to two big economies, China and Canada, which are in particular trouble. You should probably add Australia to that list given its level of connectedness to China.
Despite being described with the same words, no two financial crises are the same. The next one will differ from the last one, that’s why they are so hard to put into an actionable timeframe. But the inevitability that there will be a next one increases as the monetary medication begins to be withdrawn, which makes the need for taking the right measures now all the more important.
FXB Trading’s experts are equally convinced that a significant market correction is imminent. They’ve devised a strategy to profit from the situation as many notable forward-thinking analysts did ahead of the 2008 sub-prime mortgage crash in the US which then caused the subsequent global financial crisis.
In the 2008 scenario their investment returned ratios of between 1:10 to 1:20. FXB’s traders will replicate the trade, but will also hedge their position.
Until the market crashed in 2008 those US traders were in a losing position, but by hedging it is possible to avoid losses until the crash occurs.


Bob Moriarty, founder of 321gold, has been adamant about Bitcoin and cryptocurrencies being the biggest bubble we’ve ever seen. He has been incredibly accurate in our recent conversations, calling Bitcoin a bubble that had burst in our last conversation on December 22nd, even offering a prescient quote “the bubble has popped but most people don’t know it yet.”
He hasn’t become any more optimistic on cryptos in the last few weeks, in fact he sees a much deeper decline coming and this time Bob offers somewhat surprising advice to investors given his usual bullishness on precious metals.
….also from Bob Moriarty:
Altamira Begins Releasing Results

HOUSTON (Reuters) – Surging shale production is poised to push U.S. oil output to more than 10 million barrels per day – toppling a record set in 1970 and crossing a threshold few could have imagined even a decade ago.
And this new record, expected within days, likely won’t last long. The U.S. government forecasts that the nation’s production will climb to 11 million barrels a day by late 2019, a level that would rival Russia, the world’s top producer.
The economic and political impacts of soaring U.S. output are breathtaking, cutting the nation’s oil imports by a fifth over a decade, providing high-paying jobs in rural communities and lowering consumer prices for domestic gasoline by 37 percent from a 2008 peak.
Fears of dire energy shortages that gripped the country in the 1970s have been replaced by a presidential policy of global “energy dominance.”
also from Reuters:
Strong China data cranks up pressure on bond markets – Global Borrowing Costs at 10 month High

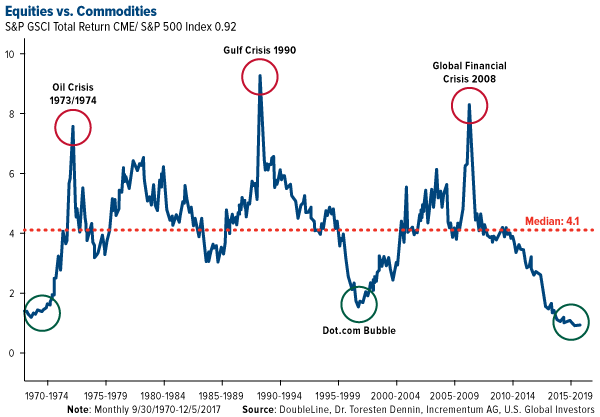
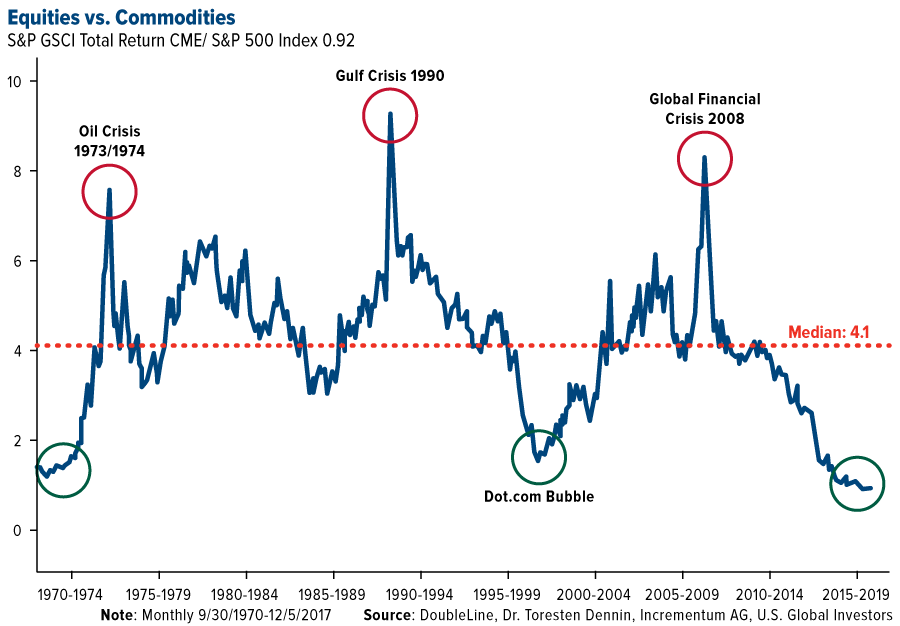
Ed Note: With US Dollar breaking to multi-year lows and the 37 Year old Bull Market in Bonds set to go bearish there is going to be dramatic changes in where money flows. Based on previous booms and busts, the S&P GSCI Total Return Index-to-S&P 500 Index ratio above is now at its lowest point since the dotcom bubble, meaning commodities and mining companies are highly undervalued relative to large-cap stocks. I think its highly likely that in the Stock Market the more glamorous sectors like Biotech, Cannabis, Cryptocurrencies and the FANGS, etc. will likely give way stocks that have significant exposure to commodities. Money Talks Ed.
Recipe Calls for a Broad Commodities Rally in 2018
At the beginning of every year, we update what’s typically one of our most popular pages, the Periodic Table of Commodity Returns. I encourage you to explore 10 years’ worth of data on basic materials such as aluminum, zinc and everything in between. A word of warning, though—the interactive feature makes the table highly addictive. Please feel free to share it with friends and family!

It was a photo finish for commodities in 2017. The group, as measured by the Bloomberg Commodity Index, barely eked out a win for the second straight year, edging up 0.7 percent. Spurred by a weaker U.S. dollar and strengthening materials demand from factories, the index headed higher thanks to a breathtaking rally late in the year that lasted a record 14 consecutive days.
The annual return might not look too impressive, but I believe the economic conditions are ripe for a broad commodities rally in 2018. I’m not alone in predicting they’ll be among the best performing asset classes by year end, perhaps even beating domestic equities as quantitative tightening threatens to put a damper on the nine-year bull run.
Analysts at Goldman Sachs, for instance, are overly bullish commodities, recommending an overweight position for the next 12 months. Bank of America Merrill Lynch is calling for a $7,700-a-tonne copper price target by mid-2018, up from $7,140 today. In last Friday’s technical market outlook, Bloomberg Intelligence commodity strategist Mike McGlone writes that the “technical setup for metals is similar to the early days of the 2002-08 bull market.” Hedge fund managers are currently building never-before-seen long positions in heating oil and Brent crude oil, which broke above $70 a barrel in intraday trading Thursday for the first time since December 2014. It’s now up close to 160 percent since its recent low of $27 a barrel at the beginning of 2016.
Few have taken such a bullish position, though, as billionaire founder of DoubleLine Capital Jeffrey Gundlach, whose thoughts are always worth considering.
Commodities Ready for Mean Reversion?
Last month I shared with you a chart, courtesy of DoubleLine, that makes the case we could be entering an attractive entry point for commodities, based on previous booms and busts. The S&P GSCI Total Return Index-to-S&P 500 Index ratio is now at its lowest point since the dotcom bubble, meaning commodities and mining companies are highly undervalued relative to large-cap stocks. We could see mean reversion begin to happen as soon as this year, triggering a commodities super-cycle the likes of which we haven’t seen since the 2000s.
Gundlach has more to say on this subject. During his annual “Just Markets” webcast, he told investors that “commodities will outperform in 2018” because they “always rally sharply—much more sharply than they have so far—late in the business cycle as we head into a recession.”
Speaking to CNBC, he added that the S&P 500 “may go up 15 percent in the first part of the year, but I believe, when it falls, it will wipe out the entire gain of the first part of the year with a negative sign in front of it.”
Gundlach might be in the minority here, but it’s hard to ignore the tell-tale signs that we’re approaching the end of the business cycle, as I’ve pointed out before. We’ve begun a new interest rate hike cycle, both here in the U.S. and the United Kingdom. The Federal Reserve has started to unwind its massive balance sheet. The Treasury yield curve continues to flatten. And the S&P 500 just had its least volatile year on record.
All of these indicators, among others, have historically preceded a substantial market correction.
In his 2018 outlook, David Rosenberg, chief economist and strategist at Canadian wealth management firm Gluskin Sheff, makes similar observations, writing that “it is safe to say that we are pretty late in the game.”

How late? After looking at a number of market and macro variables, Rosenberg and his team concluded that we’re about “90 percent through, which means we are somewhere past the seventh inning stretch in baseball parlance but not yet at the bottom of the ninth.”
Look for mean reversion this year, Rosenberg adds, “which would be a good thing in terms of opening up some buying opportunities.”
Resource stocks, I believe, could be an attractive place to look, as they’ve traditionally outperformed in the last phase of an economic cycle.
Manufacturing and Construction Booms Underway
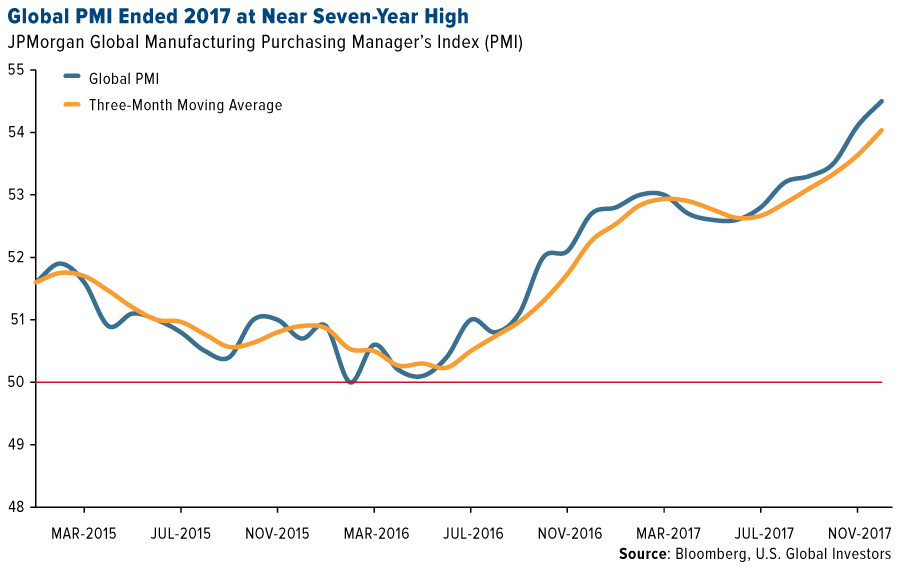
You don’t have to bet on a recession to be bullish on commodities. The dollar appears to have peaked, making materials less expensive for overseas markets, and the Global Manufacturing Purchasing Manager’s Index (PMI) ended 2017 at 54.5, close to a seven-year high. The sector has been in expansion mode now for the past 22 months, with the eurozone signaling its fastest growth in the series’ two-decade history.
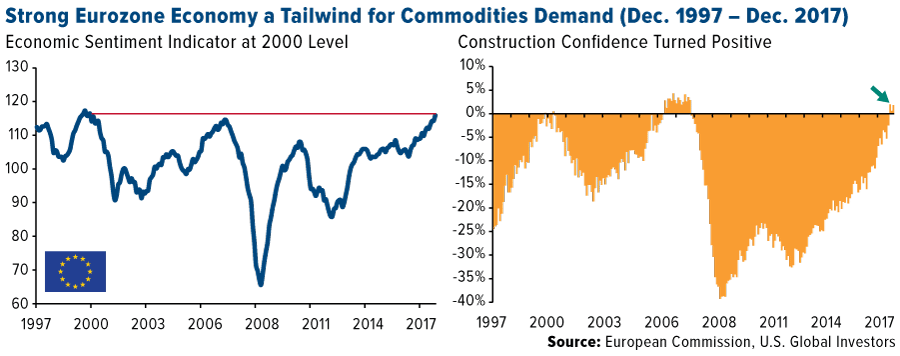
That’s not the only constructive news out of Europe. The European Commission’s headline economic sentiment indicator jumped more than economists had anticipated in December, ending the year at a 17-year high. Construction confidence in the eurozone also looks as if it’s fully recovered and is trending in positive territory for the first time since the financial crisis.
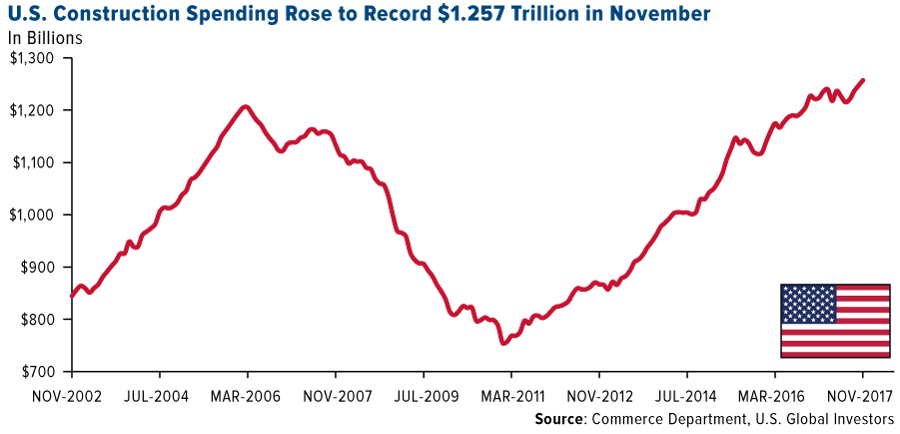
Strong manufacturing and construction expansion here in the U.S. is likewise supportive of commodity prices. December’s ISM Manufacturing PMI clocked in at a historically high 59.7. New orders grew 5.4 percent from the precious month to 59.4, its highest reading since January 2004. What’s more, U.S. construction spending in November rose to an all-time high of $1.257 trillion, according to this month’s report from the Census Bureau.
Which Commodities Are Set to Rally the Most?
Palladium was the best performing commodity of 2017, climbing more than 56 percent on a weaker dollar, concerns of a supply crunch and a robust global auto market. Along with its sister metal, platinum, palladium is used primarily in the production of catalytic converters, which curb emissions from gasoline-powered vehicles.
For the first time since 2001, palladium traded higher than platinum beginning in September, and the week before last it hit an all-time intraday high of $1,099 an ounce. A healthy correction at this point wouldn’t be surprising, as the metal’s looking overbought compared to platinum.
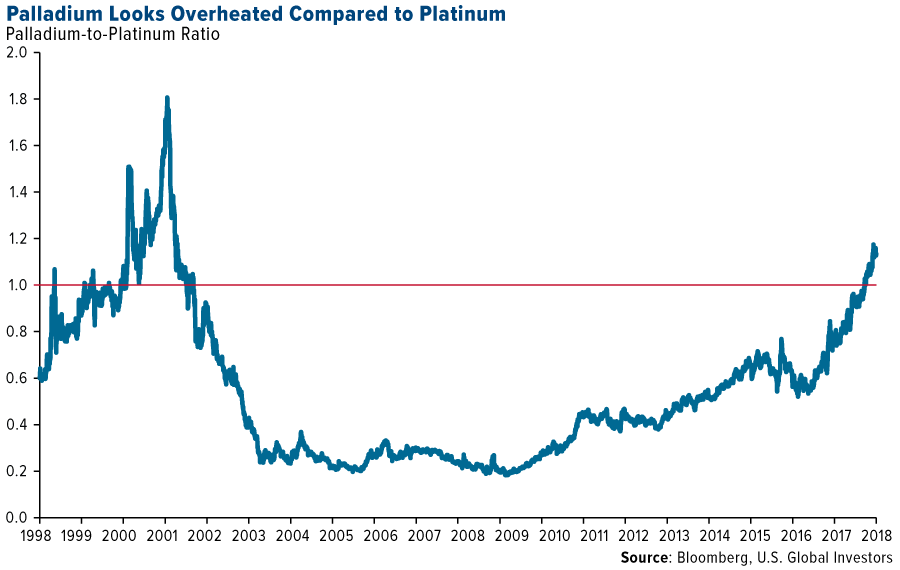
“Pressured by diesel-emission scandals, platinum appears too low vs. palladium,” writes Bloomberg’s Mike McGlone. We might be in for another price reversal this year.
As I wrote recently, gold’s Fear Trade growth drivers are firmly in place. If a “Fed rally” occurs similar to the past two rallies, we could see gold climb to as high as $1,500 an ounce by summer. We also have the Chinese New Year to look forward to, which falls on February 16.
I believe 2018 could also be silver’s year to shine. The white metal rose 6.42 percent in 2017, with Indian silver bullion imports jumping an amazing 90 percent compared to imports the previous year, according to Metals Focus. Goldman Sachs analysts point out that silver has historically fared better than gold near the end of the business cycle, “as it is more strongly leveraged to global growth, given its significant industry use.”
A recent online survey conducted by Kitco News found that nearly 40 percent of respondents believed silver would outperform in 2018, compared to four other metals. Twenty-seven percent of readers said gold would outperform, followed by a quarter for copper. About 10 percent were most bullish on either platinum or palladium.
Tuesday January 16, 2018 3:00pm Pacific.
DOW – 10 on 968 net declines
NASDAQ COMP – 37 on 1002 net declines
SHORT TERM TREND Bullish
INTERMEDIATE TERM Bullish
STOCKS: Today we had a reversal day on relatively high volume. The Dow was up 282 points shortly after the opening and then gave it all back and then some.
That type of activity can mark a significant top, but not normally. Usually it’s just a temporary interruption in the current trend. The extreme overbought condition was most likely the culprit. It would actually be good to have a multi day retreat, but I doubt we’ll get it.
GOLD: Gold was up $4. Another new low for the greenback helped push up the yellow metal.
CHART: The Volatility index (VIX) moved up 15% today. Any move of over 7% has a tendency to foreshadow near term strength.

BOTTOM LINE: (Trading)
Our intermediate term system is on a buy.
System 7 We are long the SSO from 110.59. Keep your stop at 115.59
System 9 On a buy signal from Dec. 29.
NEWS AND FUNDAMENTALS: There were no important releases on Tuesday. On Wednesday we get industrial production, the housing market index and the Fed Beige Book.
INTERESTING STUFF: Reason obeys itself; and ignorance submits to whatever is dictated to it. ——Thomas Paine
TORONTO EXCHANGE: Toronto lost 73.
BONDS: Bonds were higher.
THE REST: The dollar keeps sinking. Crude oil lost ground.
Bonds –Bearish as of Jan. 9.
U.S. dollar – Change to bearish as of Jan 12.
Euro — Change to bullish as of Jan 12.
Gold —-Change to bullish as of Jan 12.
Silver—- Change to bullish as of Jan 12.
Crude oil —-Bullish as of Dec. 26.
Toronto Stock Exchange—- Bullish as of September 20, 2017.
We are on a long term buy signal for the markets of the U.S., Canada, Britain, Germany and France.

Monetary conditions (+2 means the Fed is actively dropping rates; +1 means a bias toward easing. 0 means neutral, -1 means a bias toward tightening, -2 means actively raising rates). RSI (30 or below is oversold, 80 or above is overbought). McClellan Oscillator ( minus 100 is oversold. Plus 100 is overbought). Composite Gauge (5 or below is negative, 13 or above is positive). Composite Gauge five day m.a. (8.0 or below is overbought. 13.0 or above is oversold). CBOE Put Call Ratio ( .80 or below is a negative. 1.00 or above is a positive). Volatility Index, VIX (low teens bearish, high twenties bullish), VIX % single day change. + 5 or greater bullish. -5 or less, bearish. VIX % change 5 day m.a. +3.0 or above bullish, -3.0 or below, bearish. Advances minus declines three day m.a.( +500 is bearish. – 500 is bullish). Supply Demand 5 day m.a. (.45 or below is a positive. .80 or above is a negative). Trading Index (TRIN) 1.40 or above bullish. No level for bearish.
No guarantees are made. Traders can and do lose money. The publisher may take positions in recommended securities.


-
I know Mike is a very solid investor and respect his opinions very much. So if he says pay attention to this or that - I will.
~ Dale G.
-
I've started managing my own investments so view Michael's site as a one-stop shop from which to get information and perspectives.
~ Dave E.
-
Michael offers easy reading, honest, common sense information that anyone can use in a practical manner.
~ der_al.
-
A sane voice in a scrambled investment world.
~ Ed R.
Inside Edge Pro Contributors

Greg Weldon

Josef Schachter

Tyler Bollhorn

Ryan Irvine

Paul Beattie

Martin Straith

Patrick Ceresna

Mark Leibovit

James Thorne

Victor Adair