
Currency
 After hitting $20,000 in mid-December, bitcoin prices keep drifting lower.
Looking at the news, it’s clear to me why this is happening.
On Monday, the Financial Industry Regulatory Authority (FINRA), the organization that regulates brokers, advisers and financial institutions in the United States, announced that it was going to focus on cryptocurrencies.
FINRA is a big deal if you manage money or if you are a financial adviser … you have to follow its rules and subject yourself to its examinations.
Merrill Lynch, one of the biggest financial broker and advisory companies in the U.S., banned any cryptocurrency investments in its accounts.
The Chinese government this week announced a plan for an orderly end to bitcoin mining.
That’s right after Visa Europe canceled cards that allowed users to access bitcoin.
This comes right after the South Korean government started requiring real names for all cryptocurrency transactions. The government also banned banks from opening accounts for virtual currencies.
The Indian government is waging war on bitcoin and cryptocurrencies by choking the flow of cash to anyone who’s trading these assets.
If you’ve been in markets long enough, you can see a familiar pattern here…
Putting the Squeeze on Cryptocurrency Investments
This rapid-fire set of announcements looks to me like a coordinated squeeze on cryptocurrency investments. And it reminds me of a similar squeeze that I personally experienced before where I lost money.
PartyGaming. Sportingbet. PokerStars. 888 Holdings. You’ve never heard of these companies, even though they were once highfliers in online gambling through poker.
The thing is, online gambling is illegal in the United States. And most of their customers were U.S. citizens.
These companies skirted around U.S. law by operating their websites from places like Costa Rica, the Caribbean and the United Kingdom. For a while, the U.S. government tolerated this activity.
Then, on October 2, 2006, the government lowered the hammer.
It secretly added rules into a transportation law called the SAFE Port Act. These rules made it illegal for American banks and credit card companies to process payments to online gaming companies.
By doing this the government chopped off the lifeblood of these businesses — money flow.
You see, everyone gambling online used credit cards or bank transfers to fund their betting. If you made it illegal to process transfers to online gambling companies, you starved these companies of their source of cash.
Overnight, 90% of their sales disappeared. Instantly their stocks crashed. They never recovered.
A Big Threat to Government Power
So here’s why this matters to bitcoin and cryptocurrencies.
I believe that governments are looking to crack down on bitcoin and cryptocurrencies because they see them as a threat to their monopoly power to issue currency.
Governments around the world derive great power from their ability to issue their national currency. It’s completely against their interests to have a new currency compete with their monopoly in issuing currency.
The fact that people are using bitcoin and cryptocurrencies to transfer wealth, avoid taxes and for illegal activities is also a big threat to government power.
If everyone shifted to bitcoin or cryptocurrencies, then the government’s tax collection would go to zero. And it could lose its ability to enforce law and control the economy.
The bottom line: Bitcoin and cryptocurrencies represent a threat to a government’s power.
Cutting off the Money Flow
The U.S. China. South Korea. Europe. India. These are substantial markets for bitcoin and cryptocurrencies.
These governments know banning bitcoin and cryptocurrencies can cause social and political unrest. Instead, they are going to squeeze them dry using the same technique they used to get the online gaming companies: They are going to starve the cryptocurrency exchanges of money flow.
Cutting off the money flow from new clients and cash will slowly dry up the trading and liquidity in bitcoin and cryptocurrencies. The government will keep squeezing until these markets are no longer a threat to them.
Now, those who own bitcoin and other cryptocurrency investments are going to dismiss this threat. They believe that bitcoin and cryptocurrencies are going to stay strong even as governments put the squeeze on these assets.
I believe they are wrong. And my experience with online gambling stocks is just one example of how harshly governments will act when their powers are threatened.
Regards,

Paul Mampilly
Editor, Profits Unlimited


- *Toronto GTA SFD prices began March 2009. Prior data are Combined Residential +24.5%.
- *Ottawa SFD prices began January 2009. Prior data are Combined Residential +6.9%.
- *Montreal SFD DATA changed from Average to Median in March 2007
- *Vancouver SFD data are HPI®, not Average.
In December 2017 Toronto metro SFD prices continued slipping and 9 months since the March 2017 spike and peak price, they have lost $217,895 or 18% (Plunge-O-Meter). Vancouver prices are still defying gravity; FOMO and speculative pricing is still on. Anyone owning a detached house in the scorching hot Vancouver market is sitting on an unredeemed lottery ticket with time running out as buyers hibernate into the seasonal decline. The Bank of Canada interest rate up-moves are thinning the crowd even more.
It remains interesting to note that the combined average sum price of a Vancouver, Calgary & Toronto condo is currently 56% (no typo) more expensive than a median priced Montreal SFD; it was 52% in OCT 2017; 51% in APR 2017, 49% in FEB 2017 and 41% in July 2016 at the Vancouver peak. Montreal has more listing inventory available for sale than any of the other 5 biggest metros in Canada and the lowest monthly absorption rate based on total listings and sales.
The Plunge-O-Meter tracks the dollar and percentage losses from the peak and projects when prices might find support. On the price chart in the spring of 2005 there was a 4-6 month plateau period while buyers and sellers twitched like a herd. When the credit spreads narrowed and the yield curve began its journey towards inversion, the commodity stampede began.
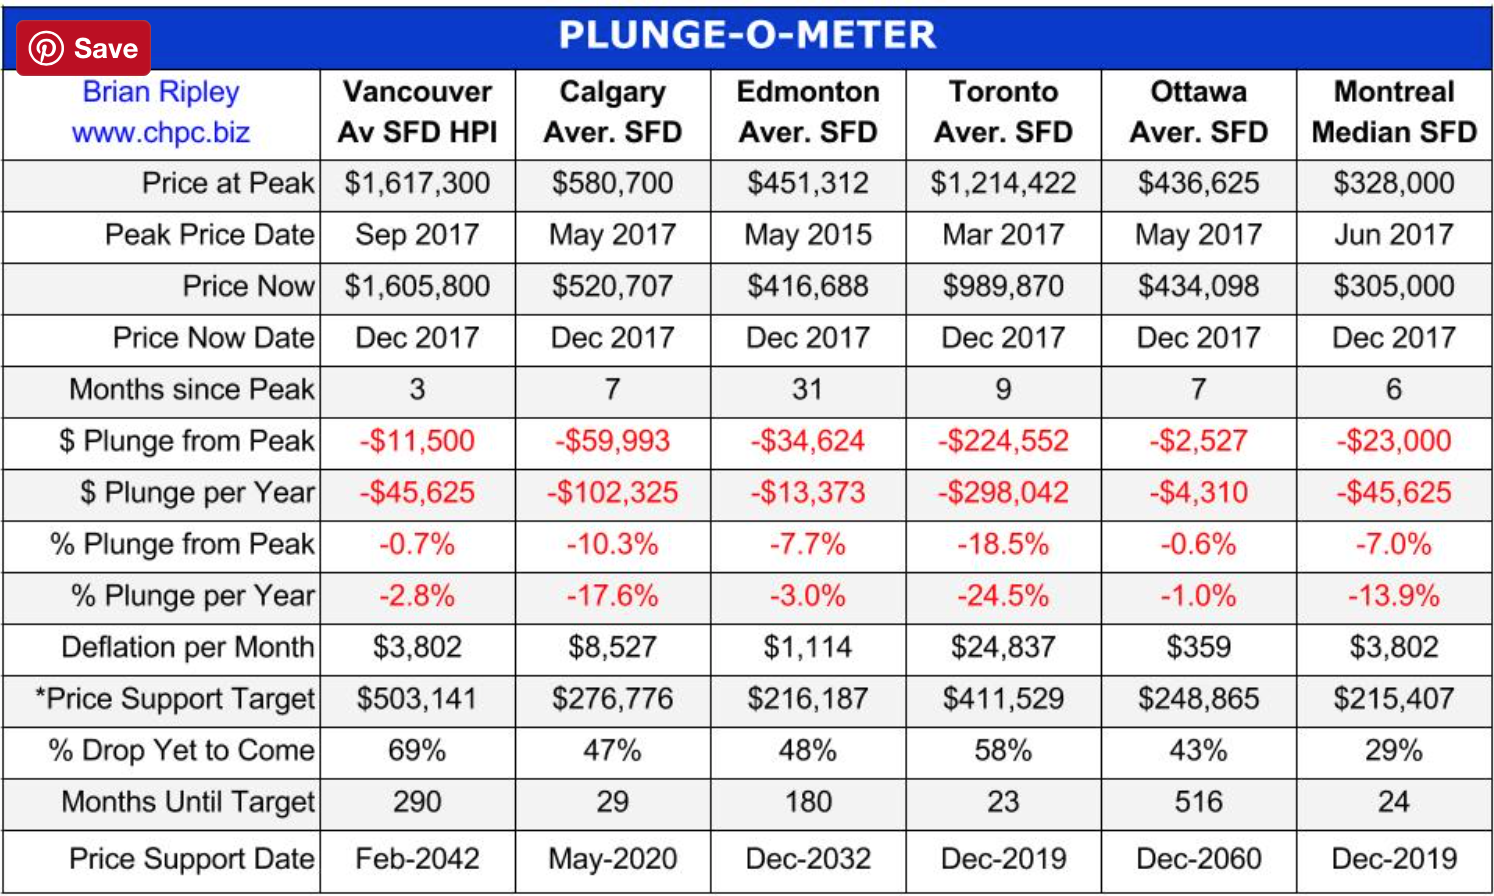
*The Price Support target represents prices at March 2005; the start of a 40 month period of ardent speculation in all commodities; then a full blown crash into the pit of gloom (March 2009); and then another 39 month rocket ship to the moon but then the crowd suddenly thinned out in April 2012. The revival of spirits erupted in 2013 as global money went short cash and long real estate on an inflation bet. Now we have a major sense of doubt about value in Toronto.
Plunge-O-Nomics
The Pit of Gloom
- ’07-’08 Average Vancouver SFD lost $122,900, or 15.9% in 8 months (2%/mo drop)
- ’07-’08 Average Calgary SFD lost $92,499, or 18.3% in 18 months (1%/mo drop)
- ’07-’08 Average Edmonton SFD lost $78,719, or 18.5% in 21 months (0.9%/mo drop)
- ’07-’08 Average Toronto SFD lost $63,867, or 13% in 13 months (1%/mo drop)
- ’07-’08 Average Ottawa Residence lost $25,664, or 8.6% in 6 months (1.4%/mo drop)
- ’07-’08 Median Montreal SFD lost $6,000, down 2.6% in 6 months (0.4%/mo drop)

Since January 2013 we have been using the worldwide Semiconductor Equipment industry as a leader within the Semiconductor sector, which is an economic cyclical leader itself. That month we noted a positive move in Equipment bookings, which became a (3 month) trend that spring. This trend was used to project positive economic signals to come.
Through some turbulence in 2014 and 2015 the sector has remained on ‘economic up’ along with our cross reference indicator, the Palladium/Gold ratio right up to the current time as the economic Canary in a Coal Mine has kept on chirping.
But on November 21, two days before the sector topped I derisively poked at the mainstream media for hyping the Semiconductor Equipment sector with its bold headline… Fund manager looks beyond ‘FAANG’ stocks and finds even bigger winners for 2018. Talk about eyeball harvesting and greed stimulation.
The goofy article highlighted a fund manager who’s likely never dirtied his expensive shoes on a factory floor going on about how he has found value in the likes of Applied Materials and Lam Research. I gave a rebuttal per the link above and noted the reasons why this rosy scenario was unlikely to play out in 2018 for the cycle leading Semi sector and its sub-sector leader, the Fab Equipment companies.
So what do we have now? Why, in checks a real source of industry news (unlike the completely abstracted financial media crap we as investors are routinely subjected to) with affirmation of our November 21 viewpoint.
Still Growing But at a Slowing Pace
To review, in 2013 we projected Semi Equipment → Semi → broader Manufacturing → Employmentand it has played out that way over time and through much media drama and noise. But now the pace of a cyclical leader is slowing… even as the world stokes up on reflation (AKA fiscally stimulated inflation) and it all appears as good as it gets.
That is key. In Q4 2012 market players were embroiled in the Fiscal Cliff drama as my brother in law (a financial adviser) told me at Thanksgiving how the best and brightest fund managers were hording cash in expectation of a negative market event coming that December due to said Fiscal Cliff. My grunted response (which to this day I wish I’d had ‘all in’ conviction about) was “bullish”. That was the sentiment end of it, and the next month saw the Semi signals start coming in. The rest is history.
But January 2018 is much different than January 2013. If you have an interest in economic signaling or the Semi sector in particular, do check out the link above. Meanwhile, here are a few items from the article.
World semiconductor equipment shipment growth was a very robust +26 percent (3-month basis) in October but down from its +63 percent peak in February. By comparison, October global semiconductor shipments were up 22 percent, while November Taiwan chip foundry sales (a leading indicator) were up only 3 percent. Based on Chart 1 it appears the SEMI equipment growth will ease considerably in early 2018.

Comparing global SEMI equipment shipments to the Global Purchasing Managers Index (another leading indicator) also suggests that SEMI Equipment shipment growth will ease but still remain positive into the New Year (Chart 2). SEMI equipment demand remains strong, but the “bubble” growth like we experienced in 2017 is typically followed by a downward “correction,” especially since the current buildup in memory chip capacity will likely ebb in 2018.

I recommend you read the rest of the article. It is very short and to the point. The point being that the up cycle on the economic Canary in a Coal Mine is losing momentum and a respected industry source is projecting it to cycle down sharply in 2018. Now, why again did I make fun of the suit who manages other people’s money for a living when he got newly bullish on AMAT and LRCX in November?
This signal plays into only everything we are currently working on. An ‘inflation trade’ up to the projected limits, amid contrary indicators galore, to get everyone off sides as often happens when the Continuum ™ reaches its limiter. Right now it’s fiscally stimulated inflation and asset prices continuing to rise. But the Canary is going to stop chirping at some point, and then… cue the crickets.

Or for another metaphor, the game of Musical Chairs is going to require you find a seat. While enjoying the current party we are also working on defining the right seats for the hangover phase. Hint: two of them are shiny and made of gold and silver. Hint 2: another digs shiny stuff out of the ground and is counter cyclical.
NFTRH.com and Biiwii.com.


On the surface, the sleep industry appears to be a relatively undesirable space for a startup.
Beds and mattresses are heavy and bulky, and sales are traditionally based on a tactile experience that consumers have with products in physical stores. Holding inventory is expensive and risky, and shipping is a nightmare.
Sure, people are willing to shop online for almost everything these days – but when up to 40% of life is spent lying on a bed, isn’t that a product that should be tested out before a purchase decision is made?
STRANGE BEDFELLOWS
Despite the conventional wisdom to the contrary, the $15 billion mattress industry has seen the entrance of several ambitious startup companies, and they are starting to put a dent in market share.
Today’s infographic from Online Mattress Review tells the story of how disruption is occurring in this unlikely space – and it all starts with big changes to the business model to make online mattress sales more palatable for both the company and the consumers.
AN UPDATED MODEL
Here are a few key ways online mattress companies, like Casper or Purple, have changed up their value proposition to customers to make life easier for themselves:
Money-back guarantee
By offering a money-back guarantee of up to 100 days, online mattress companies give customers plenty of time to test their product. This reduces the chance of buyer’s remorse.
Going all-in on memory foam
Memory foam, as well as other mattress types that can be compressed down in size, allow for fast and easy shipping. Consumers can take a box the size of a filing cabinet and easily navigate it around corners and doorframes in a household setting.
Fun, relationship-based marketing
To appeal to the millennial market, Casper has taken on some quirky initiatives, such as creating Insomniabot-3000 (a chatbot for people who can’t sleep), and a Labor Day Mattress “Sail” boat cruise.
COMFORTABLE GROWTH
In 2016, the market share for online mattress sales was 5%, and it’s expected that the number for 2017 could be at least double that.
While tech startups and the sleep industry may seem like strange bedfellows at first, it’s clear that consumers are embracing the chance to get in bed with the idea.


-
I know Mike is a very solid investor and respect his opinions very much. So if he says pay attention to this or that - I will.
~ Dale G.
-
I've started managing my own investments so view Michael's site as a one-stop shop from which to get information and perspectives.
~ Dave E.
-
Michael offers easy reading, honest, common sense information that anyone can use in a practical manner.
~ der_al.
-
A sane voice in a scrambled investment world.
~ Ed R.
Inside Edge Pro Contributors

Greg Weldon

Josef Schachter

Tyler Bollhorn

Ryan Irvine

Paul Beattie

Martin Straith

Patrick Ceresna

Mark Leibovit

James Thorne

Victor Adair