
Bonds & Interest Rates

I have previously reported that about 50% of German municipalities are insolvent. This is a global trend and we are witnessing it in the United States as well. The North Rhine-Westphalian Association of Cities has called for help from the future German federal government as the building crisis among financially weak municipalities continue to escalate. This includes the fourth largest by area in Germany with the capital situated in Düsseldorf. The main cities include Cologne, Düsseldorf, Dortmund, and Essen. They are pleading for a grand coalition between the CDU and SPD to save the municipal governments. With the end of the historic low-interest phase, interest rates are poised to rise dramatically in Europe and they begin to see that the appetite for new debt from the government is sharply declining.
Politicians have been hiding this municipal crisis in Germany until after the elections when it was assumed Merkel would win as always. Now the cat is coming out of the bag and we will begin to see the real impact of nearly 10-years of subsidizing governments by the ECB rather than actually stimulating the economy that never bounced. This is a fundamental background issue behind the rise in interest rates between 2018 and 2021.
….also from Martin: At What Point do we reach Euphoria in the Equity Markets?

Ed Note: Eventually, after the Federal Reserve has done everything in its power to keep interest rates low, a giant bear market in Bonds is looming. The Fed Fund rates hit a high in May 1981 of 20%. and a low of .25% in Dec 2008. Since then Janet Yellen kept the Fed Funds rate between .05% & .75% before creeping a bit higher to 1.5%. The 30 year bond high was 176.94 on July 8, 2016, and has since fallen to the 150 area. It is a relief that this analyst Rambus has clearly laid out a technical case that that huge 36 year bull market in Bonds appears to finally be ready to roll over into a significant bear market. For anyone with exposure to interest rates, be it through mortgages, loans of investments, this analysis could be absolutely critical to navigating the next decade or more successfully. – Rob Zurrer Money Talks Editor
TMV : 3X Leveraged Short on Treasury Bonds
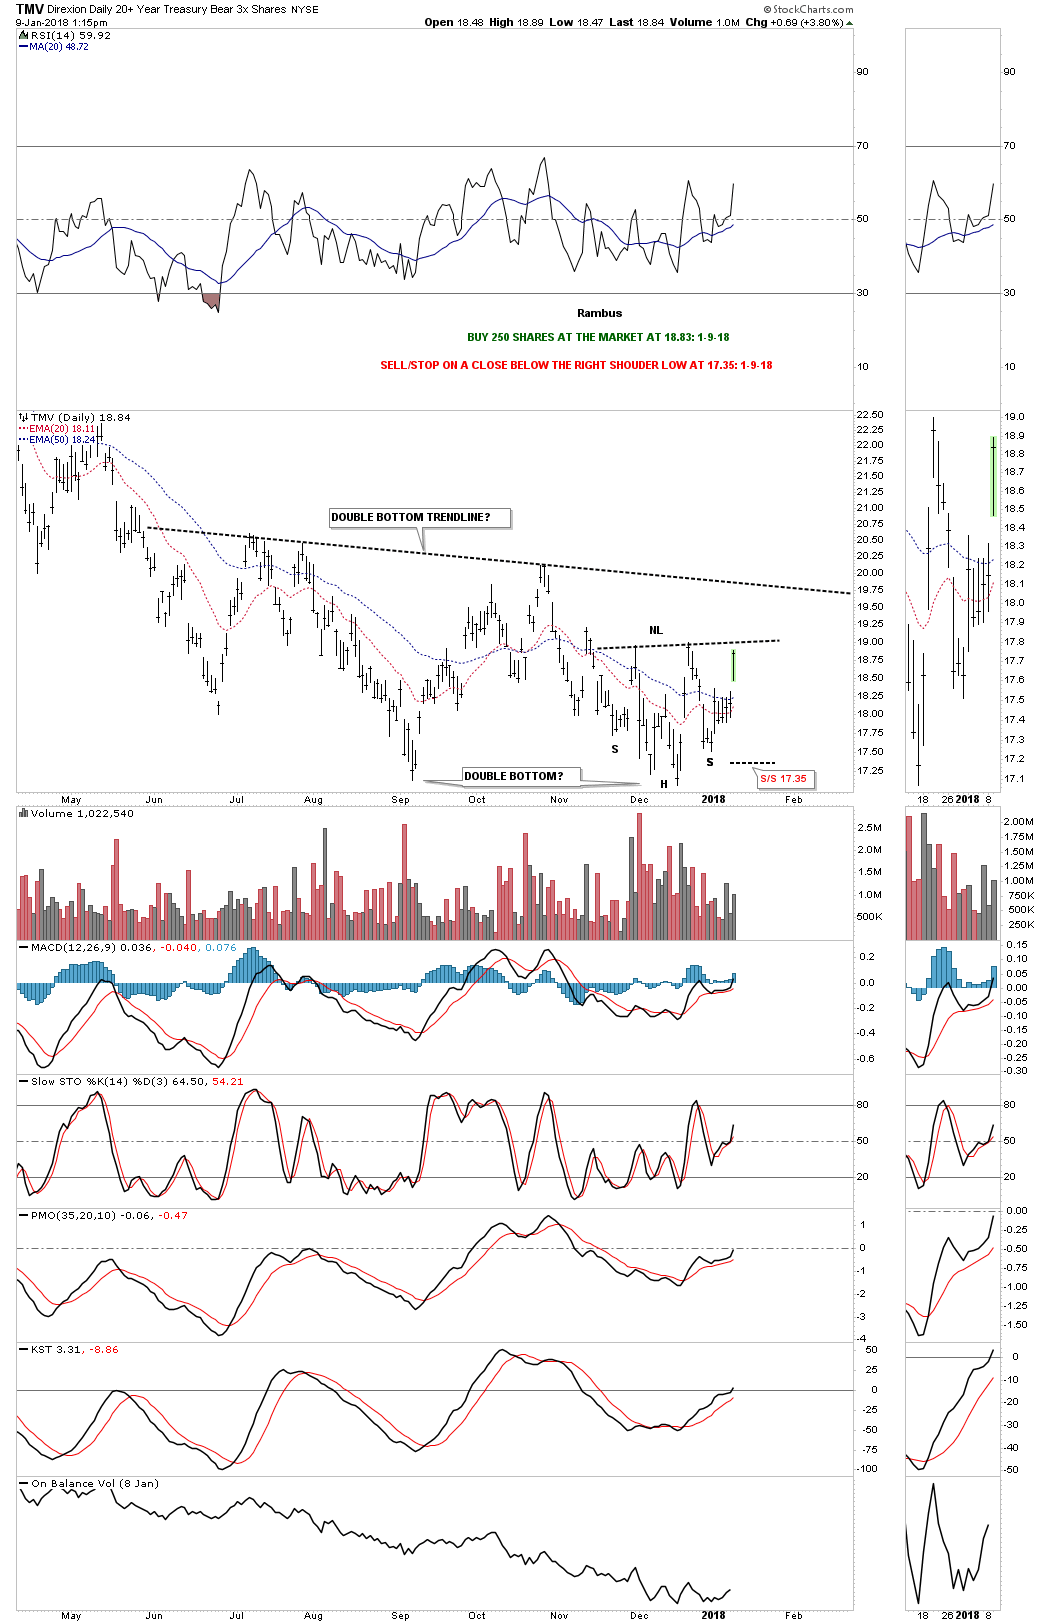
TMV is a 3 X short the TLT 20 year treasure bond etf. This trade is based on the TLT. For well over three years now the TLT has been building out what looks like a massive H&S top with the top of the right shoulder now in play. I’m going to take an initial position and buy 250 shares of TMV, 3 X short the TLT, and buy 250 shares at the market at 18.83 with the sell/stop on a daily close below the right shoulder low on the daily chart for the TMV at 17.35. I’m anticipating the the right shoulder high on the TLT will be the ultimate high. There will be several more entry points if this trades starts to workout.
A second buy point would be on the breakout above the neckline on the daily chart for the TMV. A third buy point would be on a breakout above the double bottom trendline.
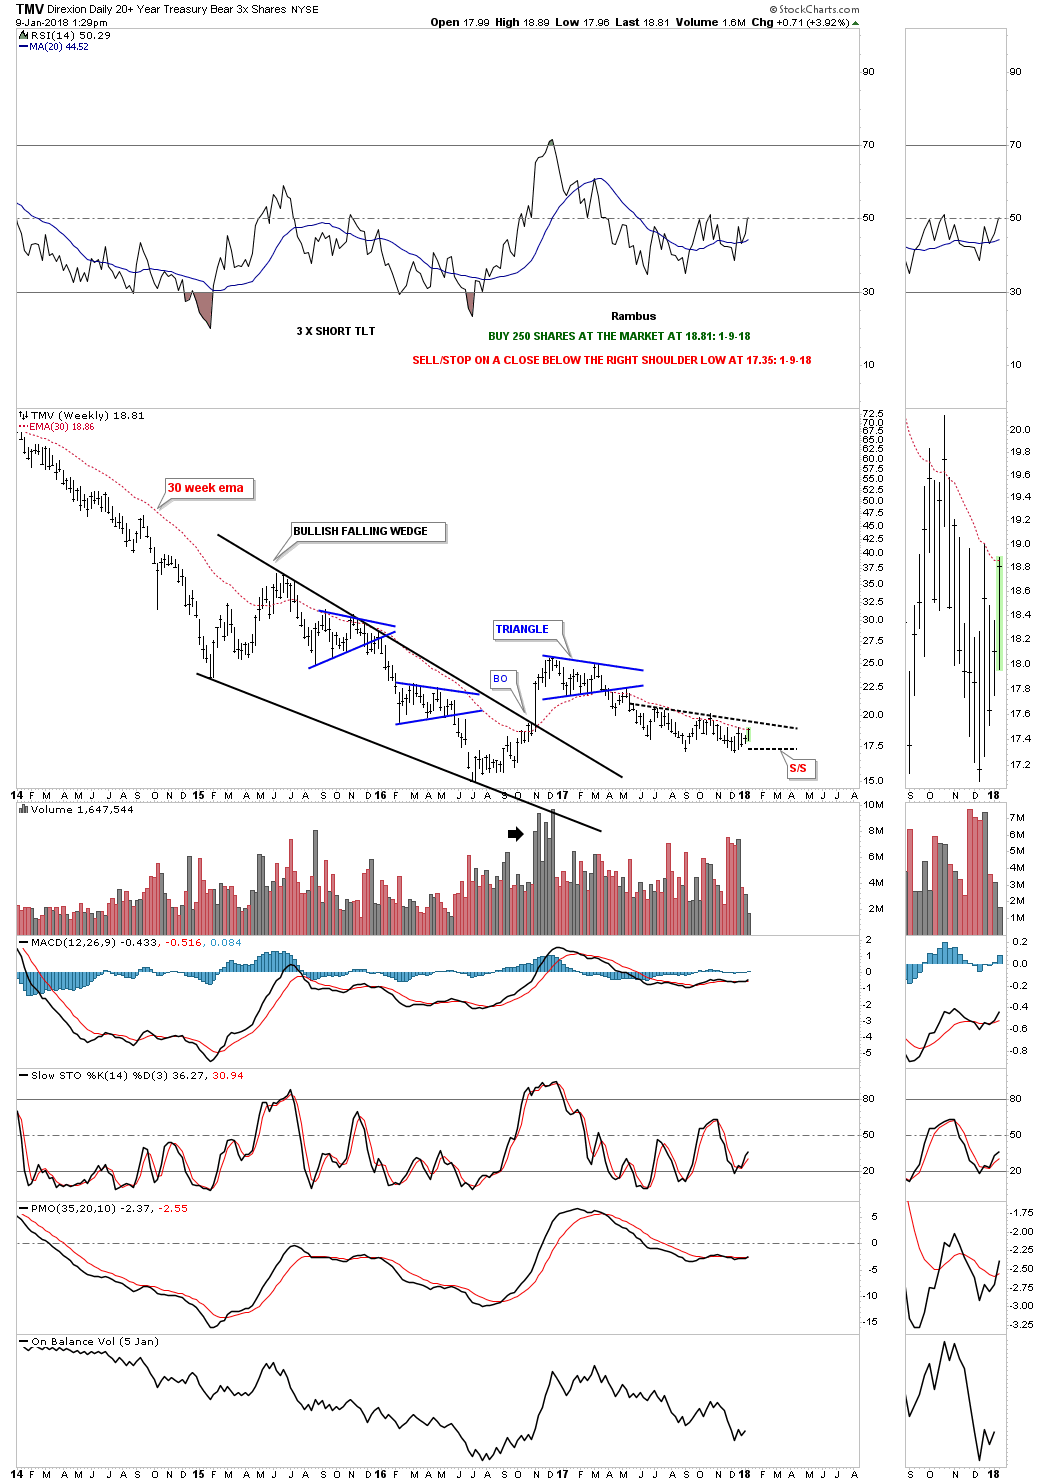
Below is the weekly chart for the TMV. The more conservative members may want to wait for the breakout above the double bottom trendline and the 30 week ema.
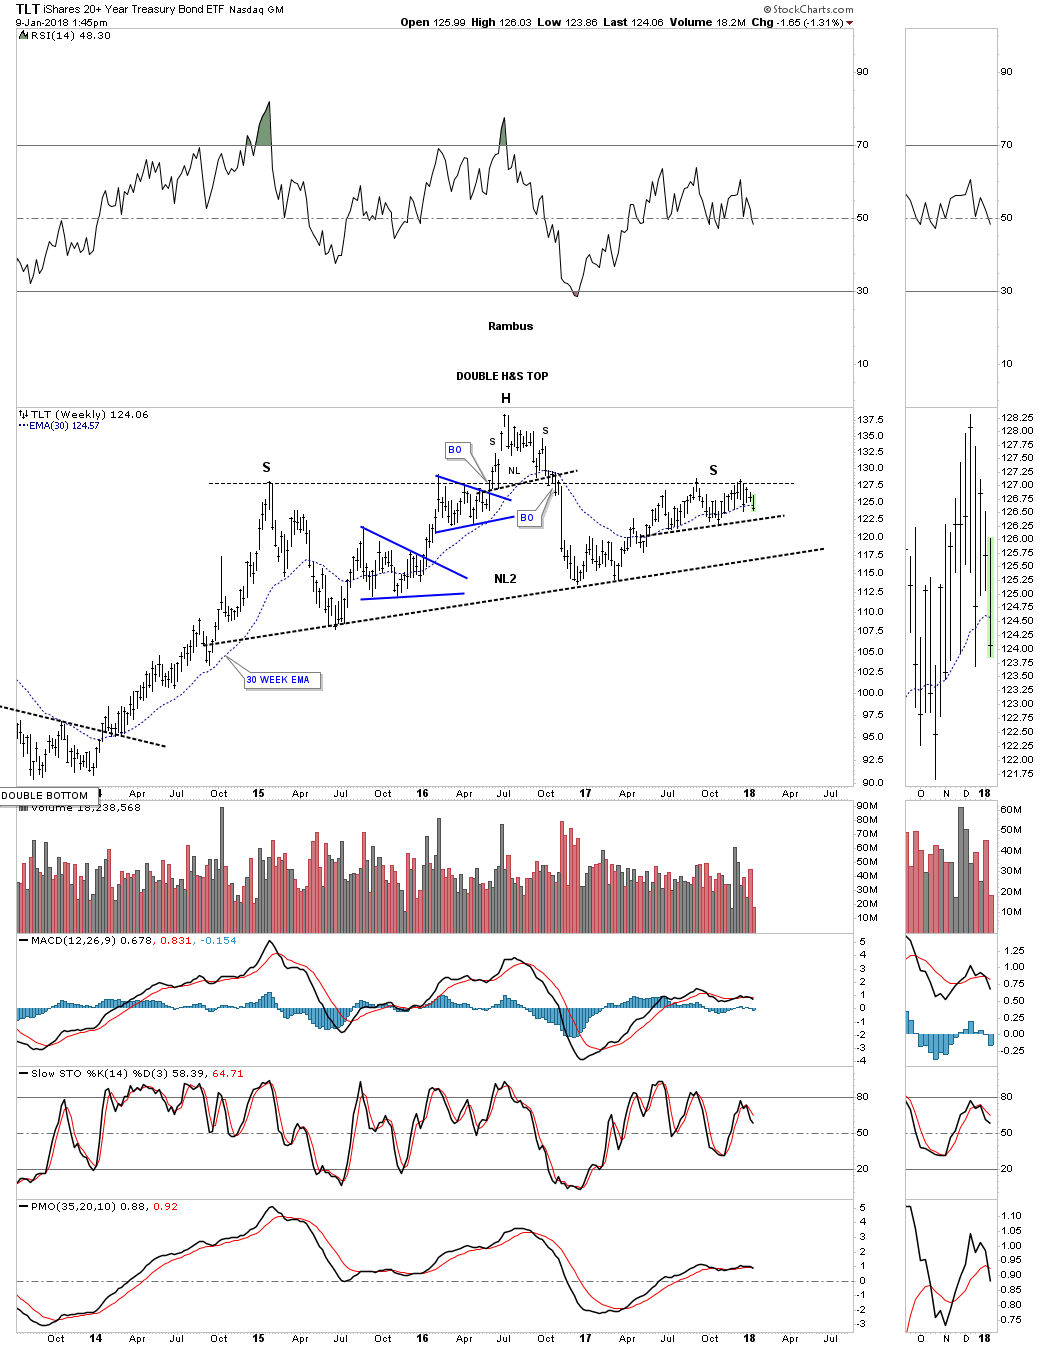
Below is a one year daily chart for the TLT which shows the possible double top right shoulder high that we’ll looked at on the weekly chart. Reverse symmetry may suggest we could see a small bounce off of the neckline as the 200 day ma is also intersecting the neckline.

This next chart is a weekly look at the TLT which puts everything in perspective. There is some nice symmetry forming on this 3 plus year H&S top where both the left and right shoulder highs formed at the same high. This chart also shows you why I’m willing to take an initial position up here toward the possible right shoulder high.
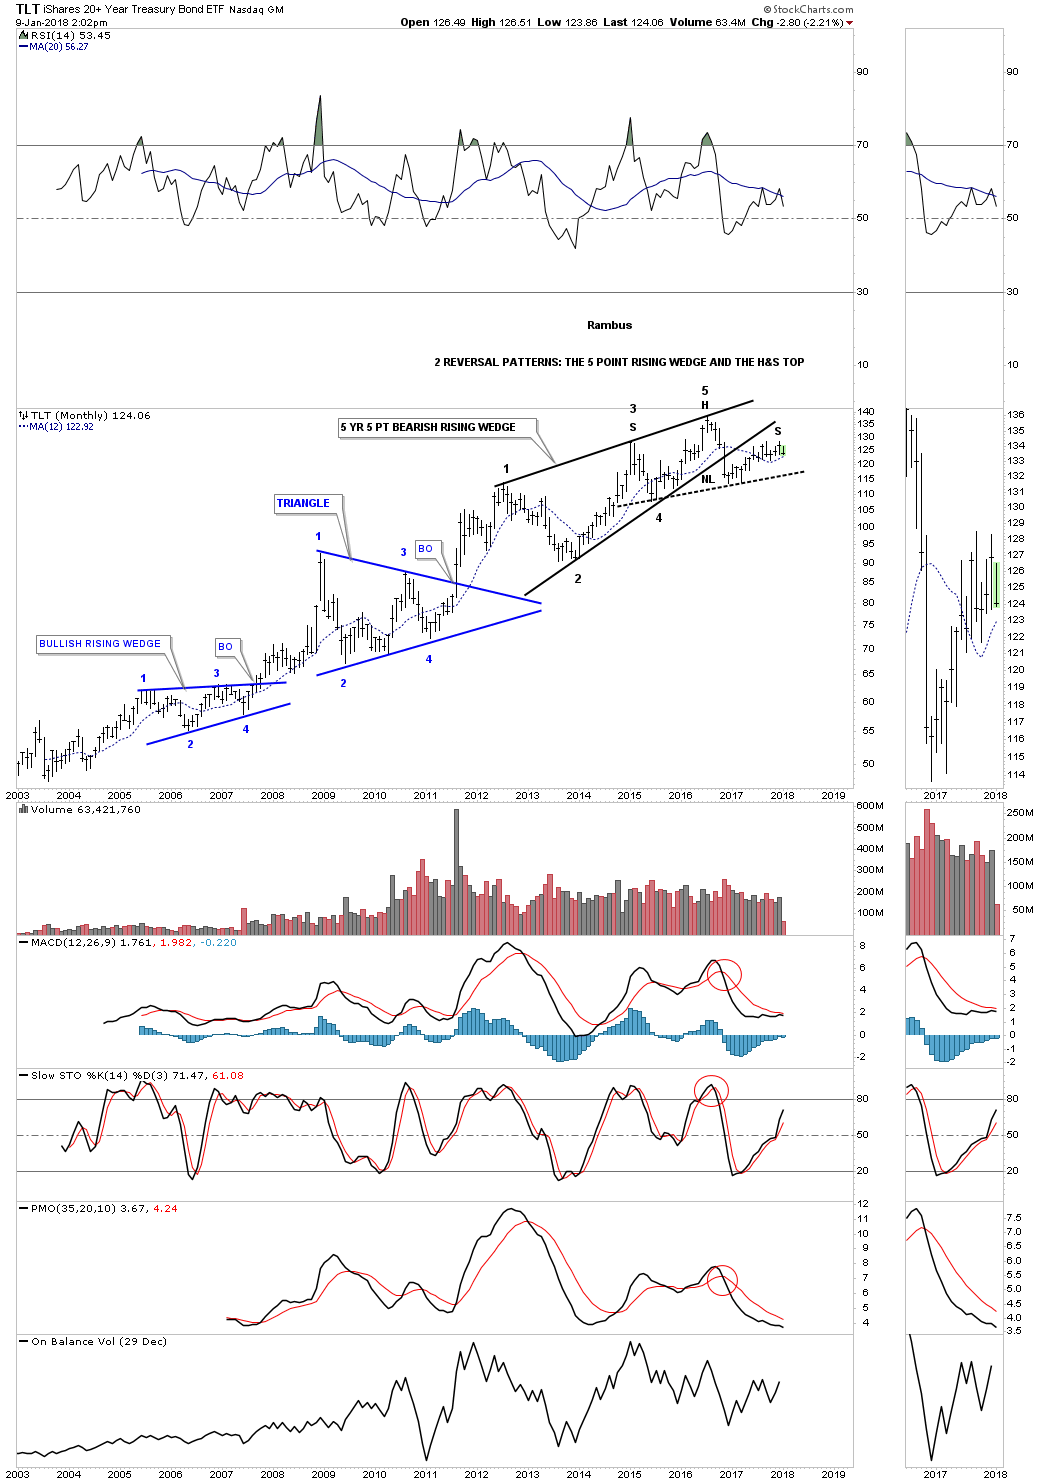
The long term monthly chart for the TLT is showing a possible classic H&S top building out. I’ve shown you many cases that a H&S pattern can buildout with the left shoulder and head forming inside of a wedge pattern, in this case the 5 year 5 point bearish rising wedge with the right shoulder forming on the backtest to the underside of the bottom rail. TLT has fallen just shy of a complete backtest to the bottom rail, but in this case it looks close enough. As you can see my entry point is very early if this very large H&S top plays out. There will be several more good entry points if things start playing as these charts are suggesting. We basically have two separate reversal patterns forming in the same location.

The rally in Gold and gold mining stocks easily surpassed our expectations and targets. The strength has been far more than we anticipated. The gold stocks blew past their 200-day moving averages while Gold blew past $1300/oz. Now it is time to take a technical look and focus on the key support and resistance targets.
The strength of the rebound pushed the miners well beyond their 200-day moving averages and to their June and October highs. GDX is consolidating just below $24 while GDXJ is consolidating just below $35. If this consolidation turns into a correction then GDX and GDXJ could find support at their 200-day moving averages which are at $22.71 and $33.37 respectively. As you can see, should GDX and GDXJ be able to exceed recent peaks then they could rally towards important resistance levels. Those are $25.50 for GDX and $38 for GDXJ.

The rally has been just as strong in Gold as it surpassed resistance in the $1300-$1310/oz zone. Gold closed the week at $1322/oz. Should Gold pause or correct here then the sellers could push the market down to previous resistance but now current support at $1300-$1310/oz. Trendline resistance will come into play near $1340/oz while the 2016 and 2017 peaks would provide resistance in the $1350-$1370/oz zone. 
While we are at it, let us take a look at Silver which exploded past resistance in the mid $16s. Silver will face resistance first at $17.75 then at $18.50. A break above $17.75 and the red trendline is the first step for Silver. The second would be reaching $18.50, a new 52-week high. Next week Silver will face immediate resistance around $17.30 (the October and November highs) but it will have strong support in the mid to upper $16s.

The precious metals complex has made important progress in recent weeks. Markets have broken key resistance levels and have showed no signs of slipping anytime soon. Gold is holding above previous resistance at $1300-$1310/oz while not being far from multi-year resistance in the mid to upper $1300s. The gold mining stocks have reclaimed their 200-day moving averages while consolidating tightly beneath the June and October highs. If and when GDX and GDXJ break those levels then they will be only one step away from a full blown bull market. That step is breaking above the September highs.
In recent weeks our tone has shifted and as such we have accumulated a few new positions. We seek the juniors that are trading at reasonable values and have technical and fundamental catalysts to drive increased buying.
Join me in a look at the long term trends that are currently reversing in gold, silver, dollar, euro and the yen.
https://blog.smartmoneytrackerpremium.com/

2018 will be a year of major volatility in many markets. Stocks are now in a melt-up phase, and before the major bear markets start in virtually all countries around the world, we are likely to see the final exhaustion moves which could be substantial. T
he year will also be marked by inflation increasing a lot faster than expected. This will include higher interest rates, much higher commodity prices, such as food, oil and a falling dollar. And many base metals will strengthen. Precious metals finished the 2-3 year correction (depending on the base Currency) in 2015 and are now resuming the move to new highs and eventually a lot higher.

…also from King World:
ALERT: This Is What Will Trigger The Big Surge In Gold And The Mining Shares


-
I know Mike is a very solid investor and respect his opinions very much. So if he says pay attention to this or that - I will.
~ Dale G.
-
I've started managing my own investments so view Michael's site as a one-stop shop from which to get information and perspectives.
~ Dave E.
-
Michael offers easy reading, honest, common sense information that anyone can use in a practical manner.
~ der_al.
-
A sane voice in a scrambled investment world.
~ Ed R.
Inside Edge Pro Contributors

Greg Weldon

Josef Schachter

Tyler Bollhorn

Ryan Irvine

Paul Beattie

Martin Straith

Patrick Ceresna

Mark Leibovit

James Thorne

Victor Adair