
Stocks & Equities
For Tuesday January 9, 2018
Available Mon- Friday after 3:00pm Pacific
DOW + 103 on 502 net declines
NASDAQ COMP + 6 on 214 net declines
SHORT TERM TREND Bullish
INTERMEDIATE TERM Bullish
STOCKS: Yesterday, I forgot to mention a fairly important indicator. The last 42 years in which the first five days were higher was followed by full year gains 36 times for an 85.7% accuracy rate. The average gain was 14%. In fact, this is actually the best start to a new year since 1987.
So, why so strong? There is great anticipation for major earnings gains as a result of less regulation and the recent tax cut.
That said, the internals are lagging, but that can go on for quite a while.
GOLD: Gold was down $6. The dollar rally is having an effect. We’re switching our evaluation below.
CHART: The S&P 500 was higher again, but there were more declining issues than advancing ones (arrow). That can sometimes be an early warning of some sort of pullback. But, the chart itself, meaning the ultimate indicator remains bullish.

BOTTOM LINE: (Trading)
Our intermediate term system is on a buy.
System 7 We are long the SSO from 110.59. Keep your stop at 113.59
System 9 On a buy signal from Dec. 29.
NEWS AND FUNDAMENTALS: This is a slow week for economic news. Job openings (JOLTS) were 5.879 million, less than the expected 6.038 million. On Wednesday we get oil inventories.
INTERESTING STUFF: Unite liberality with a just frugality; always reserve something for the hand of charity; and never let your door be closed to the voice of suffering humanity. ——–Patrick Henry
TORONTO EXCHANGE: Toronto inched up 2.
BONDS: Bonds collapsed.
THE REST: The dollar was higher. Crude oil surged to a new high.
Bonds –Change to bearish as of Jan. 9.
U.S. dollar – Bullish as of Jan. 3.
Euro — Bearish as of Jan.3.
Gold —-Switch to bearish as of Jan. 9.
Silver-— Switch to bearish as of Jan. 9.
Crude oil —-Bullish as of Dec. 26.
Toronto Stock Exchange—- Bullish as of September 20, 2017.
We are on a long term buy signal for the markets of the U.S., Canada, Britain, Germany and France.

Monetary conditions (+2 means the Fed is actively dropping rates; +1 means a bias toward easing. 0 means neutral, -1 means a bias toward tightening, -2 means actively raising rates). RSI (30 or below is oversold, 80 or above is overbought). McClellan Oscillator ( minus 100 is oversold. Plus 100 is overbought). Composite Gauge (5 or below is negative, 13 or above is positive). Composite Gauge five day m.a. (8.0 or below is overbought. 13.0 or above is oversold). CBOE Put Call Ratio ( .80 or below is a negative. 1.00 or above is a positive). Volatility Index, VIX (low teens bearish, high twenties bullish), VIX % single day change. + 5 or greater bullish. -5 or less, bearish. VIX % change 5 day m.a. +3.0 or above bullish, -3.0 or below, bearish. Advances minus declines three day m.a.( +500 is bearish. – 500 is bullish). Supply Demand 5 day m.a. (.45 or below is a positive. .80 or above is a negative). Trading Index (TRIN) 1.40 or above bullish. No level for bearish.
No guarantees are made. Traders can and do lose money. The publisher may take positions in recommended securities.


This past weekend, I discussed the surge in market exuberance in terms of both individual and professional investors. Of course, such surges in exuberance is generally indicative of the “capitulation phase” as the last of the “holdouts” finally jump back into a market which “can seemingly never go down.”
But therein lies the danger. It worth noting that despite the “hope” of more fiscal support for the markets, longer-term conditions currently persist which have led to rather sharp market reversions in the past.
“There are many factors from economic, monetary, geopolitical, and financial which have ignited each bubble, and bust, period throughout history. However, each bubble had in common the same extreme levels of confidence, exuberance, valuation and price extension that we see today. And they all ended the same, as well.”
Regardless, the market is currently ignoring such realities as the belief “this time is different” has become overwhelming pervasive. Importantly, such levels of exuberance have NEVER been resolved by a market that moved sideways.

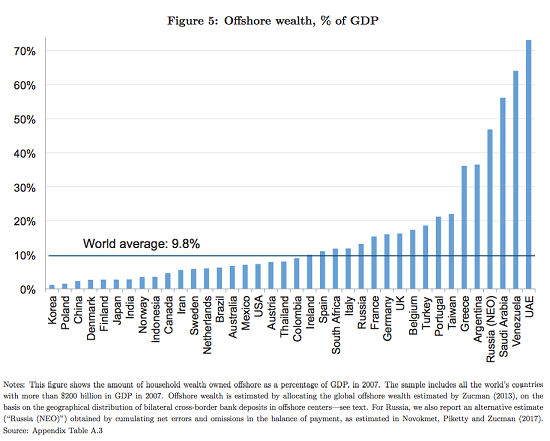
An estimated $8.7 trillion, 11.5 percent of the entire world’s G.D.P., is held offshore by ultrawealthy households in a handful of tax shelters, and most of it isn’t being reported to the relevant tax authorities
After explosive leaks from an offshore firm last year, others in the sector insisted it was a bad apple. Now that claim can be tested.
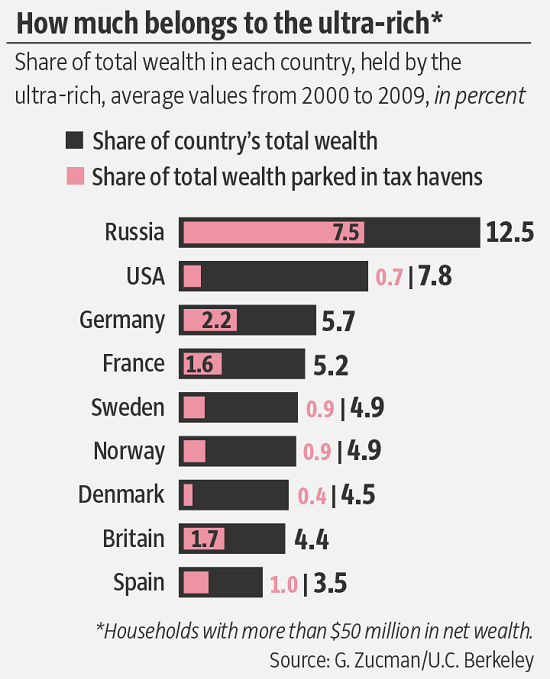
The Paradise Papers expose a business model that lets the few asset-strip the many. Governments have powerful tools to stop this – but do they have the will?
Global Bond Markets to Enter New Phase in 2018
2017 was supposed to be the year that would put an end to modest growth, lukewarm inflation and anemic bond yields. It didn’t live up to the hype. But pressures are building, and that means volatility ahead—as well as opportunity.
Global growth and US growth were solid last year, so the Federal Reserve continued to slowly drain liquidity from the system. The world’s most influential central bank raised official interest rates and began the long process of reversing quantitative easing (QE), which had poured trillions of dollars’ worth of liquidity into the markets after the 2008 global financial crisis.
But counter to expectations and the Fed’s intention, bond yields remained stubbornly low (Display). In the US, long-term Treasury yields fell while shorter-dated ones rose, causing the yield curve to flatten. Prices on equities and high-yield bonds continued to rise, and US and European investment-grade credit spreads tightened as well. Overall, financial conditions were even easier by the end of the year than they had been at the start.

Is the US Economy Heading for a Time Out?
While some investors are concerned about the Fed not making any headway, others have the opposite concern. They’re worried about the flat shape of the US yield curve. That’s because, historically, a flat yield curve has signaled a potential deceleration in economic growth. Could a recession be imminent?
We don’t think it’s time to worry about a looming recession just yet. The curve is still considerably steeper today than it was in the run-up to previous recessions (Display).

So why is the US yield curve so flat? We think it has to do with global QE. In other words, we’re seeing the Fed’s modest tightening activities being offset by the easing still in place by the European Central Bank (ECB) and the Bank of Japan (BOJ).
These central banks are still buying bonds and other financial assets, effectively putting pressure on long-term interest rates—including those in the US. What’s more, there’s still a tremendous amount of liquidity in the US financial system, and it will take time for the Fed to drain it.
Tighter Conditions Ahead—and This Time We Mean It
Over the near term, yields and inflation may remain low and the US curve relatively flat. But with the US economy operating at full capacity, the Fed isn’t going to tolerate these easy conditions for very long. They’ve planned three rate hikes for 2018.
We actually expect them to hike four times to counter global pressures and tap the brakes on the US engine more firmly. Could it take more hikes? Possibly, if the recently passed changes in US tax policy cause growth and inflation to accelerate more than expected. As of now, the Fed does expect growth to increase, but their inflation forecast hasn’t changed after the passing of the GOP tax plan.
At some point, other major central banks will also begin to shift from easing to tightening, which will remove some of these headwinds for the Fed. The reduction of monetary accommodation around the world should play out gradually, however, because central banks move at different speeds.
The next in line is the ECB. With euro-area growth improving, we expect the central bank to finish tapering its monthly bond purchases in the second half of the year and to begin raising official rates in 2019.
And in the not-anytime-soon category: The BOJ is likely to maintain its policy of capping long-term bond yields, since core inflation remains well below target, despite improving growth. And China’s policymakers will focus on the quality of growth and on reining in excessive leverage, especially in the shadow banking system.
Policy variance creates dispersion in global rate markets. And dispersion means opportunity for global bond investors, even as rates begin to rise.
The currency markets will also be an important factor in 2018. The dollar was unusually weak last year, given the opposing monetary directions of the Fed relative to the ECB and BOJ. The weak dollar helped global asset prices in 2017; a change in direction in 2018 might alter that outcome.
How to Behave in the Post-QE Era
With central banks normalizing monetary policy, some investors are tempted to put all their eggs in the credit basket. But corporate bond valuations are stretched, and the US corporate credit cycle is in its late stages, so investors should probably think twice about that. Should bond investors sit on the sidelines instead?
Not at all. By diversifying across multiple sources of income and being very selective, it’s possible to ride out waves of volatility without taking on undue risk. Here’s how:
Invest in a barbell strategy if you’re an investor who wants to maintain a lower risk profile. This approach balances interest-rate risk and credit risk and alters the weightings as valuations and conditions change, continually adjusting the balance as needed. As rates rise, a barbell strategy includes US Treasuries and other government bonds, which provide important diversification to credit exposure no matter the environment.
Over the medium term, more than 90% of US Treasury returns come from the yield. This means that rising rates can dramatically boost income for investors who are not primarily focused on short-term price fluctuations.
What’s more, higher rates will eventually slow growth and put an end to the credit cycle. In these periods, investors can rebalance their portfolios by selling US Treasuries and buying credit assets at discount prices.
Diversify your high-income portfolio, and be selective. When yields are low, valuations are high and dispersion is on the rise, it’s more important than ever to exercise caution. Investors should resist the urge to reach for yield and instead concentrate on maximizing opportunity and reducing risk. A global, multi-sector strategy can provide access to multiple sources of income and return.
We see value in US securitized assets, emerging-market (EM) debt and subordinated European financial bonds. Subordinated European banks offer attractive yields to compensate investors for the risk they’re taking by buying a bond further down the capital structure.
US high yield is in the later stages of the credit cycle. That means investors should be choosy about what they buy. But they shouldn’t avoid this market altogether. High-yield bonds are less sensitive to interest rates than other bonds are. And their steady income can enhance total portfolio returns even as rates rise.
What not to do? Don’t replace your high-income strategy with a portfolio of leveraged bank loans in the hopes that bank loans will protect you against rising rates. Bank loans have failed to meet those expectations.
Allocate to emerging-market debt (EMD). EM bonds delivered strong returns last year. We think the sector has more potential, thanks to improving economic fundamentals, stable or falling inflation, and critical reforms among EM countries—reforms that have reduced their vulnerability to external shocks.
With global economic and geopolitical risks rising, however, investors will have to exercise caution. Fortunately, political risk tends to be country specific. This means investors can limit the volatility that any single country’s political risks might generate by being selective and by diversifying across EM countries.
Indeed, EMD has evolved so much over the past decade that it is now itself a global, multi-sector opportunity set offering the ability to diversify by country, credit and currency. Many developing countries have, in a sense, already emerged and are essential engines of global growth. In our view, a fixed-income portfolio today would be incomplete without them.
Managing Transition
Signs point to 2018 as an important transition year for markets. For nearly ten years following the unfolding of the global financial crisis in 2008 and the subsequent Great Recession, monetary policy has been extremely stimulative. That era has come to an end.
While this change in monetary policy may not be terribly important to global economic growth, we do believe that it could have an impact on asset prices. It will certainly help drive volatility of those asset prices up from the abnormally low levels of 2017.
Investors who are prepared to seize the opportunities and navigate the challenges ahead will find the transition phase easier.
The views expressed herein do not constitute research, investment advice or trade recommendations and do not necessarily represent the views of all AB portfolio-management teams.
Highlights:
Base metals had a strong finish in 2017, a year when the copper and zinc prices increased by over 30%, the highest in over 3 years for copper and in 10 years for zinc. Nickel also outperformed, rising by 28%. The performance in 2017 was underpinned by supply disruptions for copper, lack of production growth for zinc, and declining global inventories, within the context of a positive outlook for Chinese, and global growth.
- Strong copper demand in 2018. It is estimated that China’s copper demand (which accounts for around 50% of global copper demand of 23.5Mt) could grow by up to 3% in 2018, from around 2% in 2017. Codelco, Chile’s state-owned copper miner, sees a sustained increase in copper deficits, supported by growing copper deficits. As a result, the company says the copper price may test records above $10,000/t ($4.50/lb) in 2018.
- Potential for supply tightness. Over 30 labour contracts, covering 5Mt of mine supply of copper are due to expire in 2018, mostly in Chile and Peru. Notably, the Escondida contract expires in June. In China, scrap import restrictions and closures related to winter pollution will contribute to tightness in the copper market.
- Zinc continues to have the best fundamentals among the base metals. Global zinc stocks were down 59% in 2017, ending the year at 8.2 days of consumption. Chinese zinc imports increased by 43% in the first 11 months of 2017, and continue to be strong.
- Outlook is positive. We expect strong global manufacturing output, supported by resilient European and U.S. PMIs, as well as sustained metals demand from China to provide further impetus for a metals rally in 2018Weekly Performance.

Precious metals had a strong start to the year, with the price if gold rising above the $1,300 on December 29th amid a falling U.S. dollar and the prospects of another interest rate hike less following worse-than-expected payroll data this morning. This follows a positive 2010 for precious metals with gold (up 11%) and silver (up 4%) finishing at $1,3XX and $17.XX per ounce respectively. Palladium soars. Platinum prices rose almost 50% on the back of robust demand for catalytic converters and limited supply. Palladium prices tested the $1,100 per ounce level on Thursday, with some commentators speculating it could overtake gold, before settling at $1,090 (up X%) on Friday. In contrast, platinum prices finished the year where they began at $907 per ounce
….click here for the full report

-
I know Mike is a very solid investor and respect his opinions very much. So if he says pay attention to this or that - I will.
~ Dale G.
-
I've started managing my own investments so view Michael's site as a one-stop shop from which to get information and perspectives.
~ Dave E.
-
Michael offers easy reading, honest, common sense information that anyone can use in a practical manner.
~ der_al.
-
A sane voice in a scrambled investment world.
~ Ed R.
Inside Edge Pro Contributors

Greg Weldon

Josef Schachter

Tyler Bollhorn

Ryan Irvine

Paul Beattie

Martin Straith

Patrick Ceresna

Mark Leibovit

James Thorne

Victor Adair