
Gold & Precious Metals

In his latest letter to clients GMO’s Jeremy Grantham conceded that stocks are on the verge of a “late bubble surge” melt-up, and as a result the upside from here before the next crash could be as much as 60% during the final phase of the current bubble.

….also from ZeroHedge: Europe Becomes Victim Of Russia’s Newest Oil Strategy

 Traders and investors everywhere are spooked by volatility whenever it rears its head. We hear about it every time stocks take a tumble, even if that doesn’t happen so much these days. So the Investopedia definition I’ll show you is probably the last thing they’re thinking of.
“Volatility: A statistical measure of the dispersion of returns for a given security or market index. Commonly, [emphasis mine] the higher the volatility, the riskier the security.”
Now, that doesn’t sound so scary, does it?
Volatility is nothing more than a statistical tool that shows how much a stock goes up or down. Yet many see volatility as a bad thing, because they equate it to risk. And risk is bad for us, right?
Well, sometimes risk is bad. But to the smart investor, volatility is a difference maker. Because without it, you might as well just buy a CD. More importantly, you have zero chance of beating the market. And where’s the fun in that?
That’s right: Without volatility, you don’t beat the market.
That’s why one of my 10 Trading Commandments is “Volatility is a trader’s best friend!”
Now, let me prove it to you…
Directional Volatility Takes You “FAR” as a Trader
Think about volatility as merely the distribution of a stock’s returns. The wider the distribution, the higher the volatility.
And the higher the volatility, the more the stock is moving, and that means we’re getting paid if it’s moving in our direction.
To beat the market, especially using options, we want volatility on our side. I call it the “FAR Principle” – fast, aggressive, and right.
I want a fast move to happen before my option expires. I need an aggressivemove that I can leverage with an option. And I need the move to be in the right direction to agree with my call or put.
Having volatility in my corner, along with picking the right direction, is how I (and you) get paid as an investor.
How to Find Volatility Before It Happens
 Understanding how volatility leads to profits is one thing. The key, though, is getting on board a stock before the volatility hits.
Watching a big move from the sidelines is no fun at all; you need to learn how to spot volatility before it happens.
One of my favorite indicators to identify potential volatility is the Bollinger Band.
This indicator measures volatility by looking at the distribution of price changes over a certain period.
I won’t get into the details here – you don’t need that stuff to start using it in your trading and investing. It’s enough to say that a break above the top Bollinger Band is often followed by a volatility rally, while a move below the bottom band often initiates a volatility sell-off.
But I go beyond these breaks above or below the bands. I also monitor the distance between the top and bottom bands to tell me when the volatility surge is about to happen. The tighter the bands get, the higher the probability that a volatility breakout is coming. Monitoring the distance between the bands positions me ahead of the wave of a volatility breakout.
But once we have our read on the Bollinger Bands, we still need to answer one more question – a big one, at that: Will it be a volatility rally or sell-off? This is where a few other technical tools come into play.
While keeping it simple is often the best approach, I tilt the scales in my favor by adding two straightforward technical criteria to find bullish FAR moves.
First, I want a stock that is trading above its 50-day moving average. Second, I want to see the 50-day in an uptrend. Combining those criteria with a break above the upper Bollinger Band increases the odds that a bullish volatility rally is in the works.
Here are a few stocks I’ve already analyzed for you, so you can try this yourself…
Adobe Systems (Nasdaq: ADBE) Breaking Out
Let’s look at Adobe Systems Inc., a stock that I feel is currently on the verge of a volatility rally. Here’s a chart of ADBE shares showing the Bollinger Bands andthat 50-day moving average.
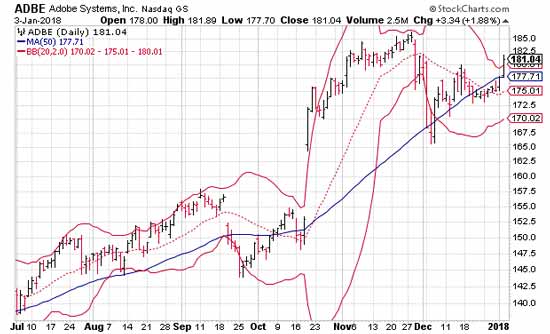
- This week, the distance between Bollinger Bands is approaching an annual low. This tells me the stock price is coiling like a spring, getting ready to make a big move.
- The 50-day moving average is in a very strong uptrend.
- On Wednesday, ADBE rallied well above the 50-day and broke above its top Bollinger Band.
Based on these bullish technical developments, I’m looking for a volatility rally that will push the stock above the $185 level over the short term.
If you want to ride along and make some fast money, consider the February $180 call.
There are all sorts of ways a stock can tell you that it wants to make you money. This is just one of them.
Next week, I’ll talk about how I use what they call “short interest” to put the trading odds in my favor… and big profits in my account. Until then, make volatility your friend; you’ll love the gains that are possible.
Precious metals expert Michael Ballanger likes what he sees for gold in 2018’s first week of trading.

While the moniker for this missive is “Gold and Gold Miners,” I just sit back in absolute AWE as the global equity investors (otherwise known as “Stock jockeys”) have decided that “cash is TRASH!” and despite a massive “miss” in the employment numbers this morning, within seconds of the release, the spin doctors manning the equity trading desks deemed that number “bullish” because it is less inflationary and may cause the Fed to “pause.” So dollar-yen rallies, the USD index has a minor pop, gold sells off, and stocks come out of the gate up another 0.25% with all of the bubblicious bravado of a high school quarterback getting his first win.
The chart of the S&P shown below is a classic illustration of what occurs when global central banks open up the monetary spigots and flood the world financial markets with unchallenged credit and liability-free liquidity. It is this “inflationary spiral” that enhances “the replacement value of equities” and sends literally everything skyward. Since the two biggest collateral risks to the banks are real estate and stock buyback loans, it is no surprise that this tsunami of phony, counterfeit currency of all colors indiscriminate of flag has not only mitigated those risks but also floated the underlying collateral into the ozone layer. Don’t forget that even Ben Bernanke admitted that no one could predict the outcome of all of that “quantitative easing” that saved JPM and Goldman and Citi and BofA from disappearing from the face of the earth and now we are seeing what currency debasement exercises are truly all about. Record highs EVERYWHERE (except gold and silver) as monetary inflation sows its price inflation seeds.
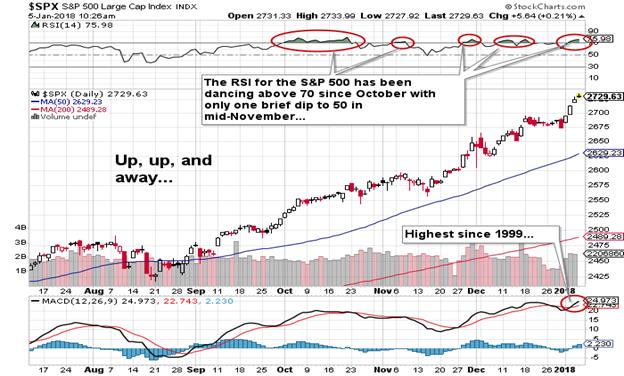
My buddy David Chapman was the first to predict this final-stage blow-off top or “melt-up” and is quick to remind me that RSI has stayed in the 70s for the S&P and NASDAQ for many, many weeks before succumbing to profit-taking and that if this truly is a new bull move for gold, the HUI [Amex Gold BUGS Index] (and the Gold and Gold Miner ETFs) can too stay elevated above 70 for quite awhile. I can’t recall the period of time when the RSI resided in or neared 70 for more than a few weeks before correcting but the S&P chart illustrates overbought conditions starting in the typically weak October period with RSI breaking above 70 six times by year-end. That, my friends, was too much liquidity chasing too few stocks—and it isn’t the “too few stocks” that should be deemed the scapegoat.
David Tepper came out this morning with the “stocks are as cheap today as they were in 2016” mantra, citing “extraordinarily low interest rates” and “low inflation” as the reasons for this call but as I hurled a half-eaten Western sandwich at the monitor sending Fido and the missus running for the sanctuary of locked powder rooms and subterranean foxholes, the sounds of exploding coffee mugs and shattering ceramic plates reverberating throughout the halls, I was immediately screaming back at him that he should “come down off that cloud of reefer smoke” and recognize that low yields are a function of one thing and one thing alone—government intervention. The “low inflation” meme is a function of manufactured CPI and PPI numbers not even remotely close to reality. However, stocks are now gunning for Dow 26,000 so my emotive protests and vitriolic outbursts are useless and a waste of time and breath. I am NOT playing in the Wall Street cesspool and there is NOTHING that will deter me.
Another headline that caught me off guard tonight was the ZeroHedge article stating that incoming Fed Chairman Jerome Powell has admitted that “The Fed Has A Short Volatility Position” and it can be accessed here. This incredible admission basically throws down the gauntlet and says “Do we manipulate markets? Of COURSE we do or stocks would CRASH!” Read the part in the article where he says that Fed behavior is “encouraging risk-taking” and then let’s have a debate over why market forecasters (including technical analysts) stand zero chance in calling a top to this current fiasco. Not one CNBC commentator could ever offer anything of value other than predicting when the Fed was going to cease and desist in tampering with what should be free market economics. Earnings, cash flow, price-to-book, price-to-sales, dividends—wrap them all up and throw them into the waste bin of stock market analysis whose traditional tools have gone the way of the buggy whip, the corset, and the trusted Hollywood executive.
I thought to myself that the very second that Powell allowed that statement to be entered into the FOMC minutes, it was the final thumb-nosing of the die-hard free market advocates like me. The blatancy of that admission is due now to be followed up with a comment like “Why on earth would anyone not want to own stocks?” And Donald Trumps tweeting that “Dow 30,000 is next” really sounds like the passions of a true swamp-drainer, doesn’t it? Lastly, to read all of this and maintain that gold and silver are NOT interfered with by the 33 Liberty Street robots is to maintain that the world is flat and Trump still has all his hair.
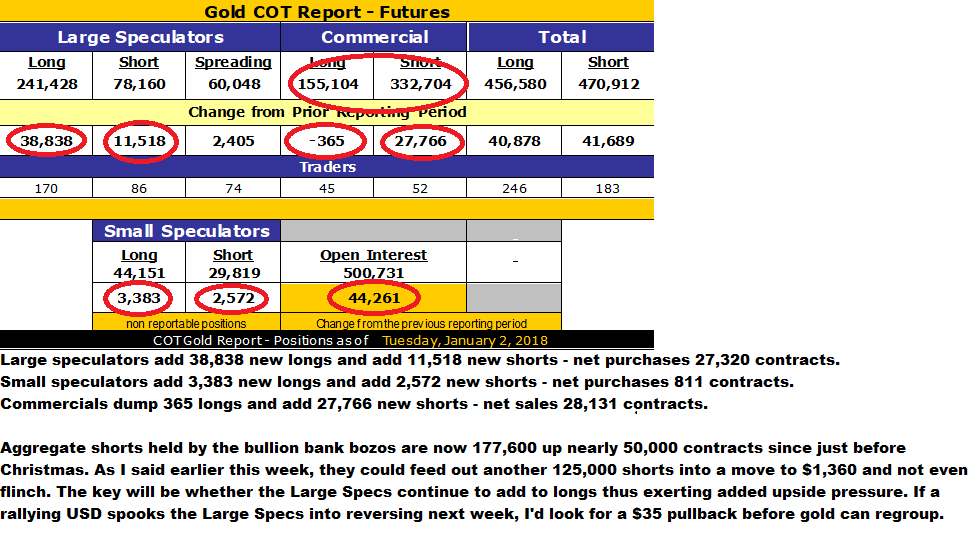
Tonight’s COT was pretty much as expected for gold with the Commercials providing all of the supply sought after by the big speculator accounts such as technical funds and of course the hedgies. I still look for a strong January but as I said in the above COT notes, this could turn south in a heartbeat so call options have been trimmed to reflect zero costs and leverage has now been removed. I have a $17.50 stop on the remaining JNUG (Direxion Daily Junior Gold Miners Bull 3X ETF) and a $32 stop on NUGT (Direxion Daily Gold Miners Bull 3X ETF). I would not short gold or silver in here despite the return of Commercial trader hostilities because there appears to be some serious money piling into the long side. Even the COT report showed that gross longs by the Large Specs was 11,072 contracts greater then gross sales by the bullion banks and that is pretty impressive.
With everything in full “melt-up mode,” one might have expected that the gold and silver stocks would be able to join in the fun but as we have discussed countless times, with the cryptos on fire and small caps finally participating, the competition remains fierce keeping the HUI under 200 and mildly lower on the day.
All in all, to close out the first trading week of 2018 north of $1,320 bodes well for our sector. If we can apply the “January Barometer” to gold, a close above $1,320 January 15 and a subsequent higher close at month-end would be a superb omen for the balance of the year. In fact, it has been such an abnormally decent week that I looked down to see Fido resting in the hallway and my partner out of the powder room and puttering in the kitchen. It would appear that she was rooting around in the drawers looking for that old venerable rolling pin she affectionately named “The Attitude Changer.”
I will now be forced to pray for better markets or retrieve my old leather hockey helmet from the attic. Such is the lot of the precious metals bull.
Originally trained during the inflationary 1970s, Michael Ballanger is a graduate of Saint Louis University where he earned a Bachelor of Science in finance and a Bachelor of Art in marketing before completing post-graduate work at the Wharton School of Finance. With more than 30 years of experience as a junior mining and exploration specialist, as well as a solid background in corporate finance, Ballanger’s adherence to the concept of “Hard Assets” allows him to focus the practice on selecting opportunities in the global resource sector with emphasis on the precious metals exploration and development sector. Ballanger takes great pleasure in visiting mineral properties around the globe in the never-ending hunt for early-stage opportunities.
Disclosure:
1) Statements and opinions expressed are the opinions of Michael Ballanger and not of Streetwise Reports or its officers. Michael Ballanger is wholly responsible for the validity of the statements. Streetwise Reports was not involved in any aspect of the article preparation. Michael Ballanger was not paid by Streetwise Reports LLC for this article. Streetwise Reports was not paid by the author to publish or syndicate this article.
2) This article does not constitute investment advice. Each reader is encouraged to consult with his or her individual financial professional and any action a reader takes as a result of information presented here is his or her own responsibility. By opening this page, each reader accepts and agrees to Streetwise Reports’ terms of use and full legal disclaimer. This article is not a solicitation for investment. Streetwise Reports does not render general or specific investment advice and the information on Streetwise Reports should not be considered a recommendation to buy or sell any security. Streetwise Reports does not endorse or recommend the business, products, services or securities of any company mentioned on Streetwise Reports.
3) From time to time, Streetwise Reports LLC and its directors, officers, employees or members of their families, as well as persons interviewed for articles and interviews on the site, may have a long or short position in securities mentioned. Directors, officers, employees or members of their immediate families are prohibited from making purchases and/or sales of those securities in the open market or otherwise from the time of the interview or the decision to write an article, until one week after the publication of the interview or article.
Charts and images courtesy of Michael Ballanger.
The U.S. gold market suffered a net deficit this year compared to a small surplus in 2016. This was quite interesting because U.S. physical gold demand will be down considerably this year. In 2016, total U.S. gold demand was 212 metric tons versus an estimated 150 metric tons this year. The majority of the decline in U.S. gold demand is from the physical bar and coin sector that is down 56% in the first three quarters of 2017 compared to the same period last year.
So, why will the U.S. gold market suffer a deficit if gold demand is down sharply this year? Well, it seems as if the culprit is the huge increase in net gold exports. Last year, the U.S. imported 374 metric tons (mt) of gold and exported 398 mt for a net 24 mt deficit. However, this year, estimates for U.S. gold imports will fall to 250 mt while exports increase to 475 mt. Thus, the U.S. net export deficit will be 225 mt in 2017:

However, if we look at all the data in the chart above, the U.S. gold market will experience a net 76 mt deficit in 2017 versus a 44 mt surplus last year (bars right-hand side of chart). Again, we can see that U.S. gold imports are estimated to decline significantly this year to 250 mt compared to 374 mt in 2016. Furthermore, total U.S. gold exports are forecasted to increase to 475 mt this year versus 398 mt in 2016.
When we factor in U.S. gold mine supply, domestic consumption, and gold scrap supply, the market will go from a small 44 mt surplus in 2016 to a 76 net deficit this year.
So, the question remains… what happens when the markets crack, and retail investors flock into Gold ETF’s as well as surging gold bar and coin demand?
This happened in the first quarter of 2016 when the Dow Jones Index only fell 2,000 points in a few months. Gold ETF inflows surged to the second highest quarterly amount ever at 350 mt. The all-time record of quarterly Gold ETF inflows took place during the first quarter of 2009 when the Dow Jones was crashing towards 6,600. During the Q1 2009, Gold ETF flows were a staggering 465 mt.
While precious metals sentiment is currently depressed due to the surging Stock and Cryptocurrencies, at some point, we are going to see a crash in these two markets. The amount of leverage in both markets is off the charts.
I believe the next market crash will cause more investor FEAR than ever. We could see Gold ETF inflows surge above 500 mt while physical bar and coin demand beat all records.
Interesting Chart On U.S. Mine Worker Gold & Silver Productivity
When I was looking at the U.S. Gold Market data, I came across some interesting statistics on worker mine productivity. According to the USGS data, the U.S. gold industry employed 12,000 mine workers in 2016 to produce 7.1 million oz (Moz) of gold. In the U.S. silver mining industry, 785 workers produced 23.2 Moz of primary silver. While total U.S. silver production was 37 Moz in 2016, 13.8 Moz was a by-product of base metal and gold mining.
In the USGS 2014 Silver Yearbook, they break down the top silver mines in the United States. There were only three primary silver mines in the country. These included the Couer’s Rochester mine in Nevada, Hecla’s Lucky Friday Mine in Idaho and American Silver Corp’s Galena mine, also in Idaho. The combined silver production from these three primary mines was 23.2 Moz.
If we take the number of mine workers and divide by U.S. gold and silver production, we have the following:

Each mine worker in the gold industry produced 595 oz in 2016 versus 29,550 oz of silver. Thus, each mine working in the primary silver industry in the U.S. provides 50 times more silver than their counterpart in the gold industry. By taking this a step further, each U.S. mine worker produced 1.6 oz of gold a day compared to 81 oz of silver.
Not only does it take a lot more human labor to produced gold than silver, it also takes a lot more fuel. According to data, I put together for 2014, Barrick consumed nearly 21 gallons of diesel to produce one ounce of gold while Pan American Silver only consumed 0.2 gallons of diesel to produce an ounce of silver. Thus, it takes 100 times more diesel to produce gold than silver:

Investors need to understand that the price of gold and silver are based on their cost of production, not the ratio extracted out of the earth. For example, the world produced 886 Moz of silver in 2016 compared to 104 Moz of gold. That is a silver-gold mine ratio of 8.5 to 1. Some readers suggest that the price of silver should rise to the same extraction ratio to gold. Thus, that would be approximately $154 silver.
However, the reason gold and silver were valued closely to the ratio they were extracted out of the earth in the past was due to the mining method. In the past mining was done mostly with human and animal labor. Thus, the 10-15/1 historic gold-silver price ratio was valued based on the extraction ratio. Today, the energy we use is mostly from coal, natural gas, and oil. These carbon-based fuels have distorted the cost of production.
According to my last estimate, the primary gold mining industry’s breakeven was between $1,100-$1,150, and the primary silver mining industry was $15-$17. Thus, the cost of production ratio is 70/1. The gold-silver cost ratio is very close to the current gold-silver price ratio of 76/1.
Lastly, the cost to produce gold and silver will no longer function as their MARKET VALUE in the future. The value of most commodities are based on their cost of production, but gold and silver also act as high-quality STORES OF VALUE. When investors finally realize that their wealth investing in STOCKS, BONDS, and REAL ESTATE will continue to vaporize when the stock markets eventually crash, then we will finally see silly crypto price moves in the precious metals.
Check back for new articles and updates at the SRSrocco Report.


-
I know Mike is a very solid investor and respect his opinions very much. So if he says pay attention to this or that - I will.
~ Dale G.
-
I've started managing my own investments so view Michael's site as a one-stop shop from which to get information and perspectives.
~ Dave E.
-
Michael offers easy reading, honest, common sense information that anyone can use in a practical manner.
~ der_al.
-
A sane voice in a scrambled investment world.
~ Ed R.
Inside Edge Pro Contributors

Greg Weldon

Josef Schachter

Tyler Bollhorn

Ryan Irvine

Paul Beattie

Martin Straith

Patrick Ceresna

Mark Leibovit

James Thorne

Victor Adair