
Asset protection
 If you look at the stock and asset markets, as Donald Trump tends to do (and as Barack Obama did, too), you’d think all is fine with the world. The Dow Jones Industrial Average rose about 24 percent this year. The Dow Jones U.S. Real Estate Index rose 6.20 percent. The price of one Bitcoin rose about 1,646 percent.
On the flip side of that euphoria however……

 There are very few sellers left
There were very few sellers left in January 2016 when the devastating “forever bear” was about to end. Six months later and a 150% rebound in the large caps and 200% rise in the juniors (GDXJ) provided sellers an opportunity. They drove the miners and juniors down by 40% to 45% in less than five months. However, both GDX and GDXJ have been able to hold above that low multiple times. GDX has held $21 four times! GDXJ has held $29.50 twice in solid fashion.
The bears had multiple opportunities in 2017 to push the miners lower but the miners held above their December 2016 lows and maintained the 62% retracement of the 2016 surge. The miners did not break out in 2017 but they held key support multiple times and the latest rebound suggests selling power has dried up.
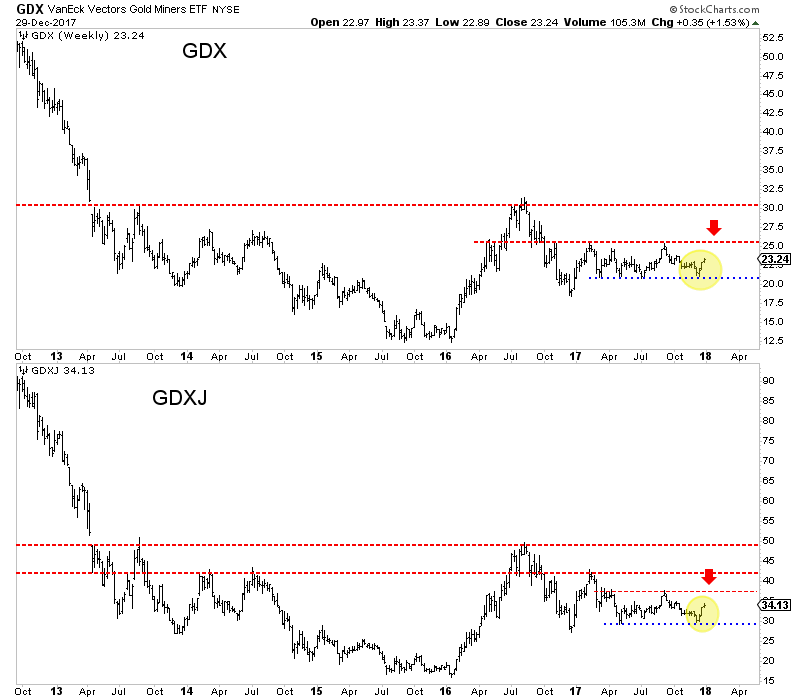
The recovery pattern following a mega-bear market bodes well for gold stocks in the second half of 2018
In November we wrote about this history and the potential implication for gold stocks in 2018 and beyond. The mega bear markets that compare to gold stocks from 2011-2016 with respect to price (+80% decline) and time (+2 years) follow a distinct pattern. The initial rebound is sizeable in price but not so much in time. That gives way to a correction and consolidation that lasts a minimum of 18 months. Then the market surges higher in third-wave like fashion.
The gold stocks are nearly 17 months through their consolidation. We do not know if the consolidation is ending soon or if it will last another three, six or even nine months. We do know that history argues the correction and consolidation should end sometime in 2018.
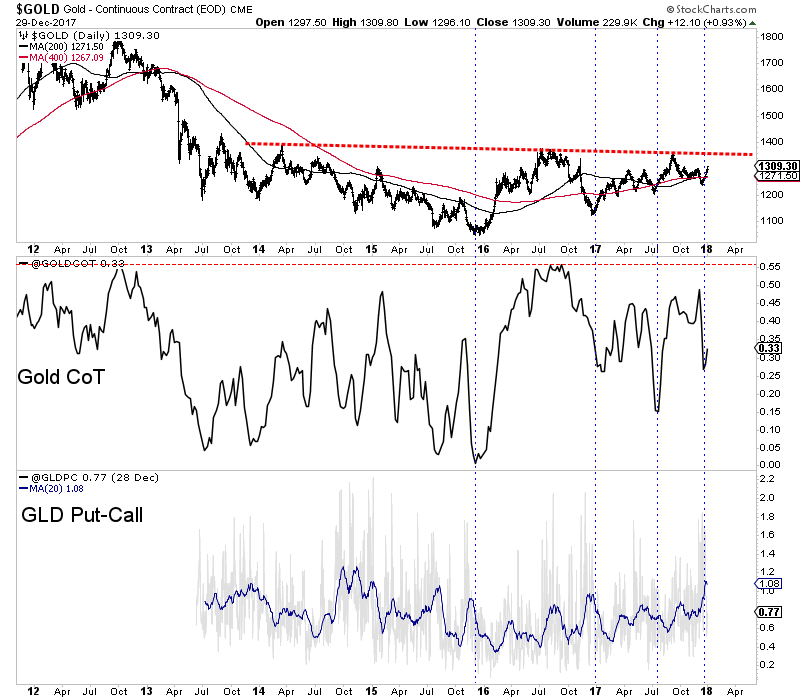
Gold is not too far away from breaking out
Gold is much closer to breaking its 2016 high than the miners but the miners could begin to sniff that potential breakout in Gold before or as it happens. Gold recently bottomed around $1240 with sentiment indicators at encouraging levels. In the chart below we plot Gold along with its net speculative position as a percentage of open interest (CoT) and the GLD put-call ratio. The CoT recently touched 27% which, although not a bearish extreme is fairly low relative to most readings since February 2016. The GLD put-call ratio recently touched the highest level in more than two years. With current sentiment relatively muted, Gold has a chance to rally up to trendline resistance. That would put it in position to breakout sometime in 2018.
Gold Stocks are one of the few sectors that offer compelling value
As we discussed last week, the gold stocks continue to offer historic value. The value is not quite as historic as in January 2016 when it was absolutely historic but it remains exceptional. Outside of the commodity sector there is nothing in a value sense that compares with the gold stocks. Even within the commodity sector, there is little that compares to gold stocks. Heading into 2018 traders and investors have to be intrigued at the deep value opportunity in the gold stocks in nominal and especially relative terms.
Increasing inflation expectations
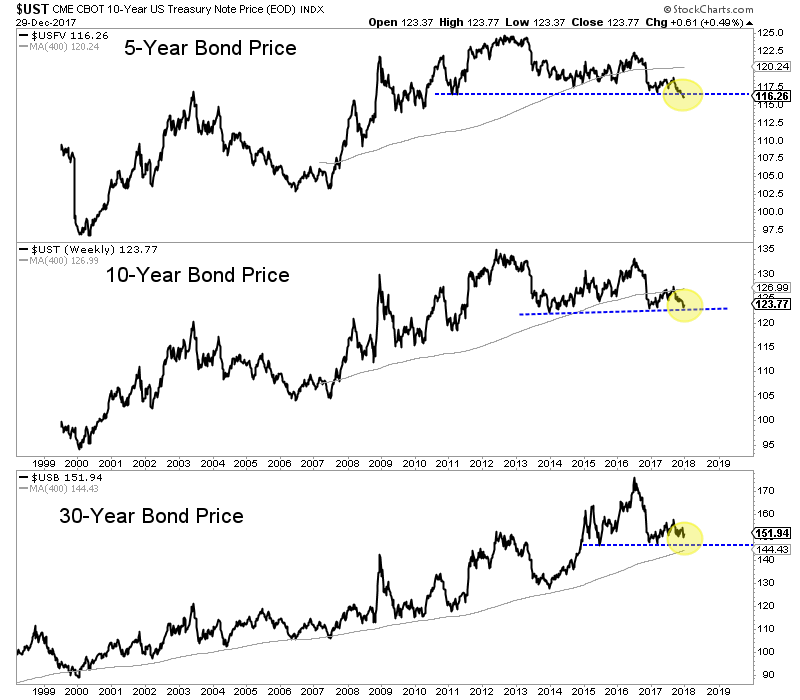
Commodities typically outperform at the end of an expansion and into the beginning of a recession. This is accompanied by rising inflation. Some commodity sectors have performed well but the commodities as a whole (CRB or CCI) has yet to make new highs. One thing that could trigger a sharp rise in inflation expectations would be a breakdown in long-term bond prices.
In the chart below we plot the 5-year bond price, the 10-year bond price and the 30-year bond price. The 5-year bond has already broken to a 7-year low while the 10-year bond is not far behind. The 30-year bond continues to hold above its 2015-2016 lows but does not have much wiggle room. A breakdown in the 10-year and 30-year bonds may not be immediately bullish for precious metals but a continued decline or acceleration to the downside would be.
The strength of the current rebound in the gold stocks has definitely surpassed our expectations and the December lows should hold moving forward. If that is the case then a breakout move for the gold stocks this year is more likely than not. More backing and filling may be ahead but if GDX and GDXJ can surpass their September highs it would be a very good sign for 2018. The miners have plenty of work to do before a true breakout move can begin but traders and investors would be wise to keep a close eye on the sector. We prefer companies with strong fundamentals that are trading at reasonable values and have upcoming catalysts that will drive buying. To follow our guidance and learn our favorite juniors for 2018, consider learning more about our premium service.
We have seen an unusually steady uptrend in copper this month, that has resulted in it appreciating by about 10%, which might not sound like much, but makes a big difference if you are a producer with fixed costs. What is remarkable about this uptrend is not only that it came hard on the heels of a high volume smackdown in the early days of the month that at the time looked bearish, but that we have seen 16 days trading days in a row of higher closes as of the close of trading on Thursday, as can be seen on the 3-month chart for copper shown below. After doing some extensive research it has been discovered that the fundamental reason for this day after day seemingly interminable uptrend was that a prominent Chinese buyer, who has an old fashioned way of doing things, was walking over to the London Metals Exchange every day for weeks with his black briefcase in hand and buying roughly the same amount of copper…

But sadly, on Friday, he was run over by a London bus whilst on his way to the exchange, and was thus unable to buy and the price dipped for the first time in a long while…
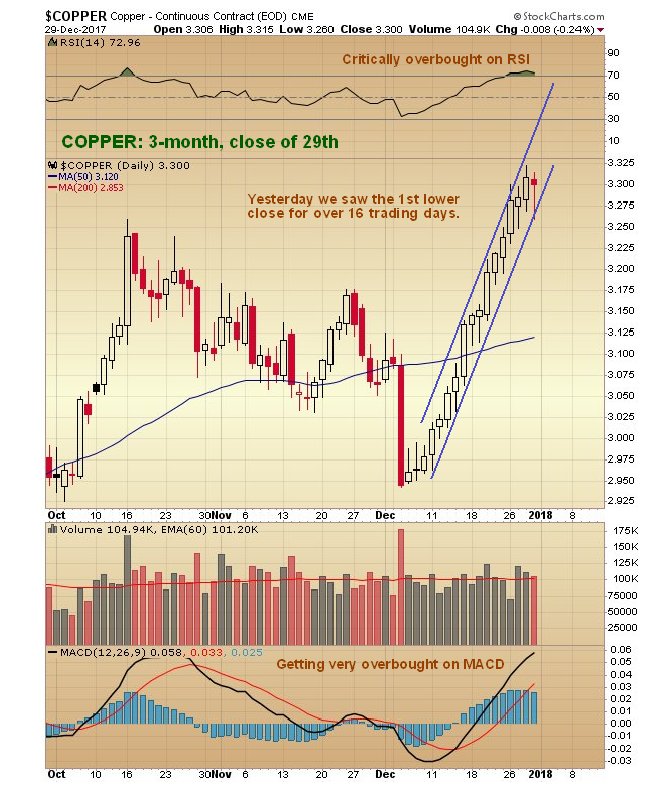
We will now zoom out to look at copper on its latest 1-year chart. On this chart we can see that, while copper still has not broken down from its steep uptrend in force all this month, it is getting very overbought on its MACD and RSI indicators and is quite a long way ahead of its 200-day moving average, and these factors, taken together with the now extreme COT structure and sentiment indicators that we will look at shortly, suggest a high chance that it will go into reverse here or very soon and react back.
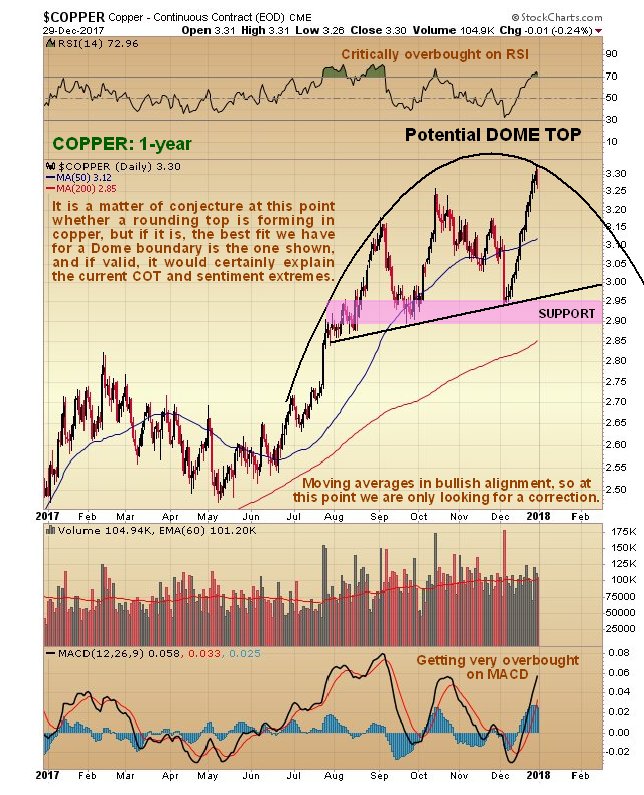
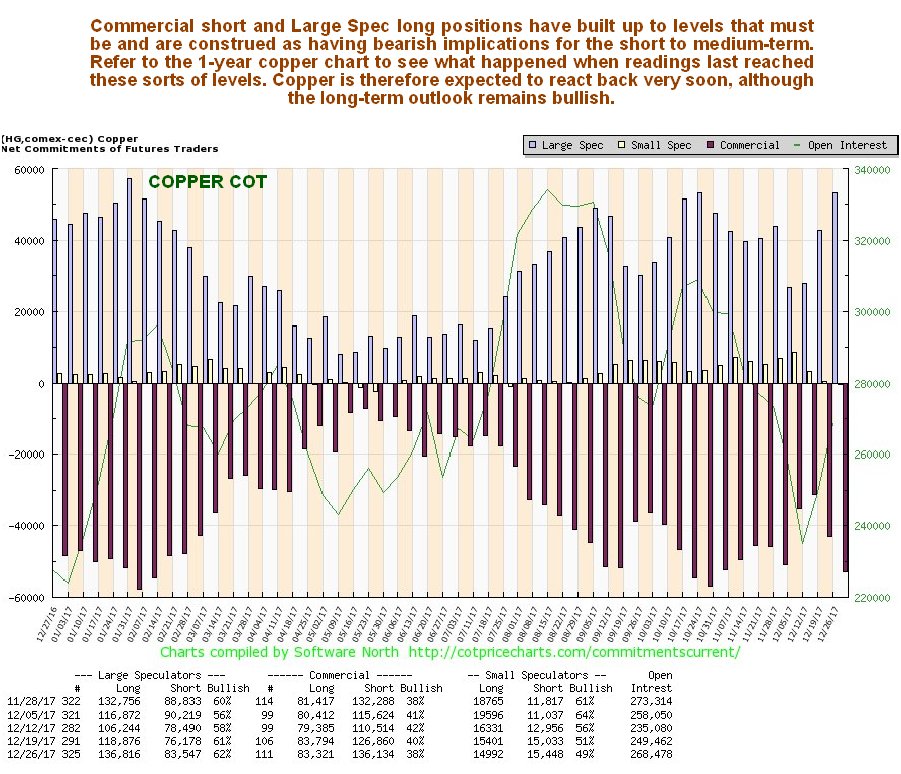
Next we will look at copper’s latest COT chart, which, since it also goes back a year, can be directly compared to the 1-year copper chart above. As we can see, Large Spec long positions are very close to their highs of the past year, and when they have reached these sorts of levels in the past, a reaction back by copper reaction has ensued, and a reaction is made more likely given the factors that we have observed on copper’s 1-year chart, and the sentiment extremes which now exist that we will look at next.
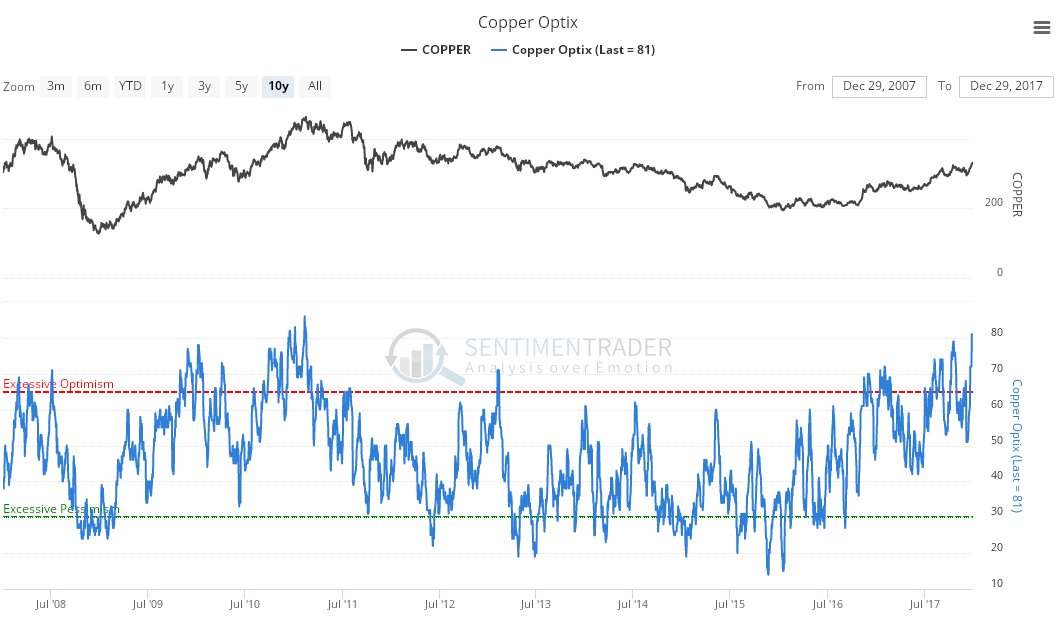
Click on chart to popup a larger clearer version. On the latest copper optix, or optimism chart, we can see that bullish sentiment towards copper is at the sort of wild extremes that we have only seen once before in the last 10 years, and that coincided with a major top. This is not to say that it does this time, but it would certainly seem to indicate a high probability that we are at or close to a significant intermediate (medium-term) top.
Click on chart to popup a larger clearer version. Chart courtesy of sentimentrader.comThe long-term chart for copper actually looks very bullish, because the bullmarket that began in October 2016 has been driven by record strong upside volume, which has propelled both volume indicators to clear new highs. What this suggests is that, while the other factors that we have already looked at, allied with the considerable resistance approaching the old peaks that we can delineate on this chart, will probably force a reaction back soon, the longer-term outlook remains favorable, with a high probability that copper will eventually proceed to break out to new all-time highs, i.e. get above even its 2011 peak in the $4.60 area. If that happens its rate of rise can of course be expected to accelerate.
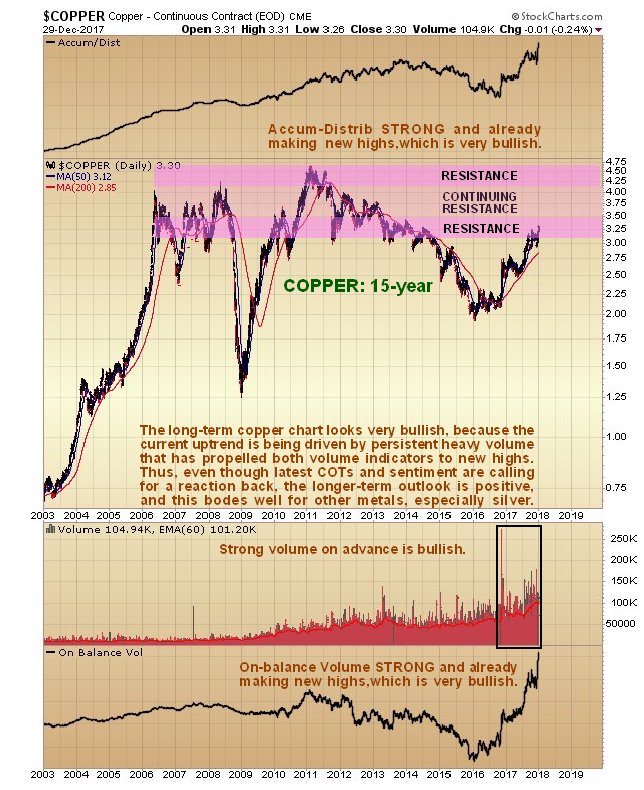
Whilst a detailed look at the copper price technicals may seem like a waste of time to some of you, given all the other subject matter for such analysis, it is important to keep in mind that we are not looking at copper for its own sake, we are looking at it because of its implications for the economy generally, and especially because of its implications for the outlook for the prices of other metals, especially silver. What we are seeing on these copper charts, principally its long-term chart, bodes very well indeed for the future trend of silver prices. End of update.
Posted at 1.20 pm EST on 30th December 17.

WTI briefly broke above $60 per barrel on news that a pipeline in Libya exploded, knocking a sizable portion of supply offline.
The oil pipeline carries crude oil to the Es Sider oil export terminal, Libya’s largest, raising fears of a dramatic supply outage. Early reports suggest that the explosion was the result of an attack by militants, although the precise cause was unclear.
However, Libya’s National Oil Company said that the incident will curtail output by 70,000 to 100,000 bpd – not a trivial amount of supply, but not the nightmare scenario that some oil traders may have feared. The National Oil Company said that Waha Oil Co. “has immediately diverted production to the Samah line,” which will help keep oil flowing. “However, NOC expects a reduction in production of [between] 70,000 to 100,000 barrels a day,” the statement said, according to S&P Global Platts.
The Es Sider terminal was one of the main export facilities that suffered disruptions in recent years, and its return to operation is what has helped Libya ramp up oil production and exports, restoring shipments to 1 million barrels per day (mb/d) from less than half of that a little more than a year ago.
The outage is not catastrophic, but Brent prices jumped more than 2.5 percent on the news, closing in on $67 per barrel, while WTI topped $60 per barrel for the first time in more than two and a half years.
Related: The Biggest Factors In Future Oil Production
The jolt to prices speaks a lot to how psychology can move the market. After all, the amount of supply knocked offline in Libya is about equivalent to the volume added to the global market from U.S. shale in just the past few weeks. And despite the U.S. adding supply in such a short amount of time, prices have posted gains since the start of December. The markets have priced in gains from shale, but they haven’t priced in unexpected outages.
The disruption in Libya, as long as the size of the volume knocked offline stays at the 100,000-bpd level, probably won’t have a major effect on the oil market. Indeed, prices fell back after it became clear that the disruption was as small as it is.
But the market jitters are magnified by the fact that the oil market is a lot tighter than it used to be. Inventories have dramatically declined, and are sitting roughly 100 million barrels above the five-year average, less than a third of the peak surplus the market saw last year. An outage in Libya could help accelerate the rebalancing process, depending on how long it takes for the pipeline to see repairs.
It also comes on the heels of a roughly 400,000-450,000 bpd outage in the North Sea because of the crack in the Forties pipeline. Moreover, a string of geopolitical events in the second half of 2017 acted as price catalysts, a notable change after about three years during which no amount of unrest was able bother oil prices at all.
Related: Goldman: Oil Markets To Balance Sooner Than Expected
These incidents highlight the unforeseen risks to supply, although in the case of the latter, repairs are expected to be completed in the next few days with a full return to operation of the Forties pipeline expected in January. “Oil markets got a real big reminder of all the different things that can and will drive prices—from investor flows to geopolitics to unplanned disruptions pipelines and refineries,” Michael Wittner, global head of oil research at Société Générale, told the WSJ, referring to the reemergence of geopolitical risk.
Investors trading in oil futures are starting to show some signs of nervousness, which makes incidents like the Libya outage important. Hedge funds and other money managers trimmed their net-length in WTI futures for the week ending on December 19, the third consecutive week of a decline.
The outage in Libya could stave off a further liquidation of bullish bets, but the return of the Forties pipeline might also pose downside risk. There is “some worry about what next month is going to bring,” John Kilduff, founding partner at Again Capital LLC told Bloomberg. “There’s not as much enthusiasm about the OPEC/non-OPEC accord as there was even a few weeks ago.”
By Nick Cunningham of Oilprice.com
More Top Reads From Oilprice.com:
- Shale Growth Hides Underlying Problems
- Are NatGas Prices About To Explode?
- Panama Canal Can’t Handle U.S. LNG Boom


Bitcoin’s crazy shenanigans are making the news media’s attempts to keep up with them seem pathetic. Bloomberg’s latest update, from four hours ago, has trumpeted the headline Bitcoin Starts a New Year by Tumbling, First Time Since 2015. In actual fact, after trading moderately lower on the opening bar of 2018, one popular bitcoin vehicle, $BRTI, is currently up $263, at 13,849. Ordinarily Rick’s Picks would suggest using a ‘mechanical’ entry to short the little sonofabitch if the rally hits $14,277, using a stop-loss at 16,477. We’ll pass this time, however, and resume actionable guidance after traders have had a few days to shake off mind-dulling excesses of holiday food, libations and festivity. Stay tuned if you care — and please note that all real-time trading recommendations will be published here first, then at FXStreet.com as soon as they can get to them.

-
I know Mike is a very solid investor and respect his opinions very much. So if he says pay attention to this or that - I will.
~ Dale G.
-
I've started managing my own investments so view Michael's site as a one-stop shop from which to get information and perspectives.
~ Dave E.
-
Michael offers easy reading, honest, common sense information that anyone can use in a practical manner.
~ der_al.
-
A sane voice in a scrambled investment world.
~ Ed R.
Inside Edge Pro Contributors

Greg Weldon

Josef Schachter

Tyler Bollhorn

Ryan Irvine

Paul Beattie

Martin Straith

Patrick Ceresna

Mark Leibovit

James Thorne

Victor Adair