
Energy & Commodities
For those that follow me regularly, you will know that I have been tracking a set up for the VanEck Vectors Gold Miners ETF (NYSEARCA:GDX), which I analyze as a proxy for the metals market. I believe that the GDX can outperform the general equity market once we confirm a long term break out has begun, and I think we can see it in 2018.
Recent price action
In early December, we identified a specific 20.89-21.26 support region, which, if held, could begin that major 3rd wave break out and rally we have been awaiting. But, since it would mean that this 2nd wave would have completed in an unorthodox manner, I noted that I would need to see confirmation that the market has truly bottomed.
Two weeks ago, I warned you to be prepared for large moves in the market, and the market has certainly given us a bit of excitement.

As we now know with the benefit of hindsight, the GDX bottomed at 21.27 (within a penny of our support), and began a rally which came within pennies of our first resistance region of 22.30 before it pulled back. Last weekend, I noted in my weekend market analysis to the members of The Market Pinball Wizard that the market was likely set up to continue higher, since the pullback looked corrective off the 22.30 region. During this past week, I presented my members with the set up for the market to rally to an ideal target of 22.85, and, as the close of the week, the market struck a high so far of 22.92.
(While I have been doing this for many years, I can honestly say I am still amazed at the accuracy of the turning points that Elliott Wave, coupled with our Fibonacci Pinball method, is able to provide us time and again, as we bottomed within one penny of our noted IMPORTANT support level, and the rallied to within pennies of our noted resistances.)
Anecdotal and other sentiment indications
So, after providing public analysis or over 6 years, I am still quite amazed at how accurately mathematics can identify turning points in the market. And, yes, this even applies in the metals market, about which everyone yells and screams is so manipulated.
If it was truly as manipulated as people claim, then what we have done in this market would be completely impossible, unless we were the manipulators. Yet, those that are so certain the market is manipulated always seem to be on the wrong side of price when making their claims. You would think that they would put their money on the side of the market which they believe is manipulated rather than complaining so much about it. But, I digress.
You see, markets are driven by the same natural progression and regression we see throughout all of nature. While we love to believe we understand their movements through some understanding of what we believe to be the “fundamentals” of the market, those fundamentals have all too often left investors holding the bag at the major market turns. And, for those that want to be honest with themselves, you would recognize that investors were exceptionally bullish as we were striking the 2011 highs, and exceptionally bearish as we were striking the 2015 lows due to their perspective of the fundamentals of the metals market.
As I have said so many times in so many different ways, the metals market is directed by the tone of overall investor sentiment more so than anything else. And, I am often asked what I mean by that. So, allow me to present you some insight on the topic.
R.N. Elliott, the one who discovered Elliott Wave analysis, wrote almost 90 years ago:
No truth meets more general acceptance than that the universe is ruled by law. Without law, it is self-evident there would be chaos, and where chaos is, nothing is . . . Man is no less a natural object than the sun or the moon, and his actions, too, in their metrical occurrence, are subject to analysis . . . Very extensive research in connection with . . human activities indicates that practically all developments which result from our social-economic processes follow a law that causes them to repeat themselves in similar and constantly recurring serials of waves or impulses of definite number and pattern. . . The stock market illustrates the wave impulse common to social-economic activity . . . It has its law, just as is true of other things throughout the universe. . .
“The causes of these cyclical changes seem clearly to have their origin in the immutable natural law that governs all things, including the various moods of human behavior. Causes, therefore, tend to become relatively unimportant in the long term progress of the cycle. This fundamental law cannot be subverted or set aside by statutes or restrictions. Current news and political developments are of only incidental important, soon forgotten; their presumed influence on market trends is not as weighty as is commonly believed.”
Bernard Baruch, an exceptionally successful American financier and stock market speculator who lived from 1870– 1965, identified the following long ago:
All economic movements, by their very nature, are motivated by crowd psychology. Without due recognition of crowd-thinking … our theories of economics leave much to be desired. … It has always seemed to me that the periodic madness which afflicts mankind must reflect some deeply rooted trait in human nature — a trait akin to the force that motivates the migration of birds or the rush of lemmings to the sea … It is a force wholly impalpable … yet, knowledge of it is necessary to right judgments on passing events.
During his tenure as chairman of the Federal Reserve, Alan Greenspan testified many times before various committees of Congress. In front of the Joint Economic Committee, Green- span noted that markets are driven by “human psychology” and “waves of optimism and pessimism.” Ultimately, as Greenspan correctly recognized, it is social mood and sentiment that moves markets.
Social experiments have actually been conducted which resulted in price patterns that mirror those found in the stock market. In 1997, the Europhysics Letters published a study conducted by Caldarelli, Marsili and Zhang, in which subjects simulated trading currencies, however, there were no exogenous factors that were involved in potentially affecting the trading pattern. Their specific goal was to observe financial market psychology “in the absence of external factors.”
One of the noted findings was that the trading behavior of the participants were “very similar to that observed in the real economy,“ wherein the price distributions were based on Phi (.618).
Their ultimate conclusion would surprise the most avid trader today:
In spite of the simplicity of our model and of the strategies of the single participants, and the outright exclusion of economic external factors, we find a market which behaves surprisingly realistically. These results suggest that a stock market can be considered as a self-organized critical system: The system reaches dynamically an equilibrium state characterized by fluctuations of any size, without the need of any parameter fine tuning or external driving.
Marsili was quoted as saying that “the understanding that we got is that the statistics of price histories in financial markets can be understood as the result of internal interaction and not the fundamental interaction with the external world.”
Elliott postulated that public sentiment and mass psychology moves in 5 waves within a primary trend, and 3 waves in a counter-trend. Once a 5 wave move in public sentiment is completed, then it is time for the subconscious sentiment of the public to shift in the opposite direction, which is simply a natural cause of events in the human psyche, and not the operative effect from some form of “news.”
This mass form of progression and regression seems to be hard wired deep within the psyche all living creatures. This is what we have come to know today as the “herding principle,” and the herd seems to turn at Fibonacci ratios, as supported by the studies mentioned before.
Humans are hard wired for herding within their basal ganglia and limbic system within their brain, which is a biological response they share with all animals. In fact, in a study performed by Dr. Joseph Ledoux, a psychologist at the Center for Neural Science at NYU, he noted that emotion and the reaction caused by such emotion occur independent and prior to, the ability of the brain to reason.
In a paper entitled “Large Financial Crashes,” published in 1997 in Physica A., a publication of the European Physical Society, the authors, within their conclusions, present a nice summation for the overall herding phenomena within financial markets:
Stock markets are fascinating structures with analogies to what is arguably the most complex dynamical system found in natural sciences, i.e., the human mind. Instead of the usual interpretation of the Efficient Market Hypothesis in which traders extract and incorporate consciously (by their action) all information contained in market prices, we propose that the market as a whole can exhibit an “emergent” behavior not shared by any of its constituents. In other words, we have in mind the process of the emergence of intelligent behavior at a macroscopic scale that individuals at the microscopic scales have no idea of. This process has been discussed in biology for instance in the animal populations such as ant colonies or in connection with the emergence of consciousness.
In fact, one commenter to one of my articles on Seeking Alpha made the following astute point regarding how news affects these subconscious herding trends:
Compare the market to a stream of ants marching by in, generally, a single direction. Run a stick across their path and there will be some momentary confusion and reaction to the direct stimuli but very soon afterwards the original parade of ants continues and the stimulus is forgotten.
So, based upon much research, it does seem that the market may be considered to be on a path that is determined by a mass form of herding that is given direction by social mood, as directed through the laws of nature which governs all living things, and not due to some reasoned reactions based upon perceived fundamentals. And, those that have followed the metals market through the years should know this quite intuitively, especially during the drop in the market between 2011-2015, as the fundamentals never changed during a 75% drop in silver.
Price pattern sentiment indications and upcoming expectations
Thus far, the GDX has been rather predictable, at least within pennies of our targets. But, now we are faced with another test being presented in the GDX. The question before us, which will likely be decided in the coming week or two, is if the GDX is going to continue much higher and begin to confirm that the larger degree 3rd wave rally has begun, or if we will roll over to extend this 2nd wave pullback into early 2018.
But, I will need to see the GDX break through the 23.30 region for me to begin to become a believer that the more immediately bullish potential will be seen. Until such time, I remain quite cautious as we now reside at a resistance point which can turn us down again into early 2018 to extend this pullback off the September high.
Again, my intention is to provide you a road map for impending market action based upon what I am seeing in the market at the time of my writing this article, and I am using the GDX as my proxy for the metals market. But, overall, I am looking for a very bullish 2018 in the metals complex once we complete this 2nd wave pullback.
By Avi Gilburt via ElliotWaveTrader.net

For many weeks we have been waiting patiently, like vultures perched on the branches of trees, for the Large Specs to go belly up and croak, and the good news is that they just have, so it’s time for us to swoop down and feast on the carcasses, the carcasses being silver and the better silver stocks, which are at good prices here, and although they have already started rallying over the past week or two, the COT structure is now much healthier, suggesting that they will continue to advance.
On the 6-month silver chart we can see the breakdown from a Symmetrical triangle that occurred late in November leading to a drop well into December, and also how silver has slowly recovered over the past 2 weeks. In itself this chart looks bearish, with a breakdown followed by a rally back up towards resistance, and moving averages in unfavorable alignment, and it is only when we consider the latest COTs and then look at long-term charts that we realize that the setup is a lot more bullish than it looks at first sight on this 6-month chart.

Next we will look at a 18-month silver chart, the main reason being so that we can compare the peaks and troughs on it directly to the 1-year COT chart placed below it. On this chart we can see that the silver price is within the confines of a large gently downsloping trading range bounded by approx. $15.25 on the downside and $18.50 on the upside. This chart makes clear why it turned up where it did a couple of weeks ago – it had arrived at a zone of support towards its July lows.
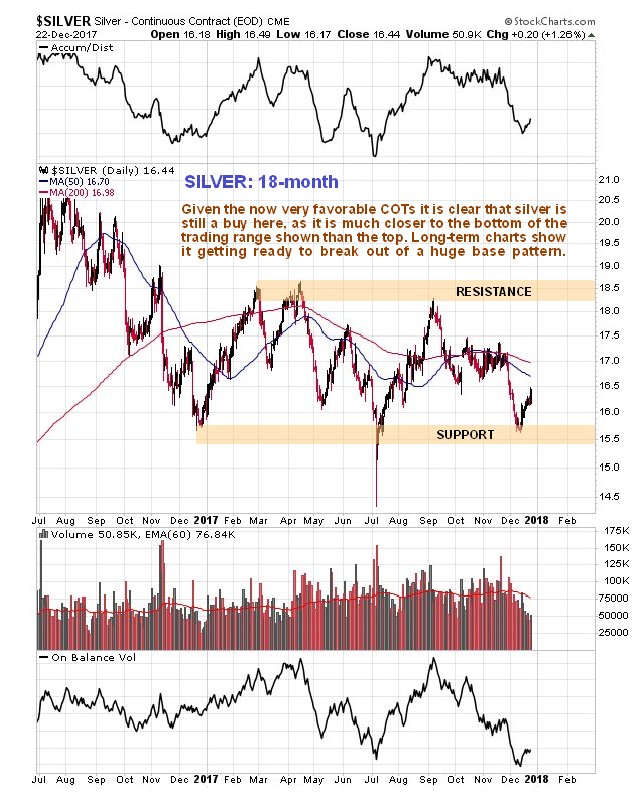
Click on chart to popup a larger clearer version.
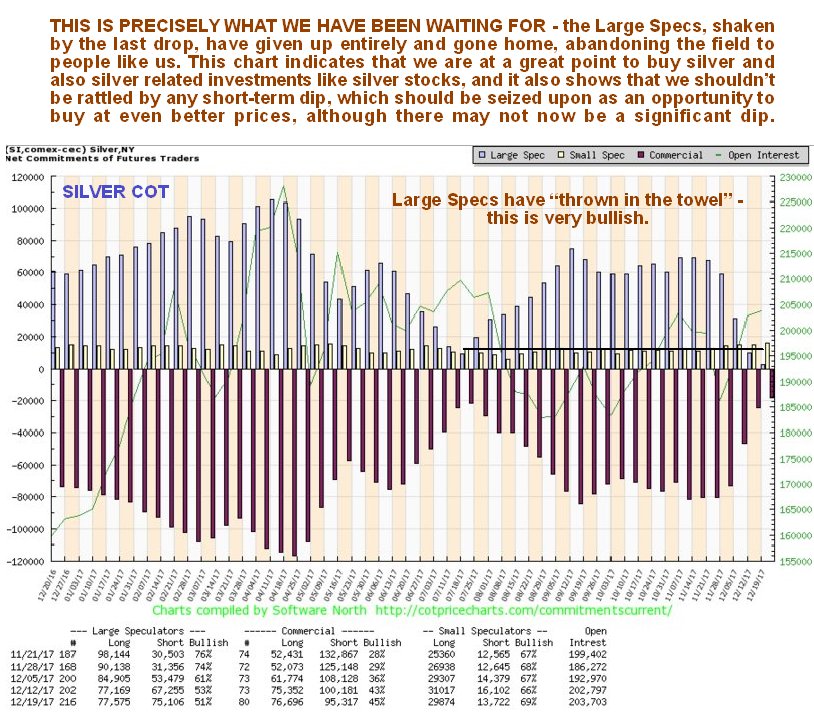
The latest silver COT chart shows a remarkable improvement in the COT structure in the space of just 4 weeks, remarkable because the drop in the silver price that triggered it was not all that great. What this COT chart shows us is that this latest drop in the silver price was “the last straw” for the Large Specs, who have “thrown in the towel”, with the huge profits made by Bitcoin speculators in recent weeks making them feel like right lemons. If you had to give a job description for the Large Specs in silver, the most accurate one would be “bagholder” since collectively they are always wrong, and you certainly don’t want to see them with a big long position if you are contemplating buying. Right now they are nowhere to be seen – they have fled, which means that the coast is clear for Smart Money buyers. There have been some doubts expressed with respect to silver in the recent past along the lines that either it will drop to new lows, or double dip to its lows of approx. 2 weeks ago, but the latest COT suggests that a drop to new lows is probably out of the question, and further that while we cannot rule out a drop towards the lows of 2 weeks ago, it looks unlikely, and should it do so, aggressive buying will be in order. Here we should note that a favorable COT setup generally leads to a rally, but does not, by itself, mean that a new bullmarket is set to start, although it is normally a precondition for a new bullmarket.
The latest Hedgers chart, a form of COT chart, also looks good for silver, and because this chart goes back much further than the COT chart, it enables us to see what happened to the silver price following peaks on this chart going back years…
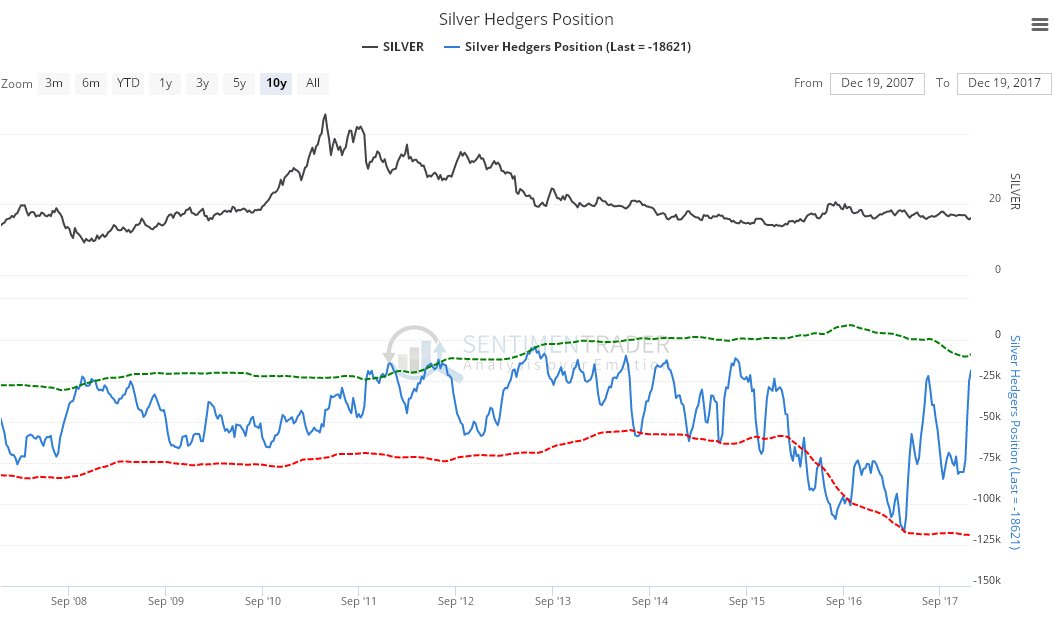
Click on chart to popup a larger clearer version.Chart courtesy of sentimentrader.com
The long-term 10-year chart calls to mind the excellent film Groundhog Day, where a guy keeps living the same day over and over, because we just keep trotting out the same description for the long-term silver chart (which does save work). Here it is again, with some adjustment:-
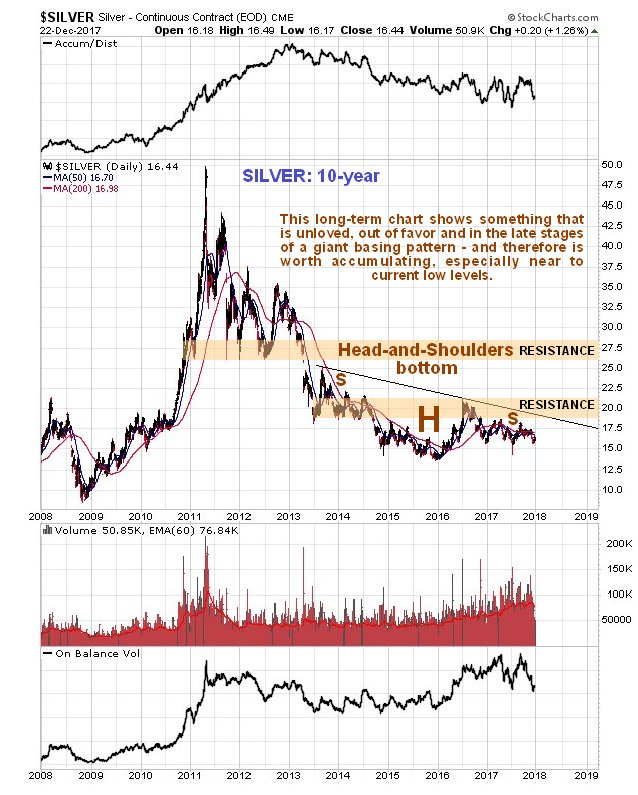
Like gold, silver is marking out a giant Head-and-Shoulders bottom pattern, but in silver’s case it is downsloping as we can see on its 10-year chart below, which reflects the fact that silver tends to underperform gold at the end of sector bearmarkets and during the early stages of sector bullmarkets. Prolonged underperformance by silver is therefore a sign of a bottom. This chart really does show how unloved silver is right now, and while we have seen some deterioration in its volume indicators in recent weeks, more important is the big improvement in the COT structure detailed above. A break above the neckline of the pattern, the black line, will be a positive development, and more so a break above the band of resistance approaching the 2016 highs. Once it gets above this it will have to contend with a quite strong zone of resistance roughly between $26 and $28.
Finally, we see that silver’s best month of the year is coming right up!…
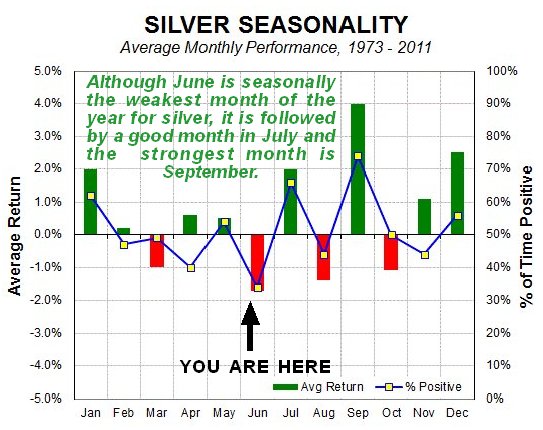
Click on chart to popup a larger clearer version.Chart courtesy of www.sentimentrader.comThe conclusion is that silver is now a strong buy, and an even stronger buy in the event that it should react back short-term towards its lows of about 2 weeks ago. Whilst we can speculate about why the silver price should rise soon, with reasons such as a falling dollar, and funds flowing out of the cryptos as a result of the Bitcoin bust, an attack on Iran etc, it is not really necessary as the charts speak for themselves.End of update.
For Wednesday December 27, 2017 3:00 PM Pacific.
DOW + 28 on 325 net advances
NASDAQ COMP + 3 on 54 net advances
SHORT TERM TREND Bullish
INTERMEDIATE TERM Bullish
STOCKS: There is a theory that tax loss selling, which usually takes place in October, did not take place because of uncertainty about the tax bill. Supposedly it is taking place now. Of course, you can never be sure, but something seems to be retarding progress in the markets.
Every time we look to be starting up, selling comes in. It could also be a large sell program. If a major institution is decides to unload shares, they won’t announce it. They simply bleed stocks into to the market and once it’s over, shares frequently explode to the upside.
GOLD: Gold moved up $9. Lower bond rates may have helped, but the momentum from its last oversold condition is more likely the reason.
CHART: The S&P 500 has been waffling sideways for over a week, but the advance decline line continues to make all time highs.

BOTTOM LINE: (Trading)
Our intermediate term system is on a buy.
System 7 We are long the SSO from 110.59. Stay with it on Thursday.
System 8 We are in cash. Stay there for now.
System 9 We are in cash.
NEWS AND FUNDAMENTALS: Consumer confidence came in at 122.1, lower than last month’s 128.6. Pending home sales rose 0.2%, lower than the expected .05%. On Thursday we get the trade deficit, initial claims and oil inventories.
INTERESTING STUFF: Never interrupt your enemy when he is making a mistake. ——–Napoleon Bonaparte
TORONTO EXCHANGE: Toronto was up 38.
BONDS: Bonds surged.
THE REST: The dollar was lower again. Crude oil fell back a bit.
Bonds –Bullish as of Dec. 15.
U.S. dollar – Bearish as of Dec. 11
Euro — Bullish as of Dec. 11.
Gold —-Bullish as of Dec. 13.
Silver—- Bullish as of Dec. 13.
Crude oil —-Bullish as of Dec. 26.
Toronto Stock Exchange—- Bullish as of September 20, 2017.
We are on a long term buy signal for the markets of the U.S., Canada, Britain, Germany and France.

Monetary conditions (+2 means the Fed is actively dropping rates; +1 means a bias toward easing. 0 means neutral, -1 means a bias toward tightening, -2 means actively raising rates). RSI (30 or below is oversold, 80 or above is overbought). McClellan Oscillator ( minus 100 is oversold. Plus 100 is overbought). Composite Gauge (5 or below is negative, 13 or above is positive). Composite Gauge five day m.a. (8.0 or below is overbought. 13.0 or above is oversold). CBOE Put Call Ratio ( .80 or below is a negative. 1.00 or above is a positive). Volatility Index, VIX (low teens bearish, high twenties bullish), VIX % single day change. + 5 or greater bullish. -5 or less, bearish. VIX % change 5 day m.a. +3.0 or above bullish, -3.0 or below, bearish. Advances minus declines three day m.a.( +500 is bearish. – 500 is bullish). Supply Demand 5 day m.a. (.45 or below is a positive. .80 or above is a negative). Trading Index (TRIN) 1.40 or above bullish. No level for bearish.
No guarantees are made. Traders can and do lose money. The publisher may take positions in recommended securities.

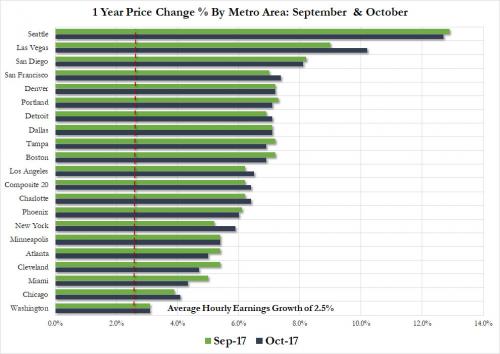
According to the latest BLS data, average hourly wages for all US workers in November rose at a stubbornly low 2.5% relative to the previous year, well below the Fed’s “target” of 3.5-4.5%, as countless economists are unable to explain how 4.1% unemployment, and “no slack” in the economy fails to boost wage growth. Another problem with tepid wage growth, in addition to crush the Fed’s credibility, is that it keeps a lid on how much general price levels can rise by. With record debt, it has been the Fed’s imperative to boost inflation at any cost (or rather at a cost of $4.5 trillion) to inflate away the debt overhang, however weak wages have made this impossible.
Well, not really. Because a quick look at US housing shows that while wages may be growing at roughly 2.5%, according to the latest Case Shiller data, every single metro area in the US saw home prices grow at a higher rate, while 16 of 20 major U.S. cities experienced home price growth of 5% or higher: double the average wage growth, and something which even the NAR has been complaining about with its chief economist Larry Yun warning that as the disconnect between prices and wages become wider, homes become increasingly unaffordable.
And while this should not come as a surprise – considering we have pointed it out on numerous occasions in the past – one look at the chart below suggests that something strange is taking place in Seattle, which has either become “Vancouver South” when it comes to Chinese hot money laundering, or there is an unprecedented mini housing bubble in the hipster capital of the world. Also worth keeping an eye on: price appreciation in Sin City has quietly surged in recent months, and in September home prices surged 10.2% Y/Y, the only other double digit price increase in the US after Seattle. Considering that Las Vegas was the epicenter of the last housing bubble when prices exploded higher only to crash, it may be a good idea to keep a close eye on price tendencies in this metro area.
…also from ZeroHedge:
The hackers studied their cyberattack target for months — the central bank of Bangladesh.
First, they used their cyberskills to steal the institution’s top-secret international money transfer code.
Now they could request large wires of bank funds — electronic transmissions of money across international lines — and never draw suspicion. After that, they sent out four transfer requests, using fake names of charitable organizations.
In the early weeks of 2016, they successfully stole more than $80 million!
Only a typo kept them from taking even more — on the fifth transfer request, one of the hackers misspelled the made-up “Shalika Foundation” as fandation, raising questions and bringing an end to the digital heist. The hackers were never found.
What if another group of cyber bad guys went after the banking system again?
A Sheltered Harbor From Cyberattacks
Suppose hackers didn’t steal money but simply denied banks’ access to their stored digital cash or their customers’ account records?
It’s the stuff of bankers’ nightmares — and the reason behind an industry nonprofit project called the Sheltered Harbor initiative.
The idea is that banks regularly copy their account data, encrypt it and securely store it with other member banks. That way, if a cyberattack disrupts operations in one bank, it could always turn to others in the Sheltered Harbor initiative to retrieve its data.
Sheltered Harbor got started in late 2016 with about three dozen top U.S. banks, credit unions, brokerage houses and other financial institutions. The goal is to enroll the majority of the financial industry into the system in the next few years.
It also demonstrates the persistent threat of data breaches and the rising role that cybersecurity companies play in protecting banks and other corporations from hackers.
A great way to play the trend is with the First Trust Nasdaq CEA Cybersecurity ETF (Nasdaq: CIBR). Since I started writing about cybersecurity in August, the exchange-traded fund is up 10%. Since early 2016, the ETF has gained more than 60% in value.

The idea behind Sheltered Harbor is that banks regularly copy their account data, encrypt it and securely store it with other member banks for protection.
The sector is due to take in an estimated $1 trillion in spending between now and 2021.
As Sheltered Harbor and innumerable hacking incidents in recent years show, even the largest, most important computer systems in the world can be breached by a determined group of hackers.
Kind regards,
Jeff L. Yastine


-
I know Mike is a very solid investor and respect his opinions very much. So if he says pay attention to this or that - I will.
~ Dale G.
-
I've started managing my own investments so view Michael's site as a one-stop shop from which to get information and perspectives.
~ Dave E.
-
Michael offers easy reading, honest, common sense information that anyone can use in a practical manner.
~ der_al.
-
A sane voice in a scrambled investment world.
~ Ed R.
Inside Edge Pro Contributors

Greg Weldon

Josef Schachter

Tyler Bollhorn

Ryan Irvine

Paul Beattie

Martin Straith

Patrick Ceresna

Mark Leibovit

James Thorne

Victor Adair