
Mike's Content
 Mark Liebovit’s top recommendation at last year’s World Outlook Financial Conference was Bitcoin Trust @$110 – traded last friday today @ $1,990 – 17.9 times
- Jim Dines recommended Canopy Growth @ $13 – traded last friday @ $23.12
- James Thorne shockingly recommended Bombardier @ $2.00 – traded last friday@$3.03 – up 51%
- Ryan Irvine recommended International Road Dynamics @ $2.50 – taken over 3 months later at $4.25 – up 70%
Those are great results but that’s the whole point of inviting some of the top analysts in the English speaking world to the World Outlook Financial Conference for the past 29 years. Obviously past performance is not a guarantee of future success but the results we have achieved over the years have not been by accident. Our analysts have been chosen precisely because they have strong track records.
No, they are not right every time, but their uncanny ability to read the various investment markets while employing proven risk management techniques has clearly raised their probability of success dramatically. Whether you’re interested in stocks, gold, oil, real estate, interest rates or currencies – we bring in the top analysts to the World Outlook Financial Conference to cover them all.
It’s an incredible line-up for Feb 2nd & 3rd, 2018. Martin Armstrong has been called the highest paid financial advisor on the planet. Heck, I’ve called him the top economic forecaster in the world. Let me give you just a couple of examples. At the Outlook in 2013 he correctly predicted the date of the Russian invasion of Ukraine and the accompanying massive outflow of capital that would push the US dollar and stocks higher. More importantly he clearly predicted the rise of the Dow Jones Index through 18,000 and told the audience to buy every dip because the next stop was 23,700. We came within a quarter of a percent of his target this month so I can’t wait to hear what he has to say now.
Mark Leibovit will also be at the 2018 Outlook. Mark has been Timer’s Digest Timer of the Year, Gold Market Timer of the Year and Long Term Timer of the year. While he’s been great in all those areas – my favourite of his forecasts came at the 2014 Conference where he told us to start to invest in marijuana stocks starting with GW Pharmaceuticals at $67. Mark has repeated his recommendation of the marijuana industry every year. I think it’s safe to say that was a good call but I’ll be interested in what he has to say this year as the industry and the stocks become more mainstream.
I won’t go through all the 2018 speakers right now (they’re available HERE) but let me give you just one more example of the quality of analyst featured at the World Outlook Conference. Keystone Financial’s Ryan Irvine has been producing a World Outlook Small Cap Portfolio for the past 8 years – and as I said past performance is no guarantee of future success but I like my chances. The Small Cap Portfolio has returned double digits every single year – no exceptions.
Obviously I want to hear Ryan’s picks at this year’s conference. I’m worried it will cost me too much money if I don’t!
What Will Happen in 2018
The easiest prediction is that the rate of change will continue to increase, which will produce big price swings in a variety of investments.
Goldman Sachs just predicted four more interest rate hikes in the States in 2018. If they’re right, it will have a huge impact on the US dollar. The loonie will go down as a result unless the Bank of Canada raises our rates with them. And if they do what will be the impact on real estate and Canadian stocks?
Currency moves are going to provide a huge opportunity for those who position themselves properly. I’m pleased to say that the currency recommendations at the Outlook Conference have made a lot of people money but I think 2018 will be an even bigger year.
I continue to be most worried about the government bond market. If rates rise, bonds will certainly go down, which is why I’ve been telling people to get rid of government bonds with maturities of 3 years and longer. At the 2018 Outlook we’ll talk a lot more about the vulnerability of government bonds.
The Pension crisis in Europe and the States will also be a big story in 2018 with major financial implications, as well as social and political ones. We’ll talk more about how to position yourself to both protect and profit from the pension problems.
The Bottom Line
The level of volatility and the violence of the moves in all markets necessitates taking advantage of the best possible research and analysis available. While financial programs and conferences often feature cheerleaders for a variety of products or industries, we focus on top flight independent analysis. The bottom line is that I am confident that our analysts can make you back the price of admission many times over.
Periods of historic change provide incredible opportunities and incredible danger.
At the 2018 World Outlook Financial Conference and on MoneyTalks, I’m trying to help you avoid the danger and take advantage of the opportunities.
I hope to see you there.
Sincerely
Mike
PS – The 2018 World Outlook Conference is Friday night Feb 2nd and Saturday Feb 3rd at the Westin Bayshore in Vancouver. For tickets and other details go to www.moneytalks.net and click on the events button.

…also from Michael: BC Message to Investors “Don’t Invest In BC”


 The weekend is here! Pour yourself a mug of Death Wish coffee, grab a seat by the fire, and get ready for our longer form weekend reads:
• He Stole $100 Million From His Clients. Now He’s Living in Luxury on the Côte d’Azur (Bloomberg)
• How Economic Incentives have Created our Dysfunctional US Medical Market (//medium.com/@RosenthalHealth/how-economic-incentives-have-created-our-dysfunctional-us-medical-market-b681c51d6436” target=”_blank” rel=”noopener”>Medium)
• Most Influential in Media 2017 (Mediaite)
• How a Dorm Room Minecraft Scam Brought Down the Internet (Wired)
• The Bomb that Went Off Twice: The explosive compound RDX helped make America a superpower. Now, it’s poisoning the nation’s water and soil (ProPublica)
• The Serial-Killer Detector: A former journalist, equipped with an algorithm and the largest collection of murder records in the country, finds patterns in crime. (New Yorker)
• The Greatest Leap: The triumph and near-tragedy of the first Moon landing (Ars Technica)
• The Longest War: 8 Years After My Last Deployment, I Returned To Afghanistan As A Reporter. Here’s What I Found (Task and Purpose)
• The Grandfather Of Alt-Science: Art Robinson has seeded scientific skepticism within the GOP for decades. Now he wants to use urine to save lives. (FiveThirtyEight)
• American Pimps: The NFL, Donald Trump, and Iceberg Slim (The Baffler)
Be sure to check out our Masters in Business interview this weekend with Ric Edelman, co-founder and chairman of Edelman Financial Services LLC, managing $18 billion dollars.
Tonight I would like to update some charts for the commodities complex as we are starting to see some action in this sector. Back in the summer months when we first started to get long some of the different commodities sectors, we got many breakouts from some very nice H&S bases. After the initial move up came the first consolidation phase that has been going on for nearly four months or so. We are now starting to see some of these consolidation patterns breaking out which should lead to the next impulse move higher in most cases.
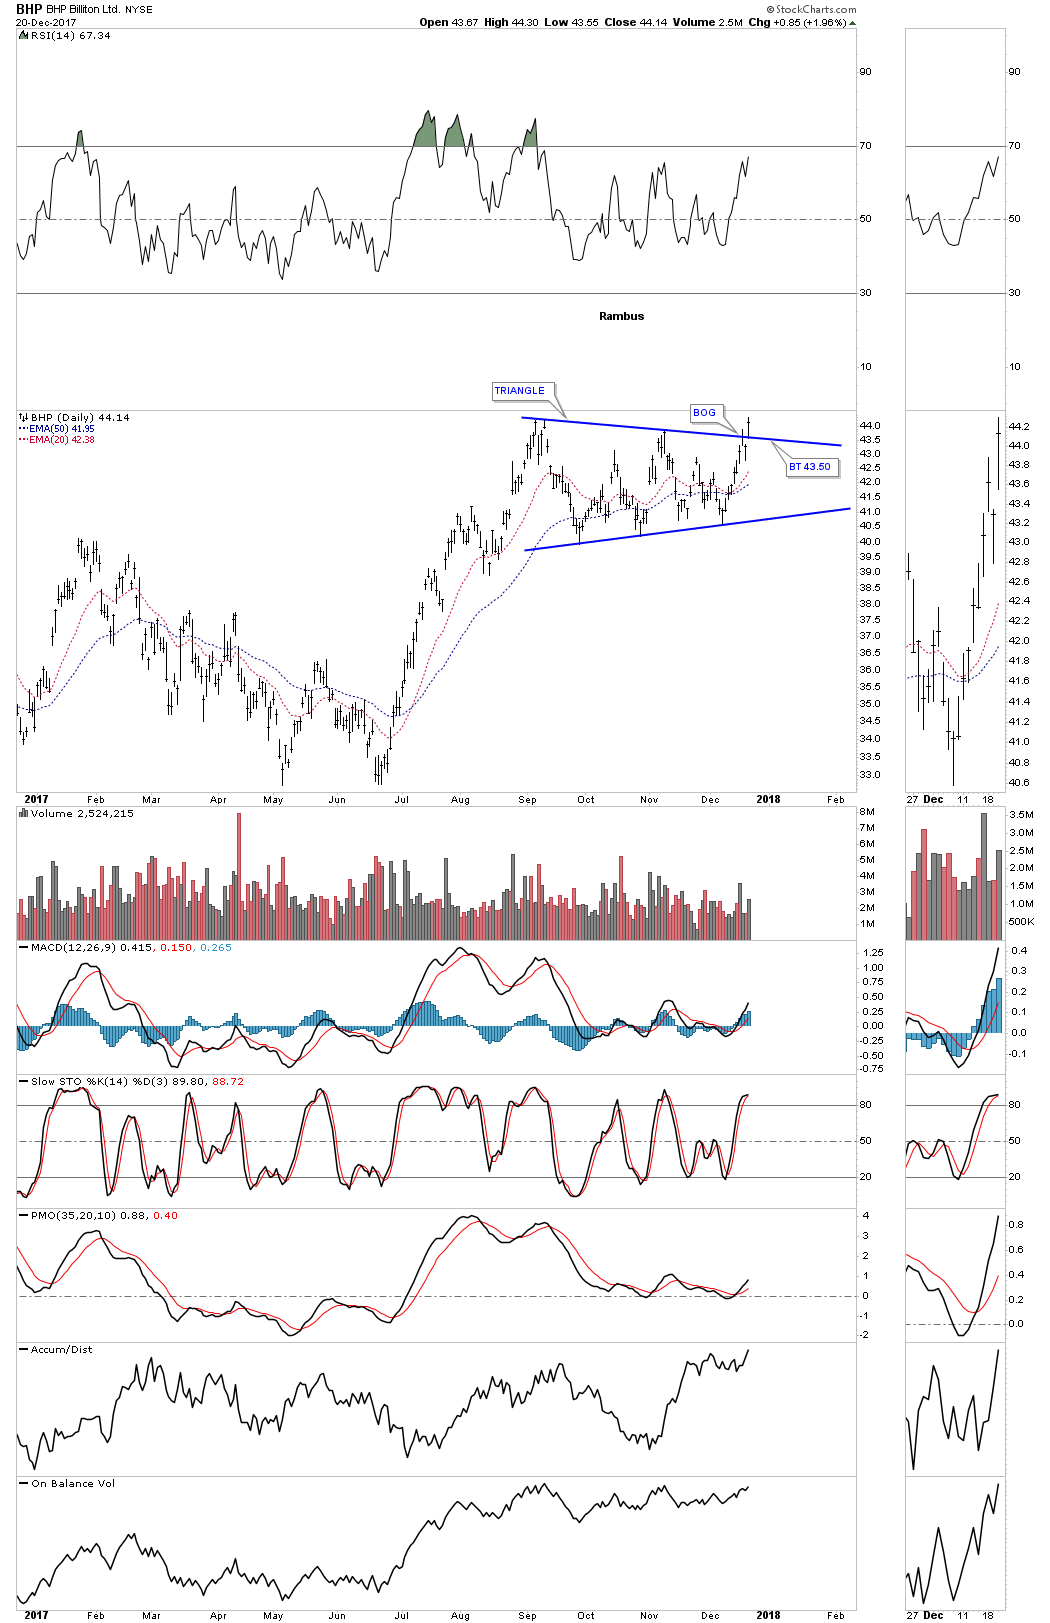
Lets start with BHP, one of the biggest miners on the planet, that shows a good example of where we are at in the bull market. Today the price action broke out with a gap above the top rail of an almost 5 month triangle consolidation pattern. A backtest to the top rail would come in around the 43.50 area.
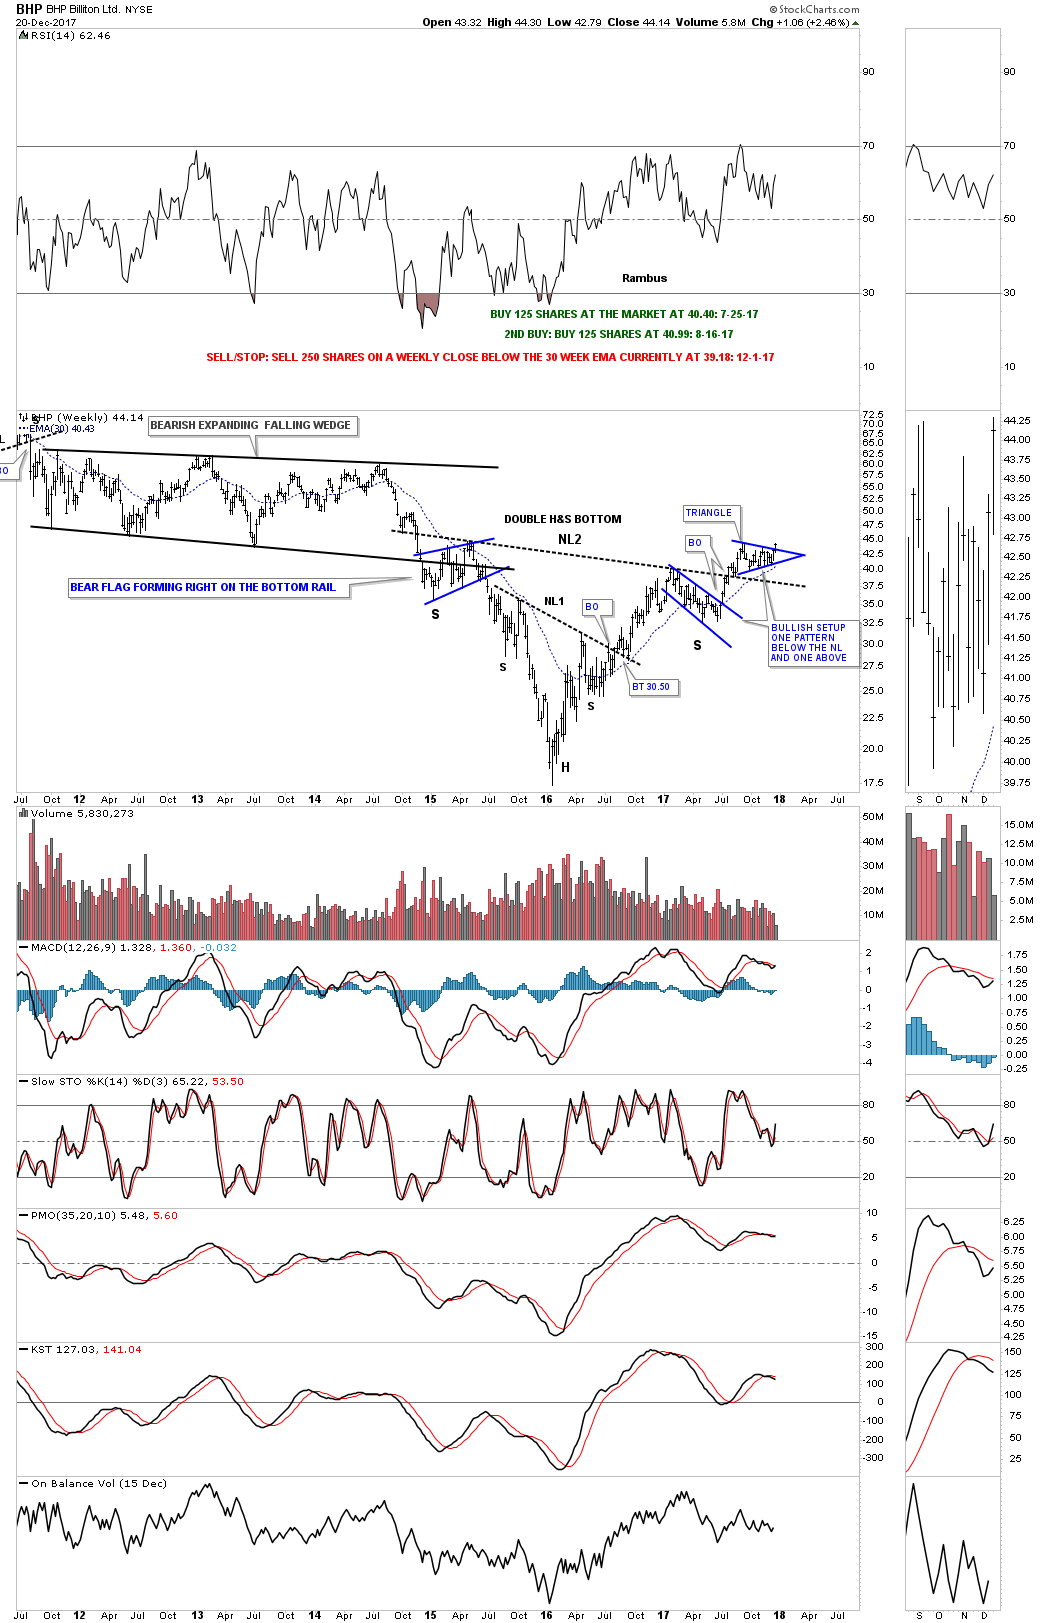
Now lets look at a long term weekly chart which shows some classic Chartology. We have discussed many times in the past when you see a small consolidation pattern form just below an important trendline, in this case the neckline, and one above, that is usually a very bullish setup which BHP is now showing.
Also keep in mind the size of that double H&S bottom that took three years to buildout. Big patterns lead to big moves. The minimum price objective of that double H&S bottom is measured from the head straight up to the neckline # two. Add that distance to the breakout point to get your minimum price objective.
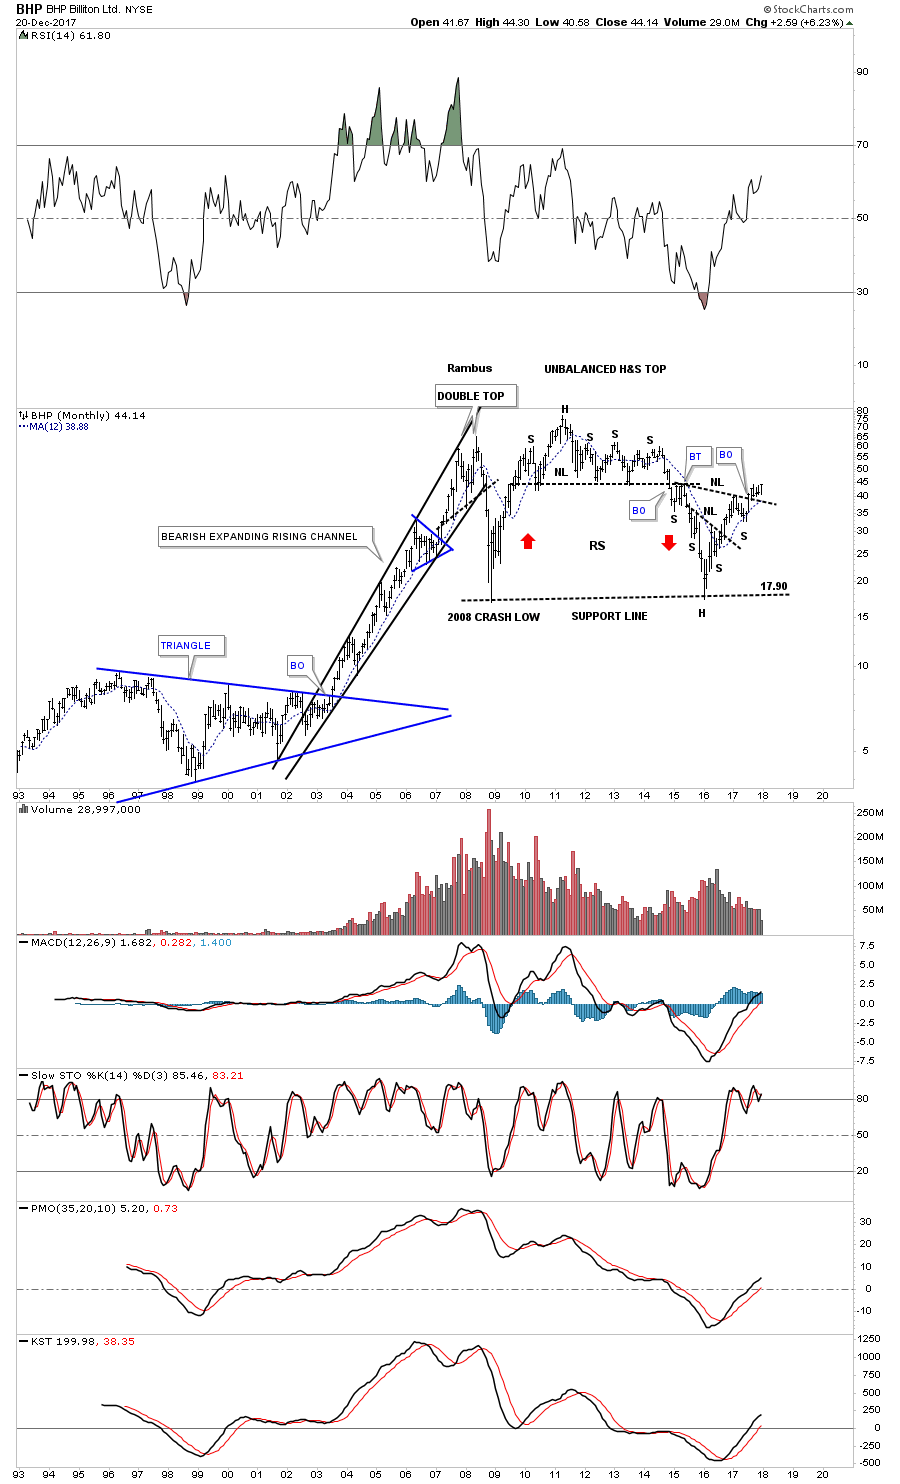
This monthly chart put the double H&S bottom in perspective.
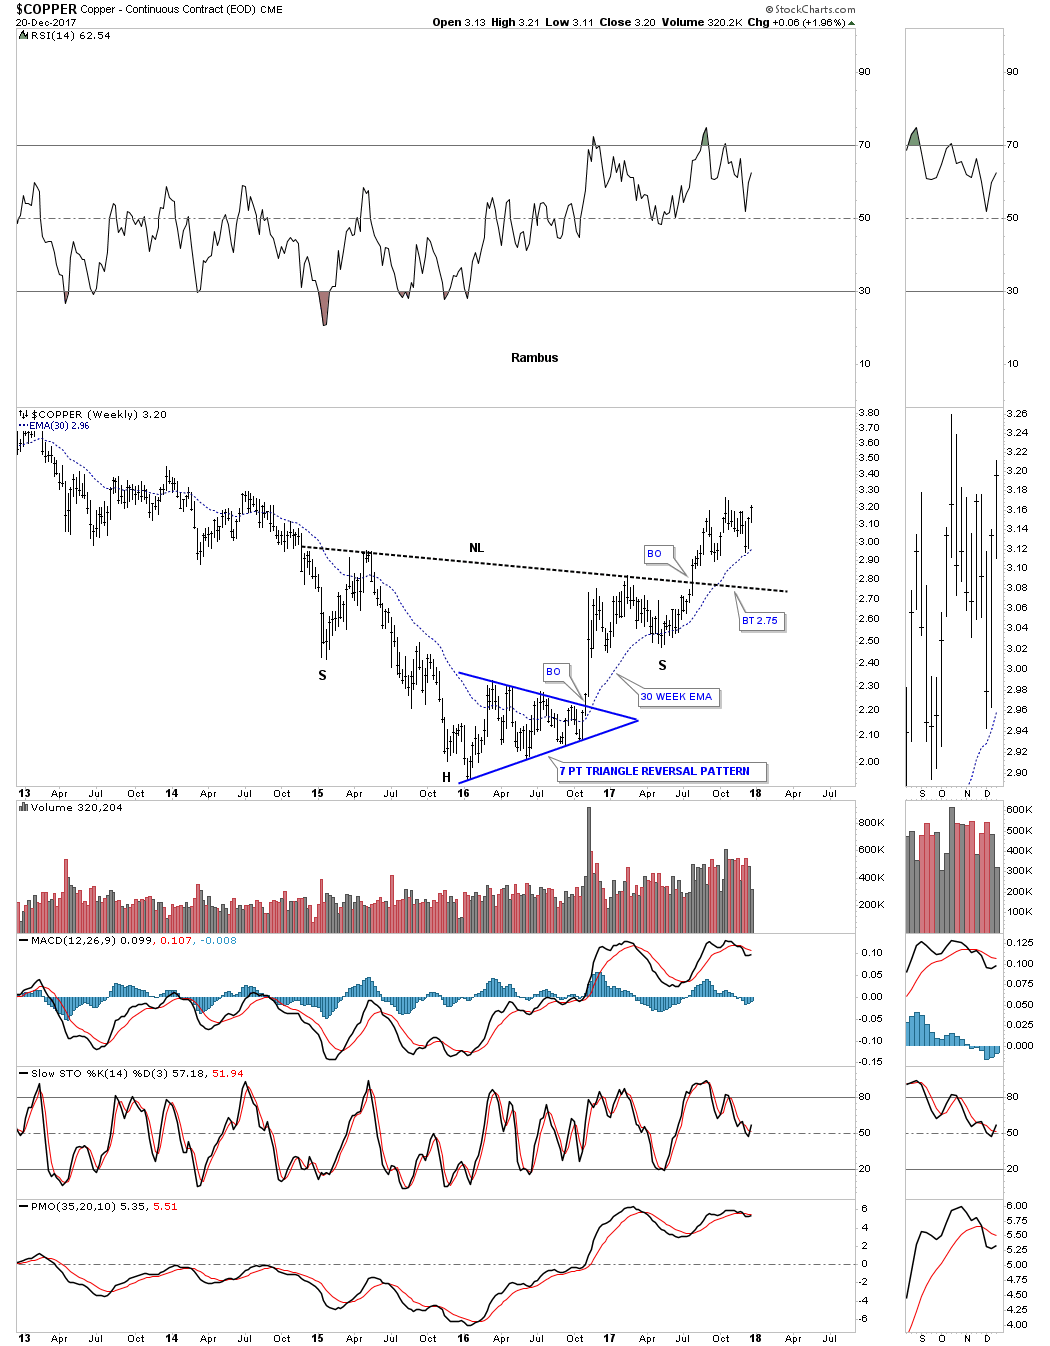
Copper is an important commodity as it can show the strength or weakness of the economy which is why it’s called Dr. Copper. This weekly chart shows copper’s big H&S bottom with the breakout in the summer. The head formed a 7 point triangle reversal pattern which actually reversed the bear market. Here is a case where we didn’t see a backtest to the neckline when the breakout took place. The 30 week ema has done a good job of holding support so far during Coppers new bull market.
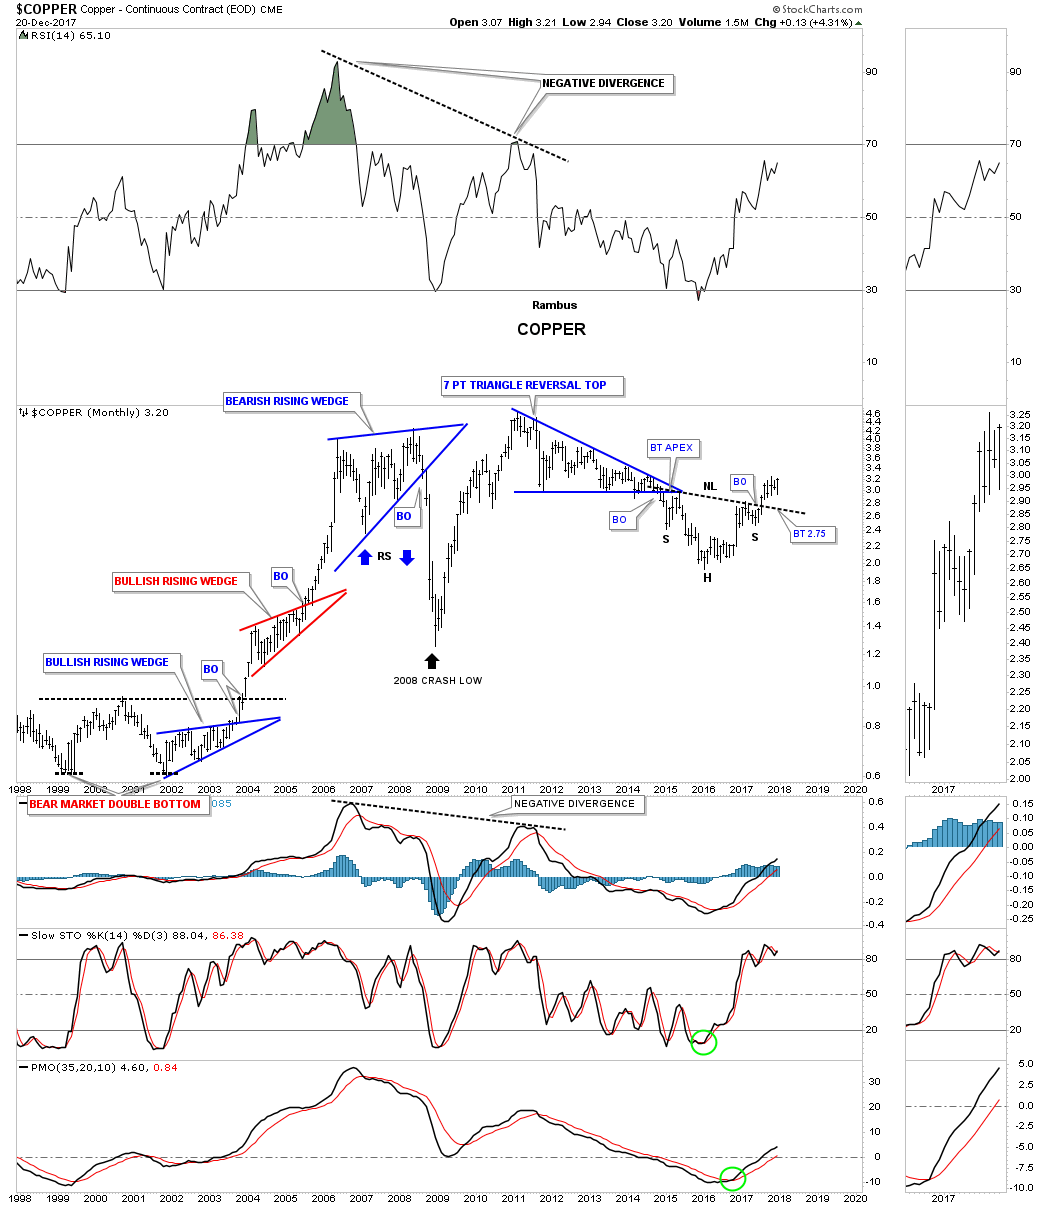
This 20 year monthly chart shows how the H&S fits into the very big picture.
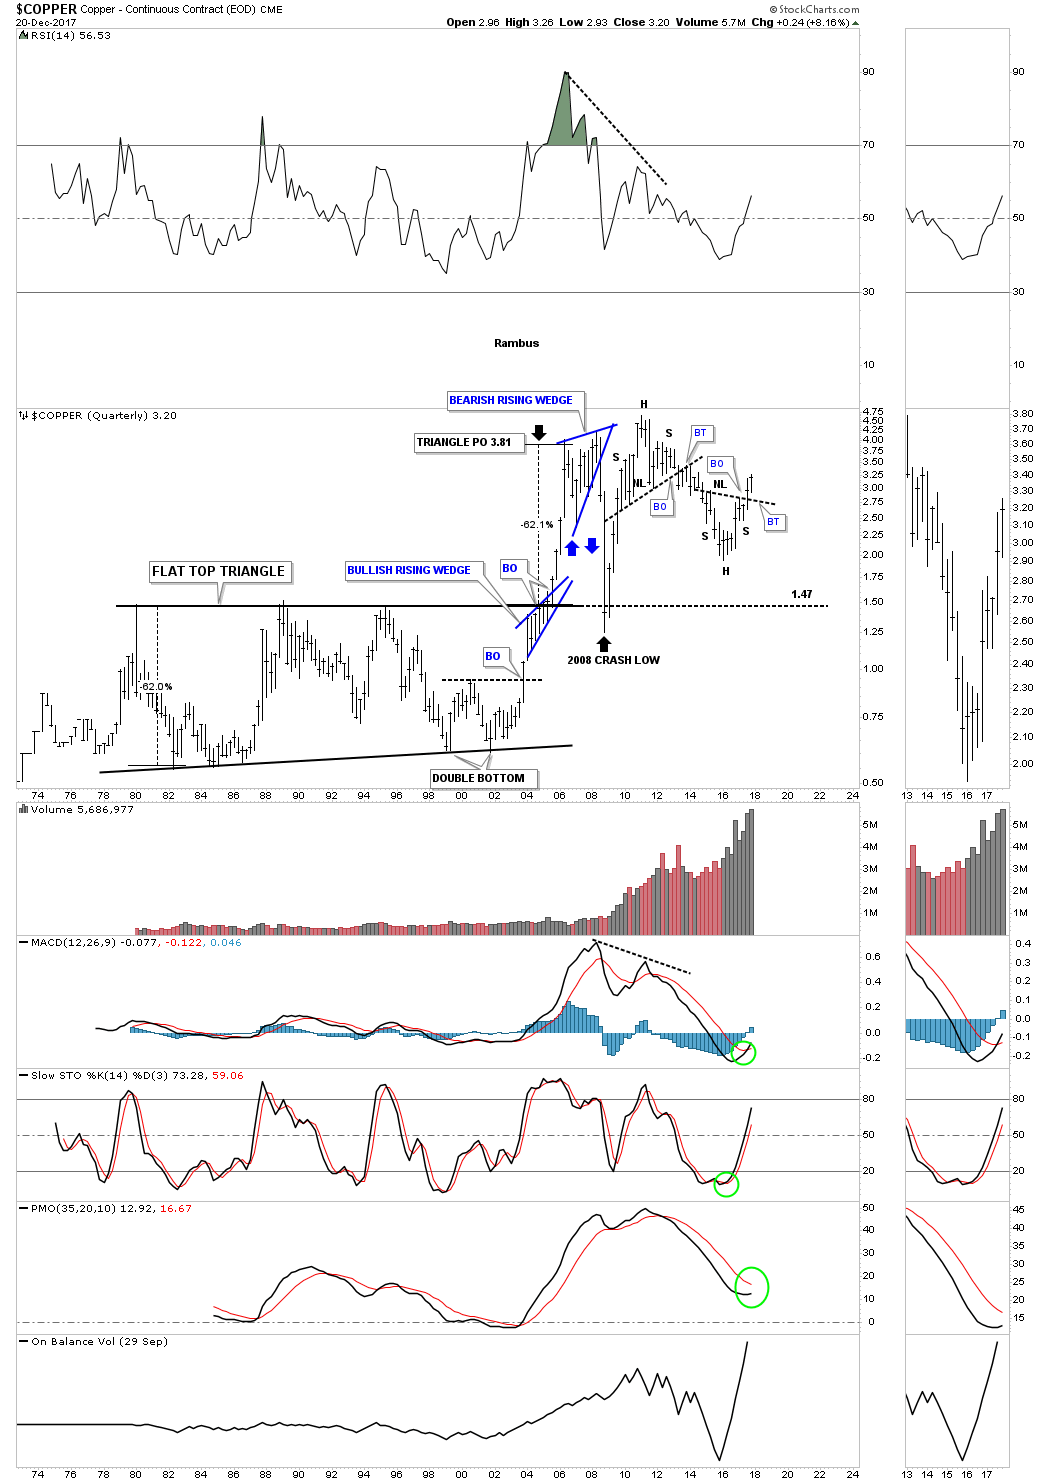
Below is the quarterly chart which shows some nice Chartology especially that 24 year flat top triangle’s price objective.
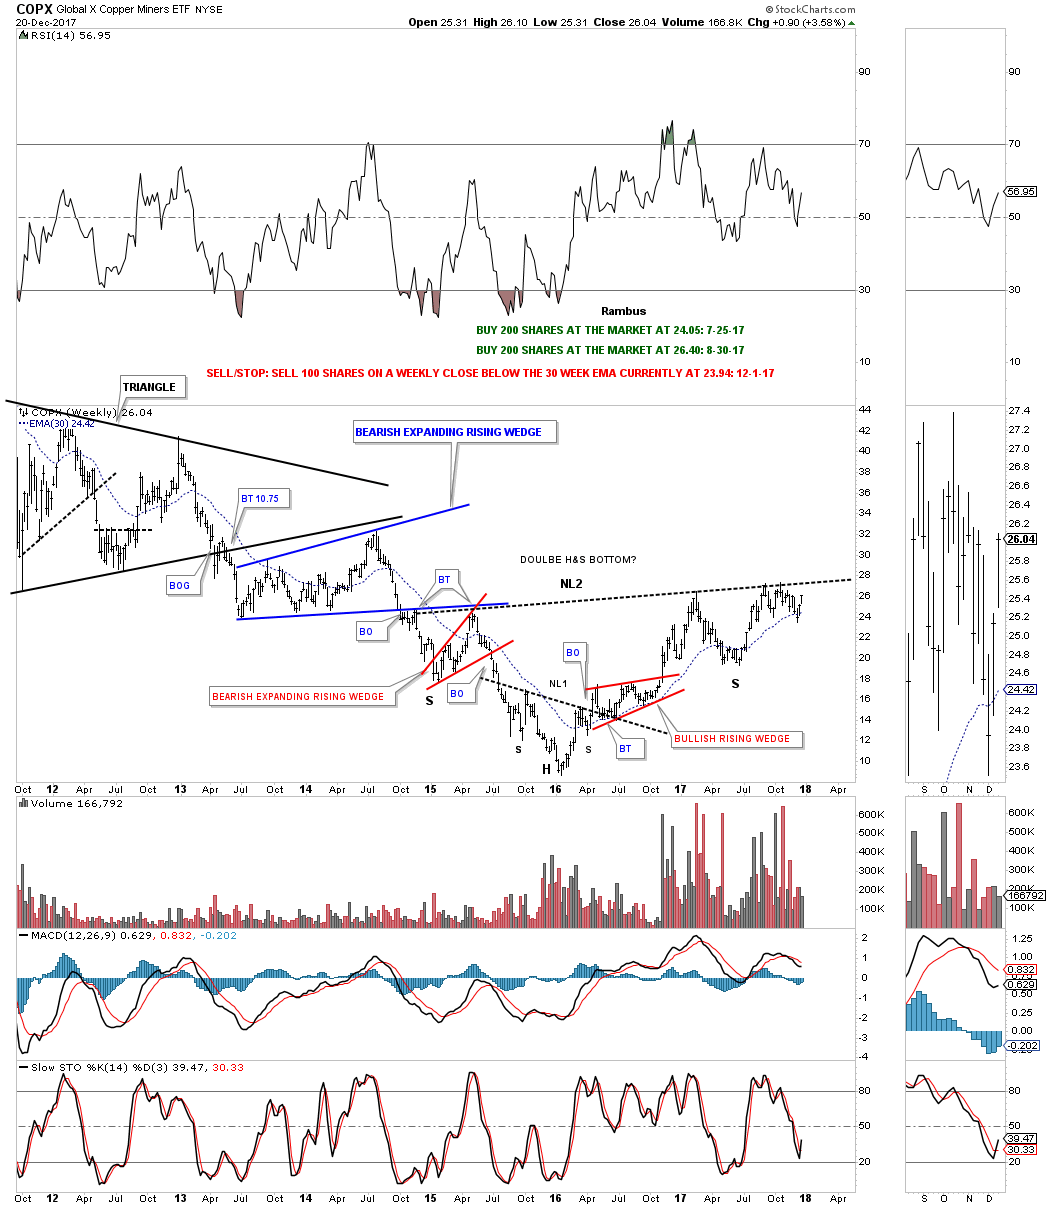
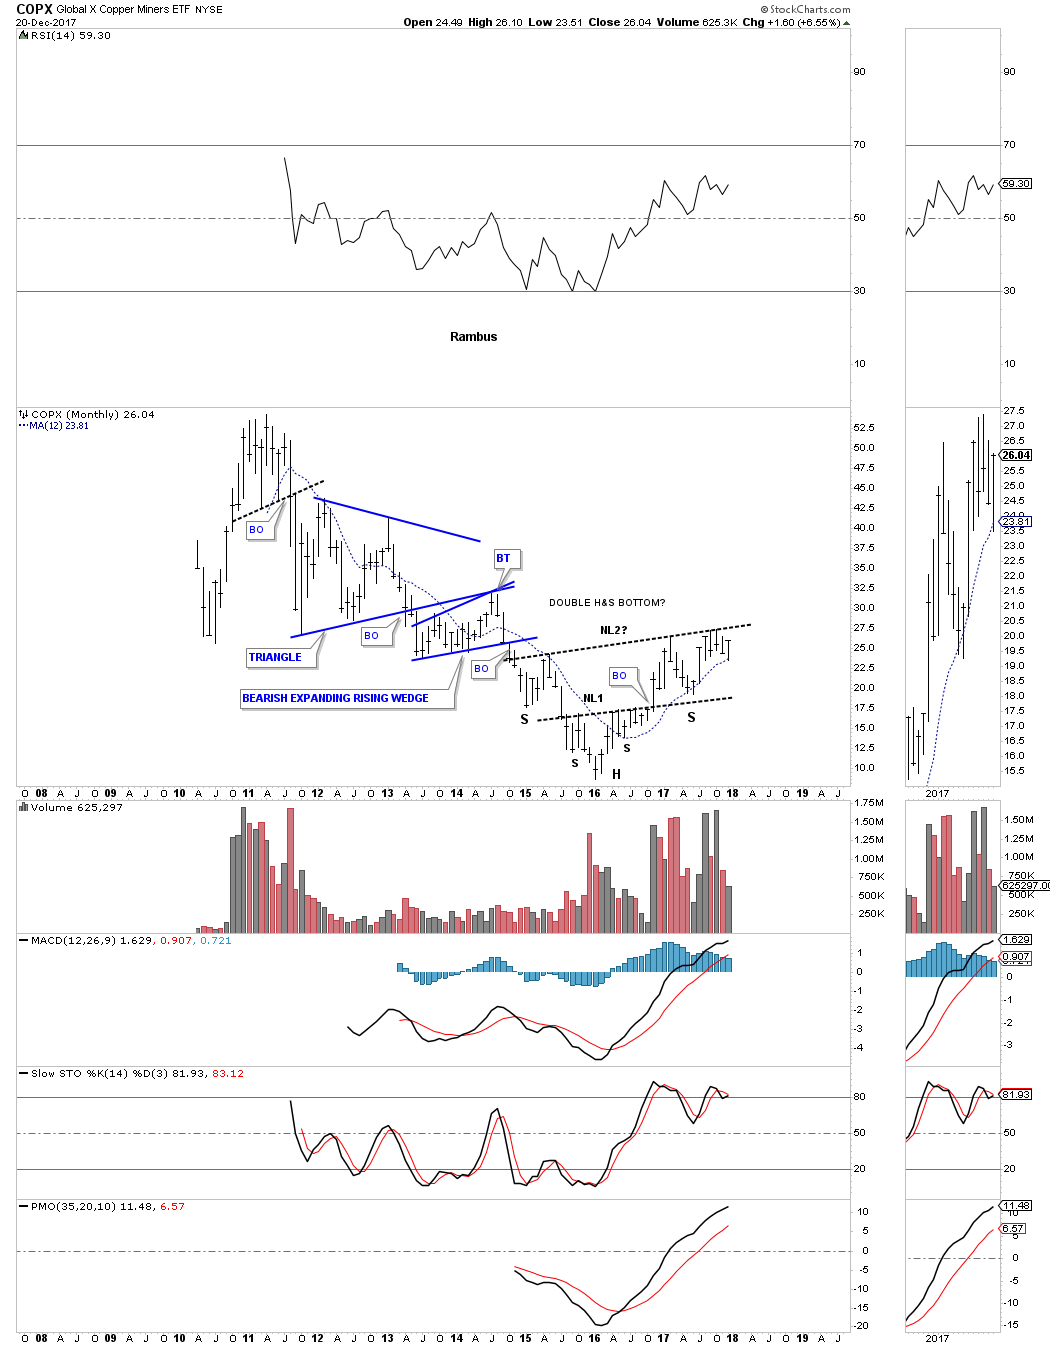
I originally took two positions, one in July and one in August of this year for the COPX, Copper Miners etf, in anticipation of the eventual breakout above the neckline which so far hasn’t happened just yet. It’s close but no cigar.
This monthly chart shows a double H&S bottom which many of the different commodities are showing. The 12 month simple moving average has done a good job of showing support during the new bull market.
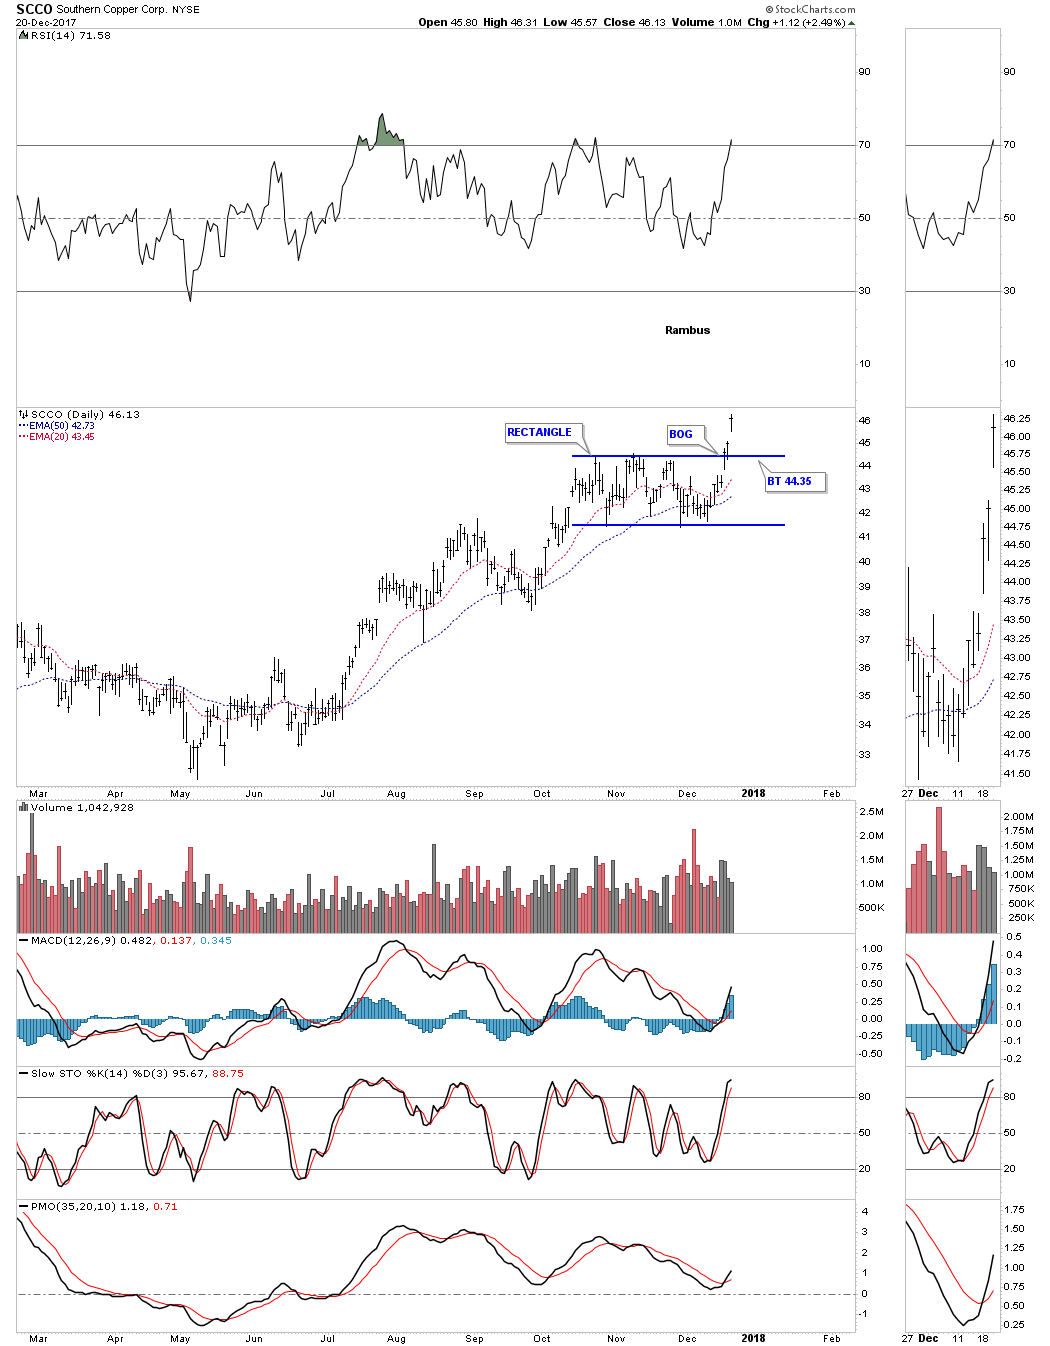
SCCO, Southern Copper, is the strongest stock in this sector. The daily chart below shows it has just broken out from a rectangle consolidation pattern with a breakout gap.
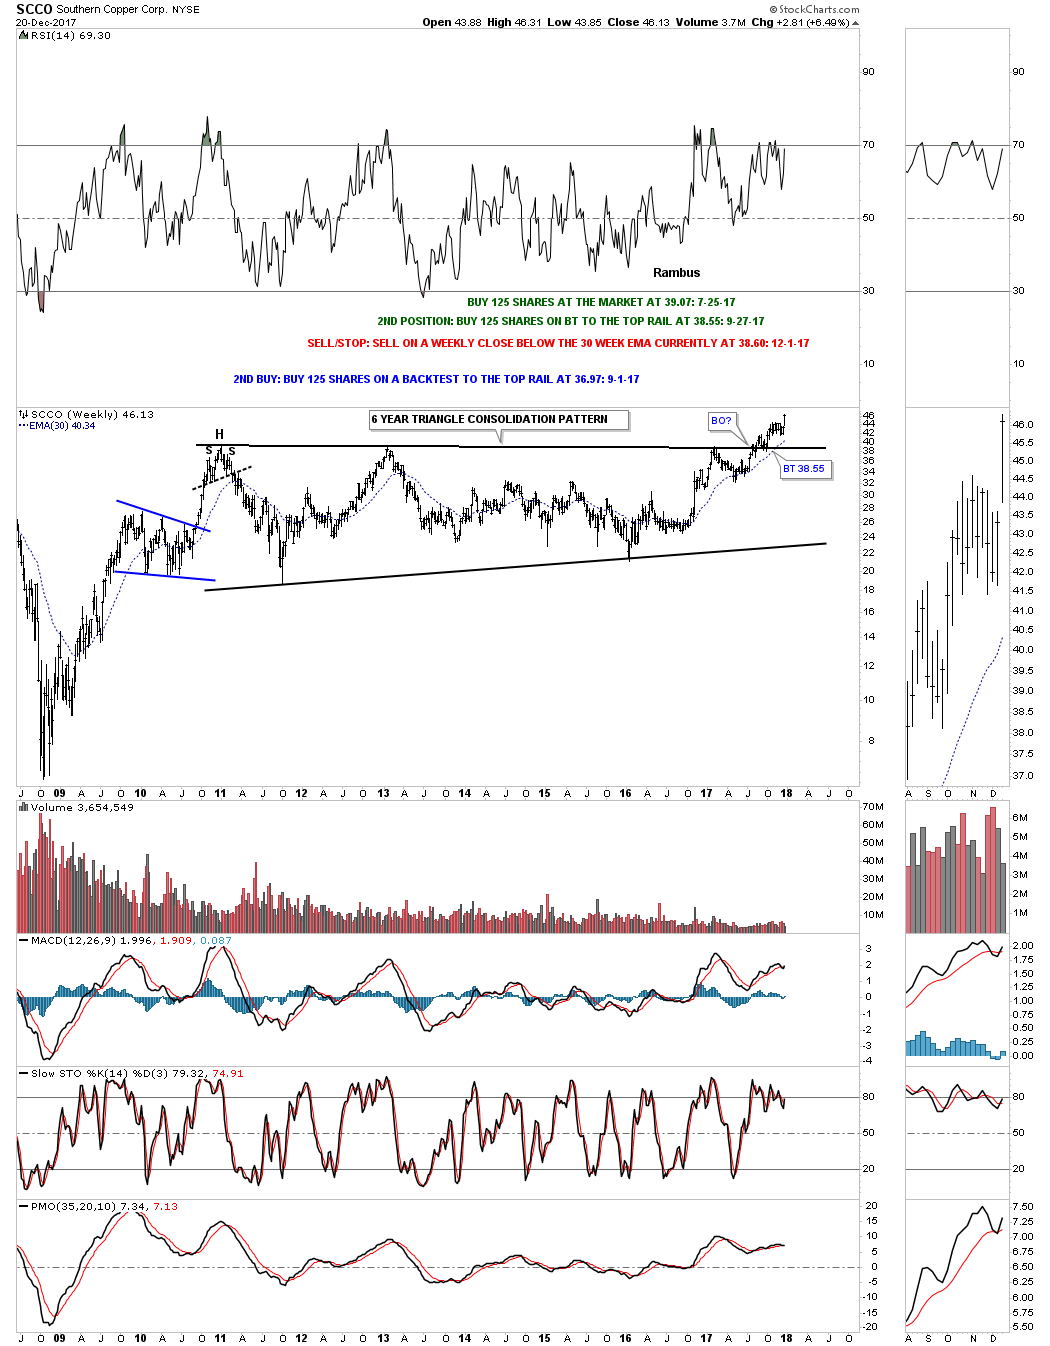
If big patterns lead to big moves then this weekly chart for SCCO says we should expect a very large impulse move higher as it’s trading at a new all time high after breaking out from a six year triangle consolidation pattern.
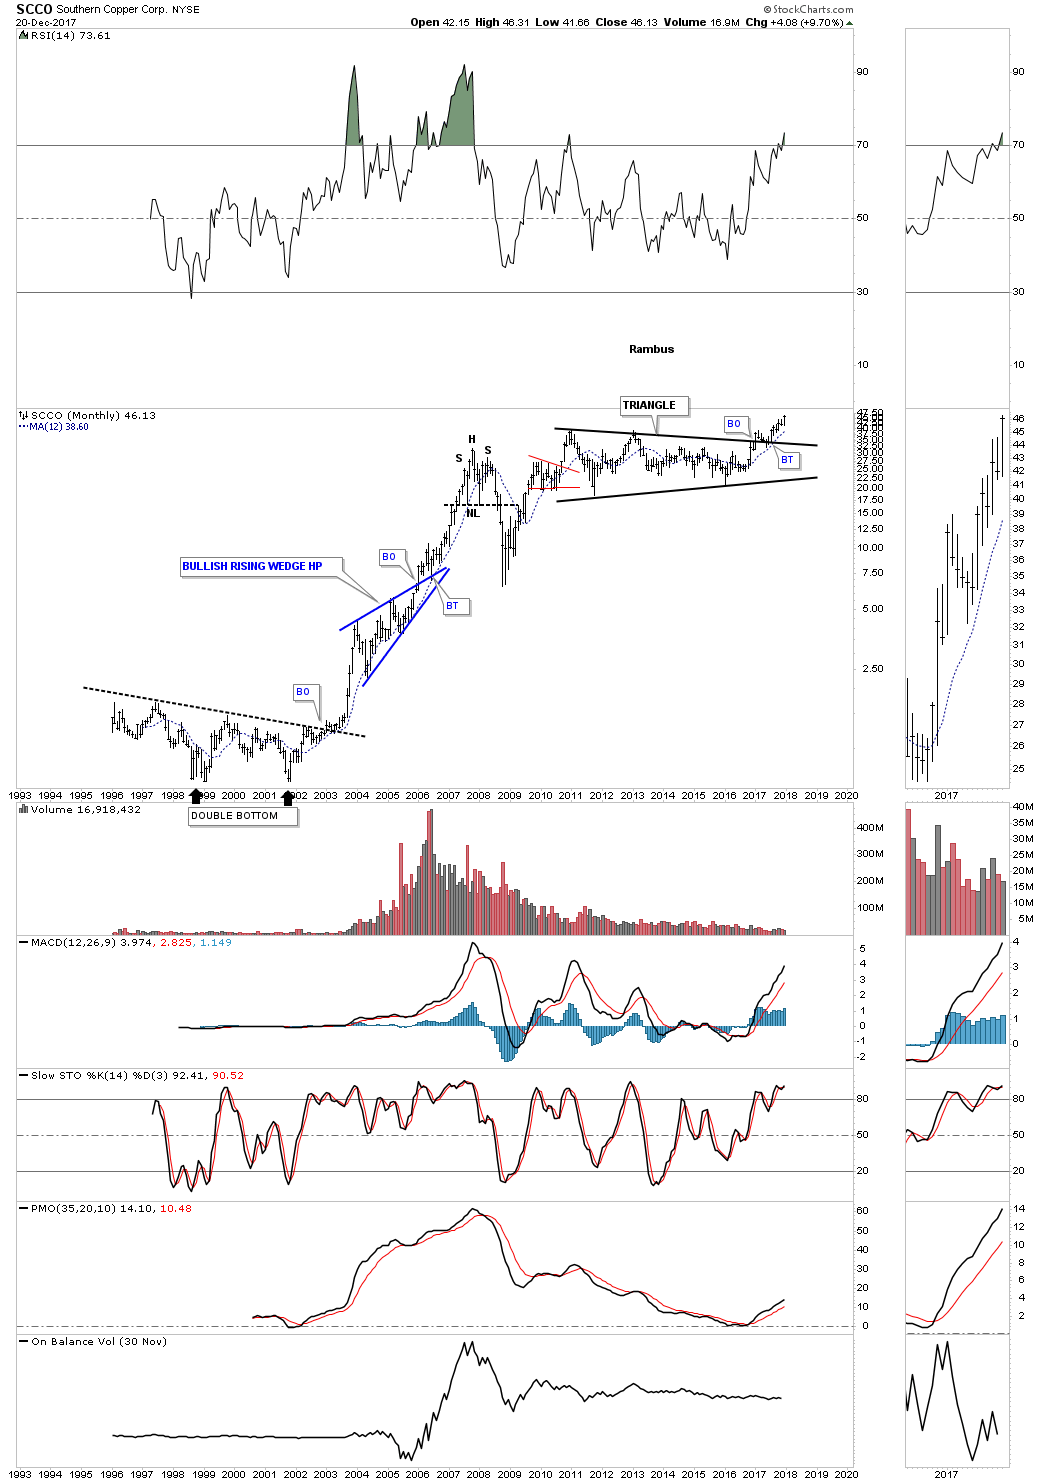
This 25 YEAR monthly chart below shows the breakout taking place above the six year triangle consolidation pattern which is now making new all time highs. Note the blue bullish rising wedge that formed as a halfway pattern back in the early 2000’s.
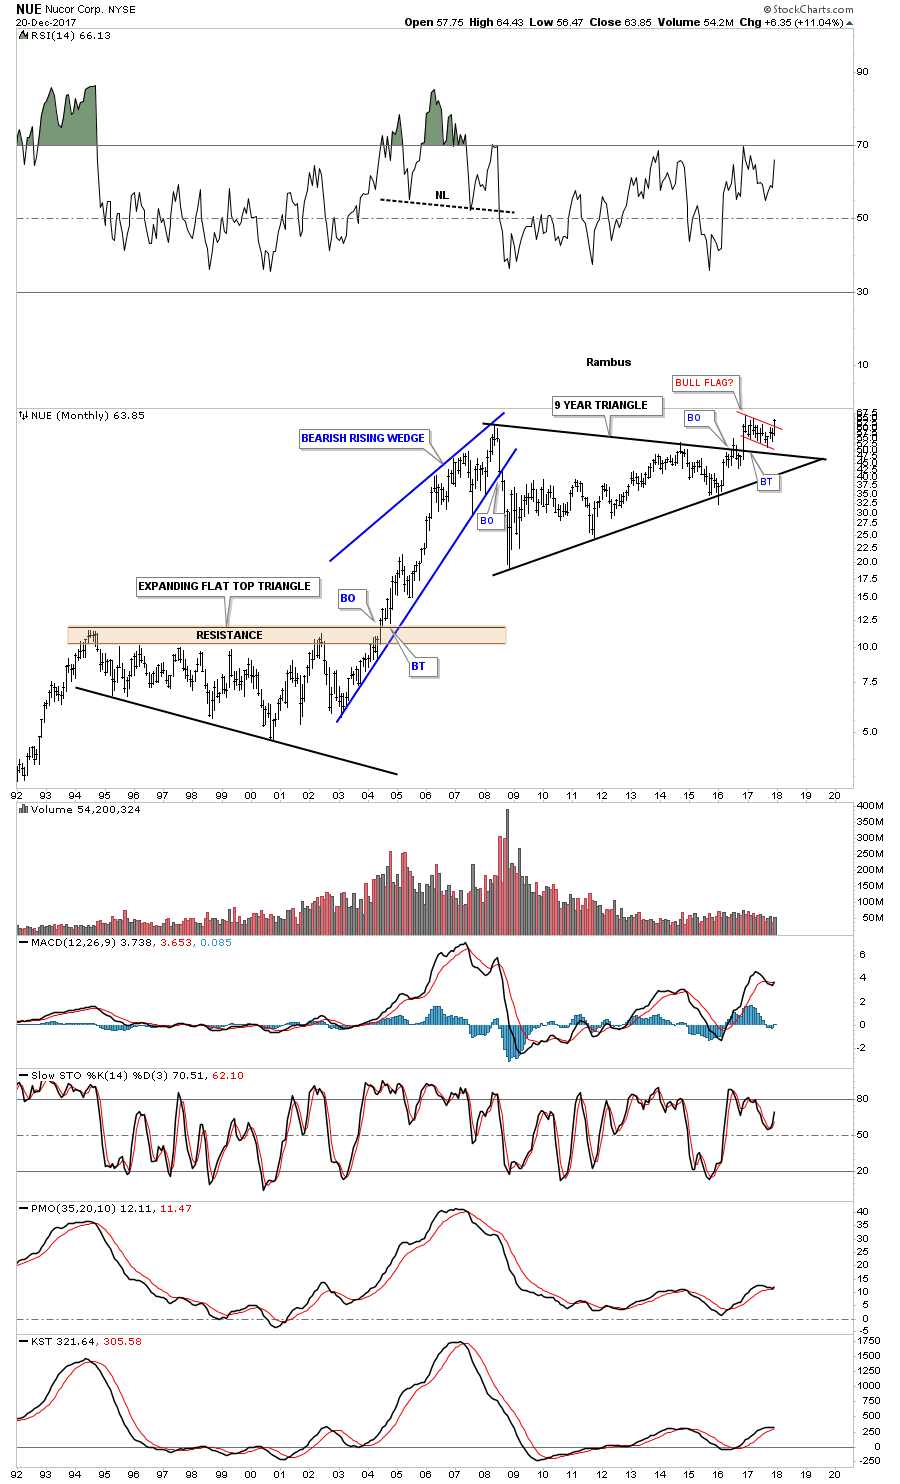
Some of the steel stocks are starting to show their pent-up bullishness as they are breaking out from major consolidation patterns. This monthly chart for NUE shows it broke out from its 9 year triangle consolidation pattern in 2016 and has been consolidating that breakout move by forming a second consolidation pattern just above the top rail which is the Red Bull flag.
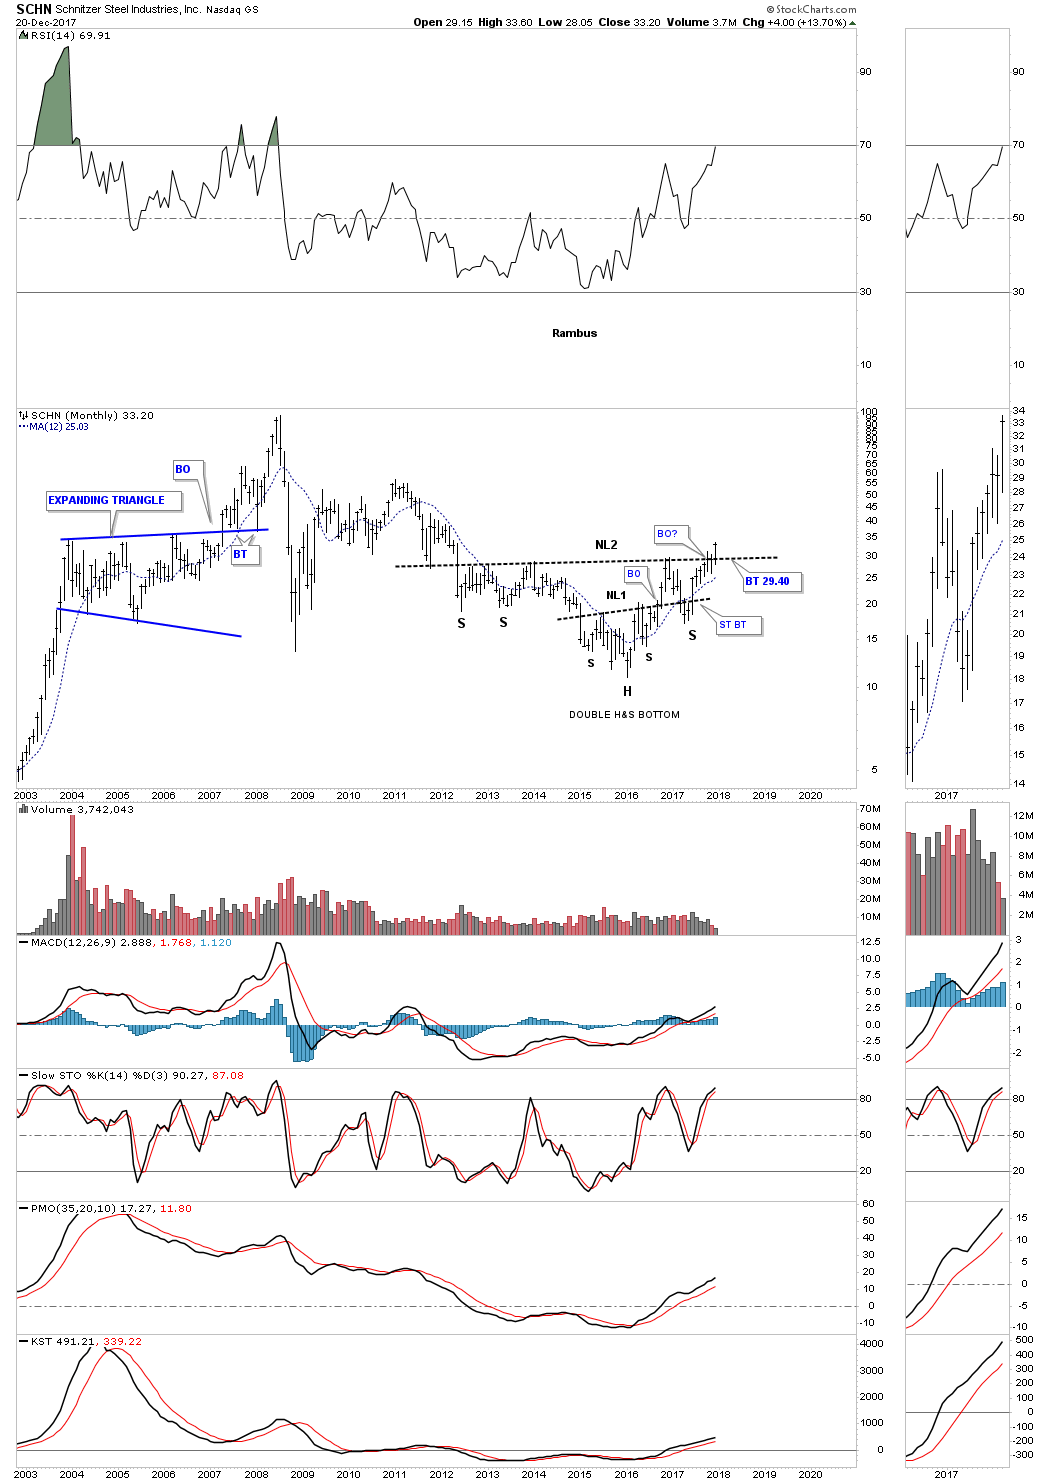
This week SCHN is breaking out from a six year double H&S bottom. You would have to go all the way back to 2011 to equal today’s high.
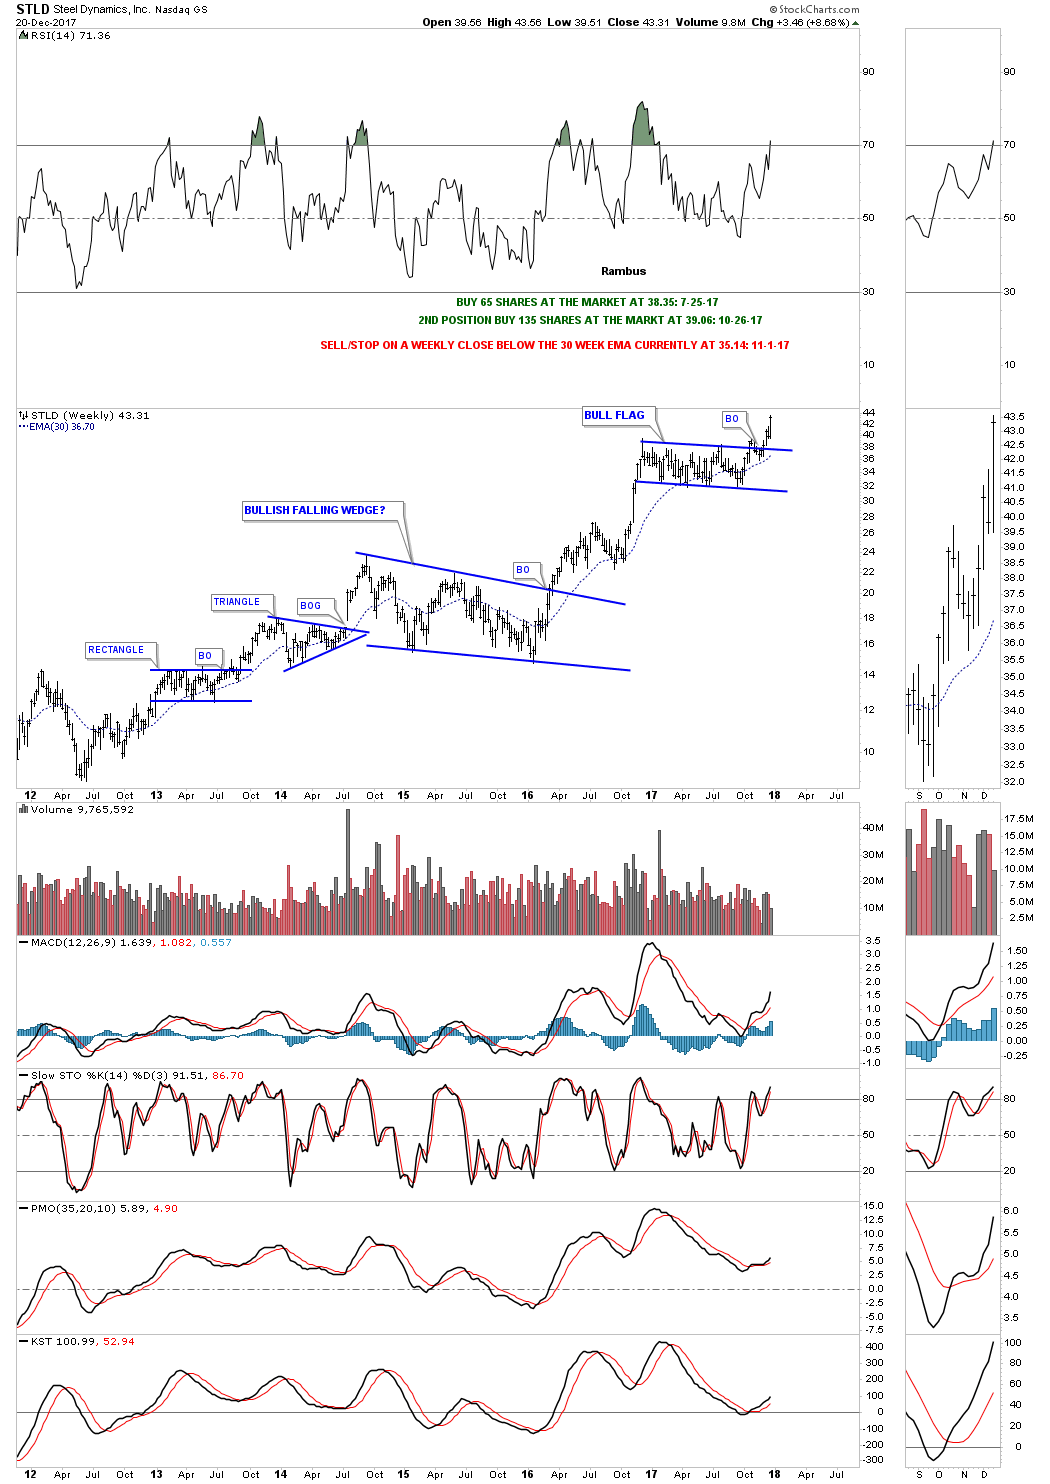
This weekly chart for STLD shows it broke out from a one year bull flag three weeks ago.
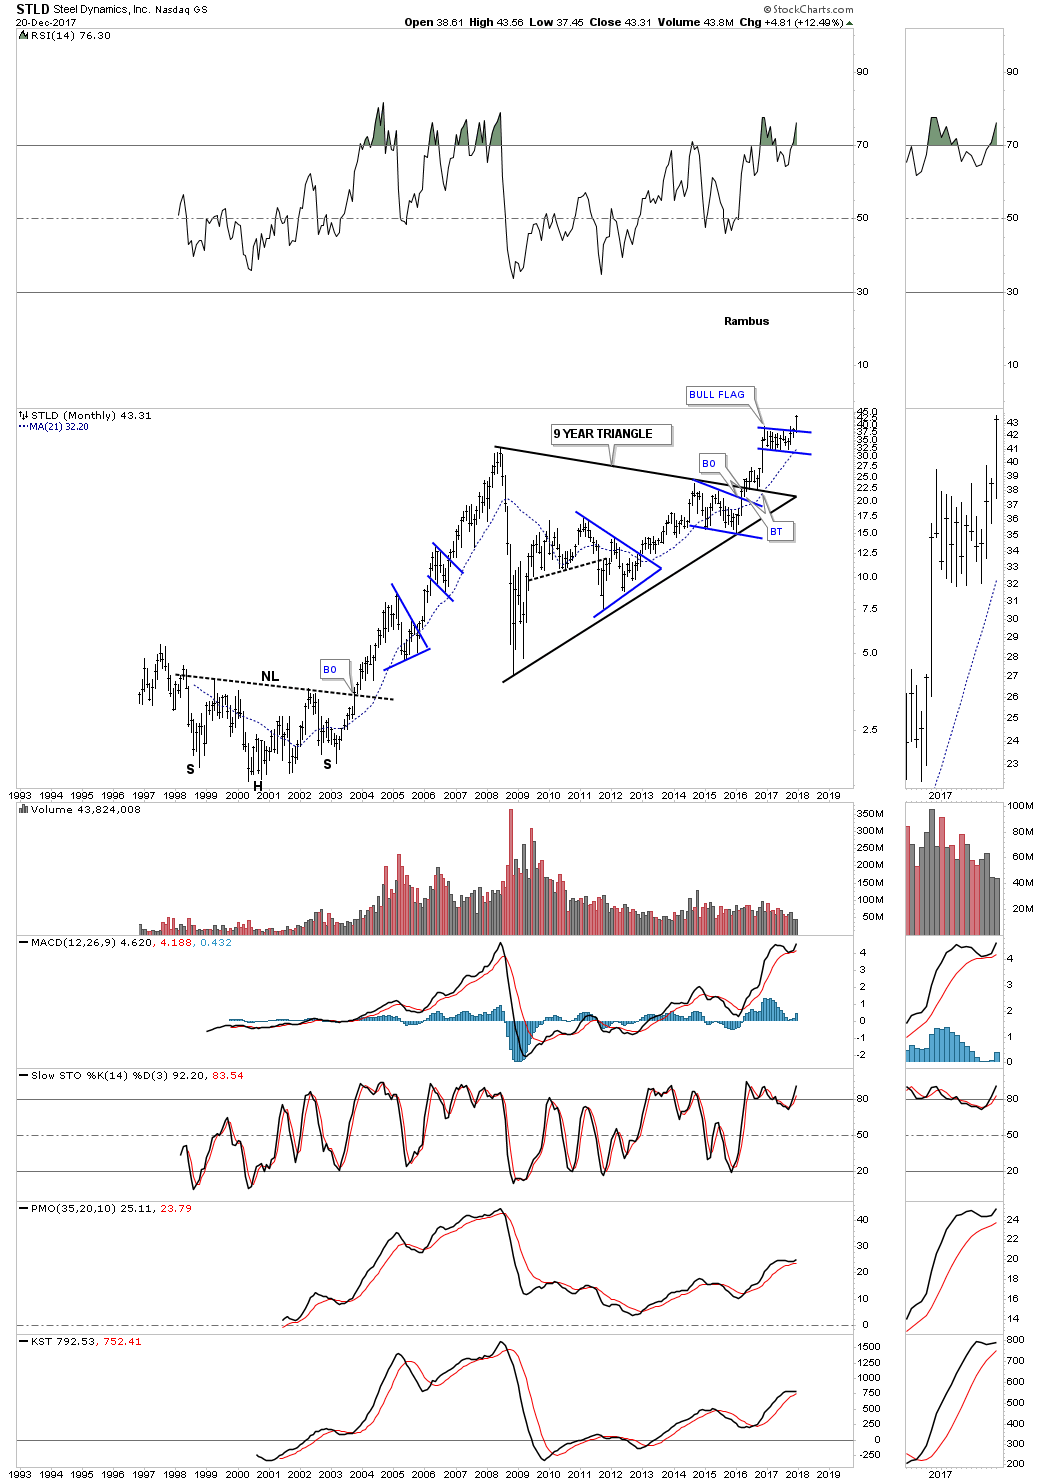
This 20 year monthly chart shows the entire history for STLD. This chart also has some nice Chartology on it. Note the 2000 H&S bottom which launched STLD on its first bull market which produced several consolidation patterns along the way. When that bull market ended in 2008 it took 9 years to build out the massive triangle consolidation pattern which is now launching STLD on its next bull market leg higher. If you stand back and look at this chart from a distance you can almost see the beginnings of a parabolic move taking place.
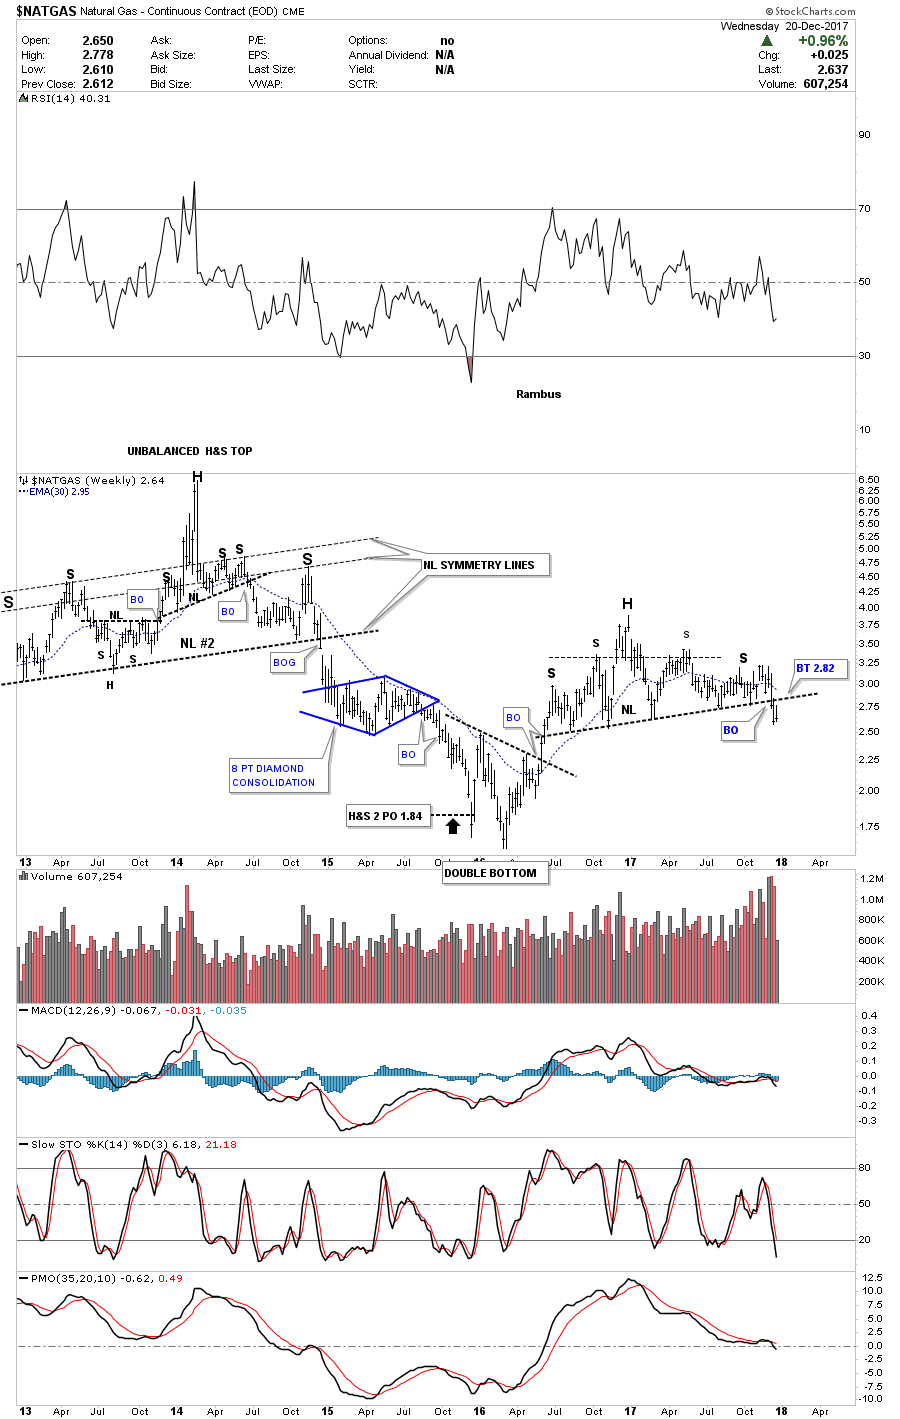
Before I run out of time I would like to show you one of the weakest areas in the commodities complex which is $NATGAS. Last week it finally broke down from a year and a half H&S top. We now have a clean line in the sand, above the neckline is bullish and below is bearish.
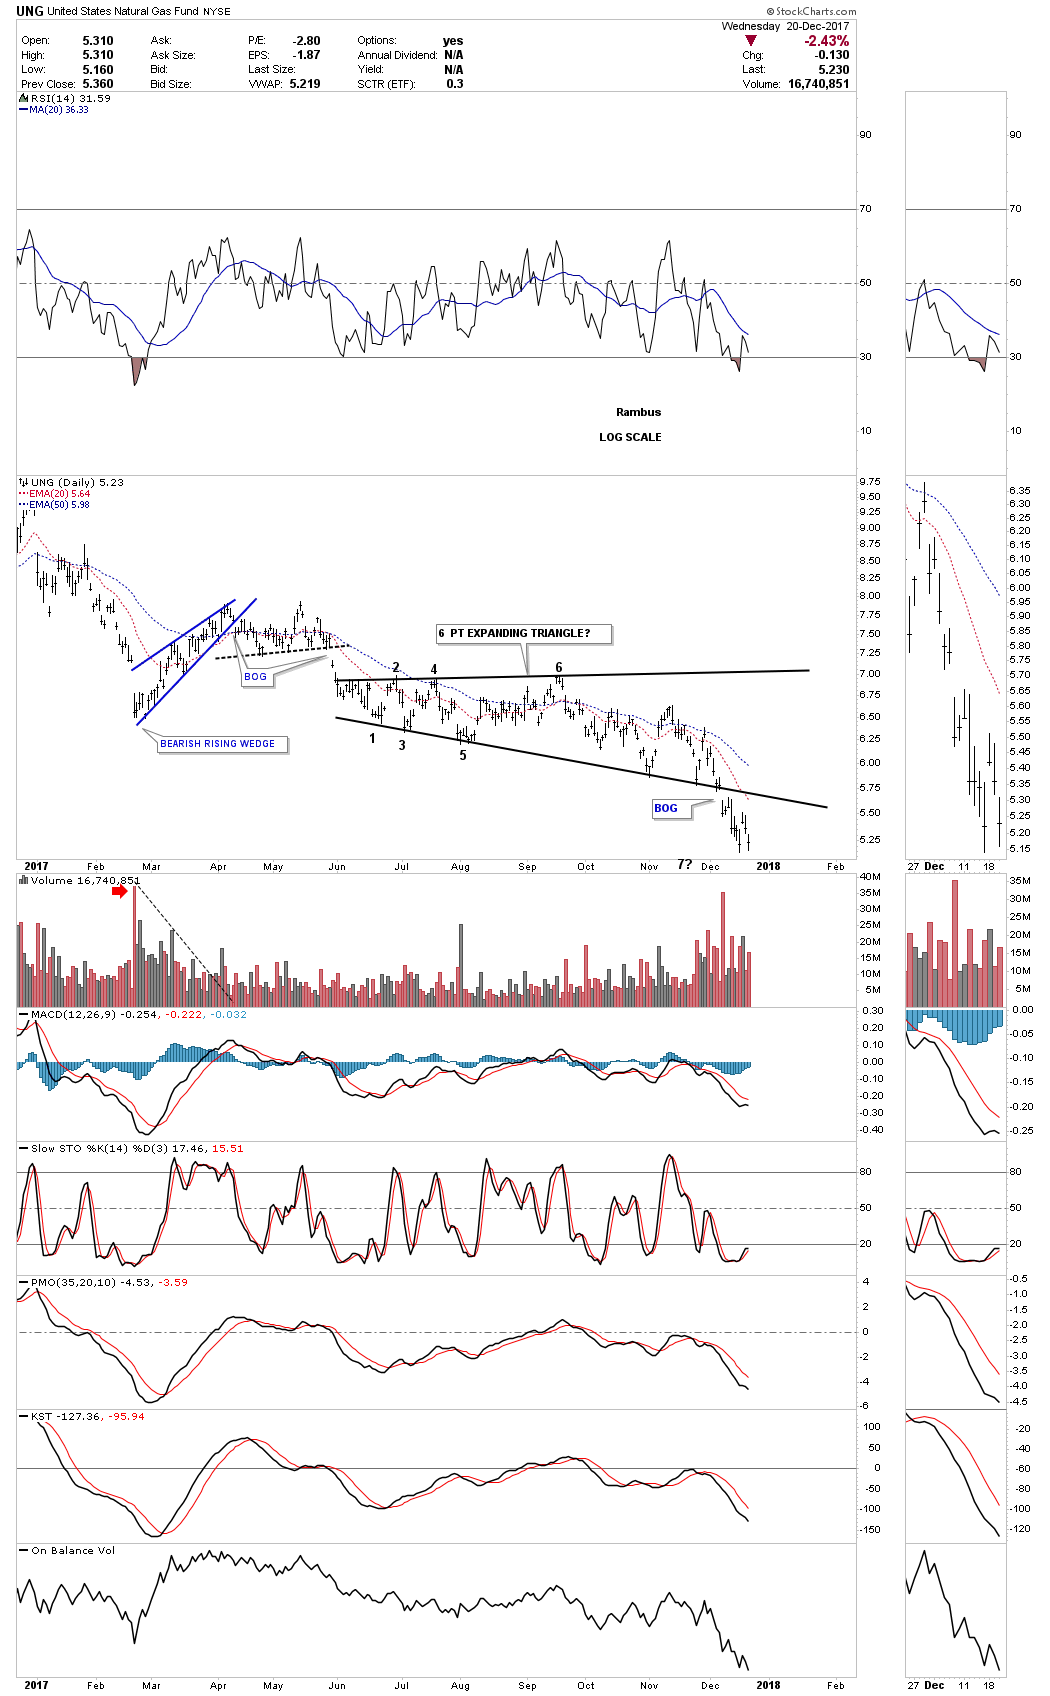
Several weeks ago I tried to go long UNG as it was testing the bottom rail of an expanding triangle. After five touches of the bottom rail I thought it would hold one last time, but that wasn’t the case. After getting a decent pop off the last touch the price action reversed straight down and then gapped the bottom trendline where I exited the trade. Again UNG is bullish above the bottom rail and bearish below.
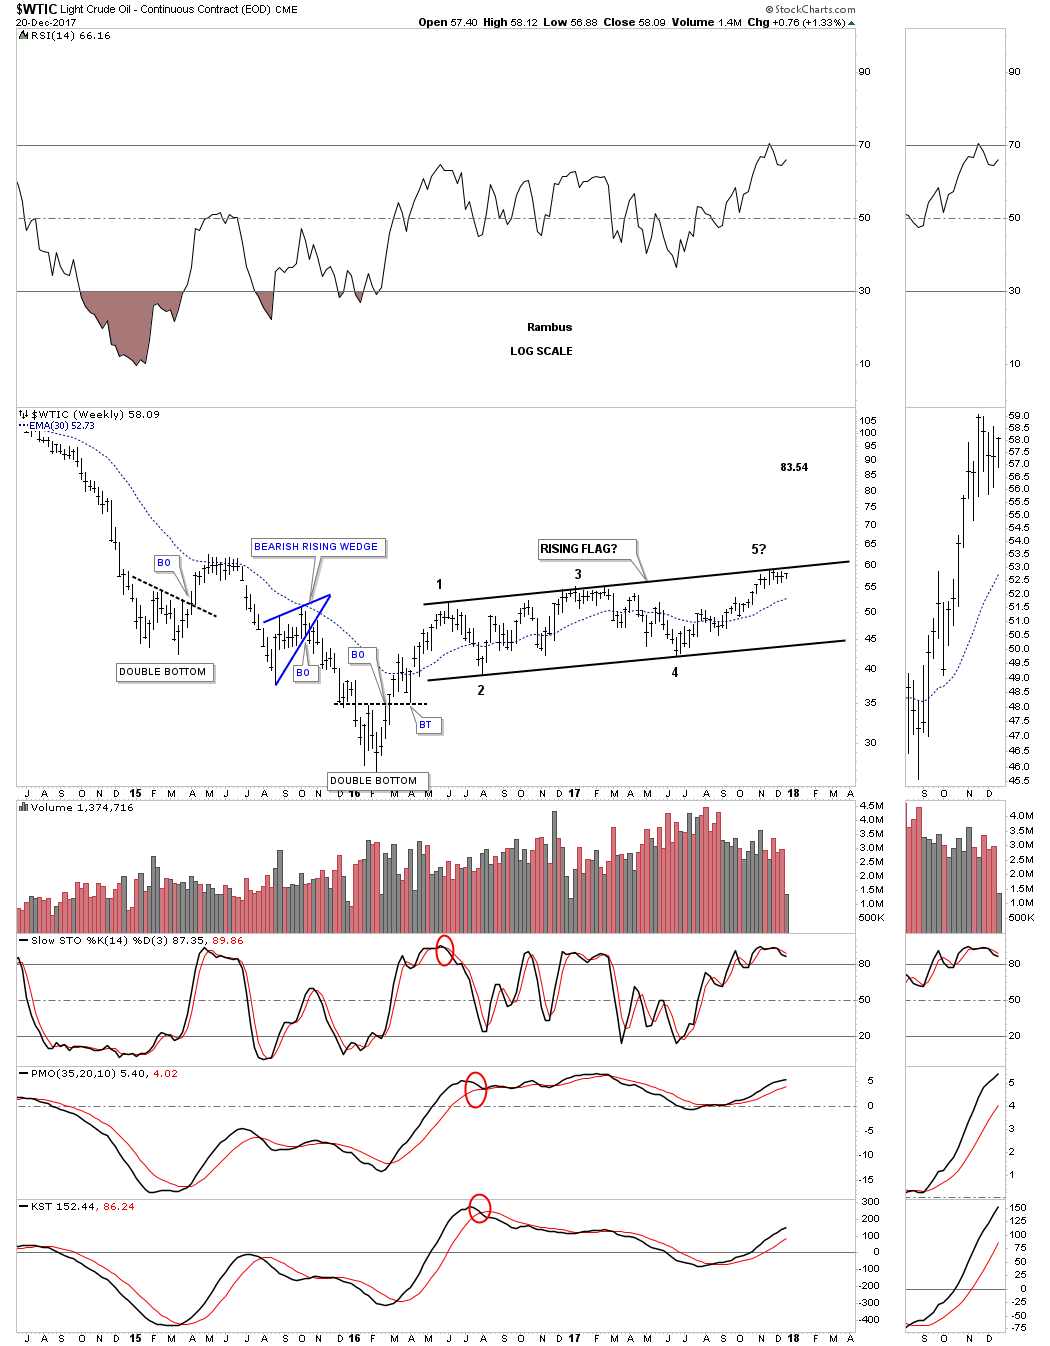
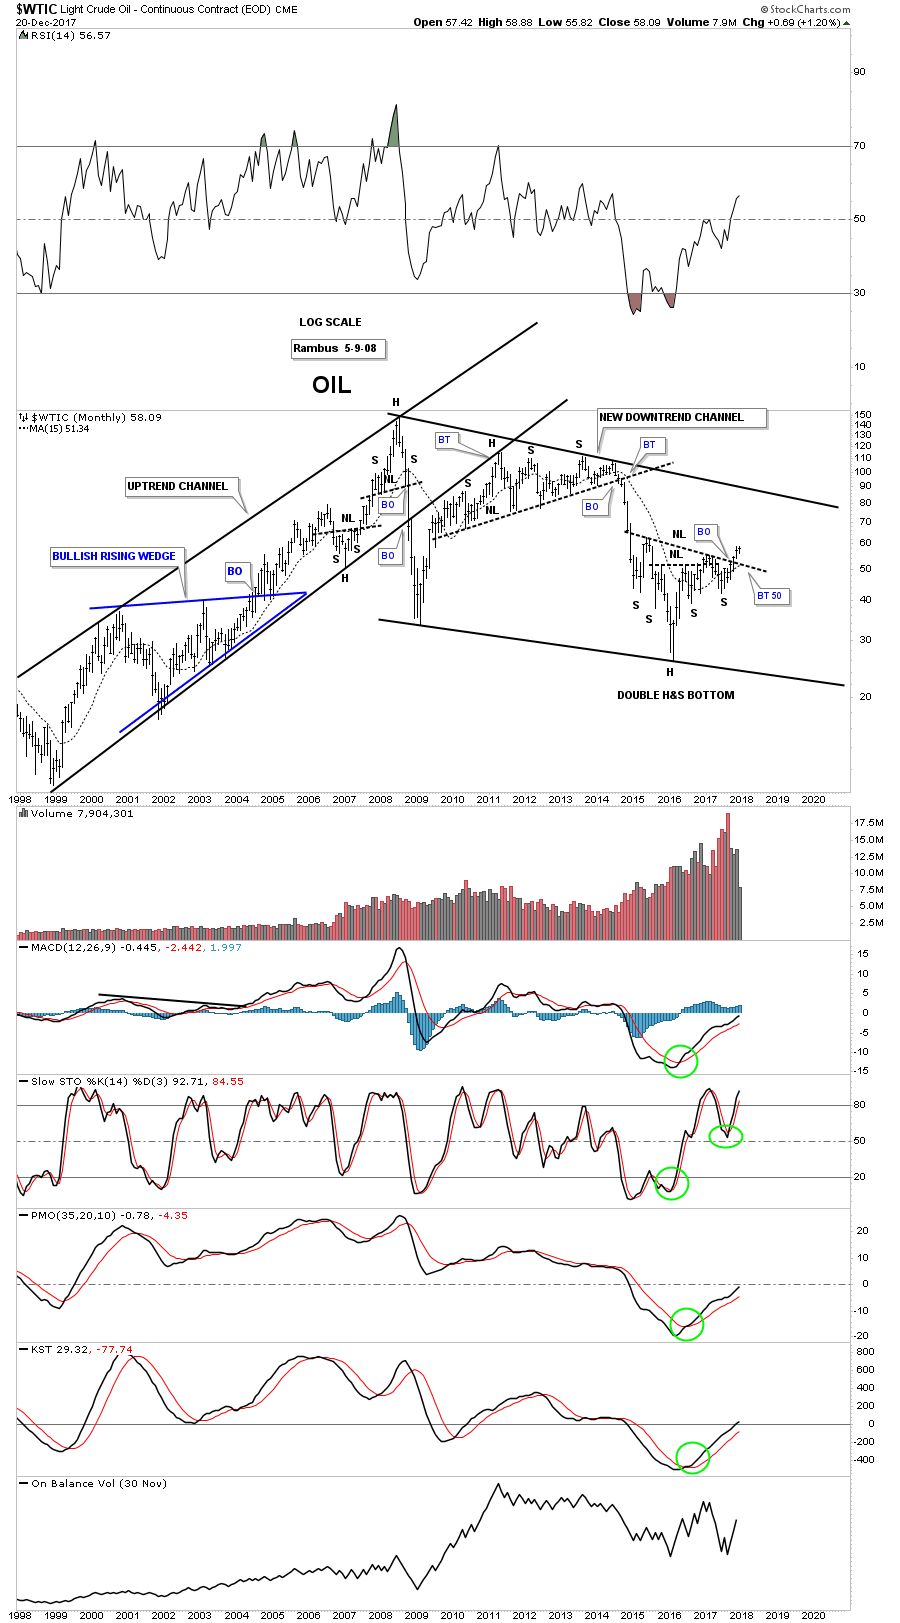
There are two patterns I’m keeping a close eye on for $WTIC. This first pattern is a rising flag formation which has just completed its fourth reversal point at the top rail. I would view the rising flag as a halfway pattern if the price action can take out the top rail.
As we’ve seen with some of the other commodity related stocks tonight many have formed a double H&S bottom reversal pattern. This 10 year daily chart for $WTIC shows it too has a double H&S pattern in play with a breakout above the neckline. The last time we looked at this chart I suggested it looked similarly inverse to that massive unbalanced H&S top, only on a smaller time frame.
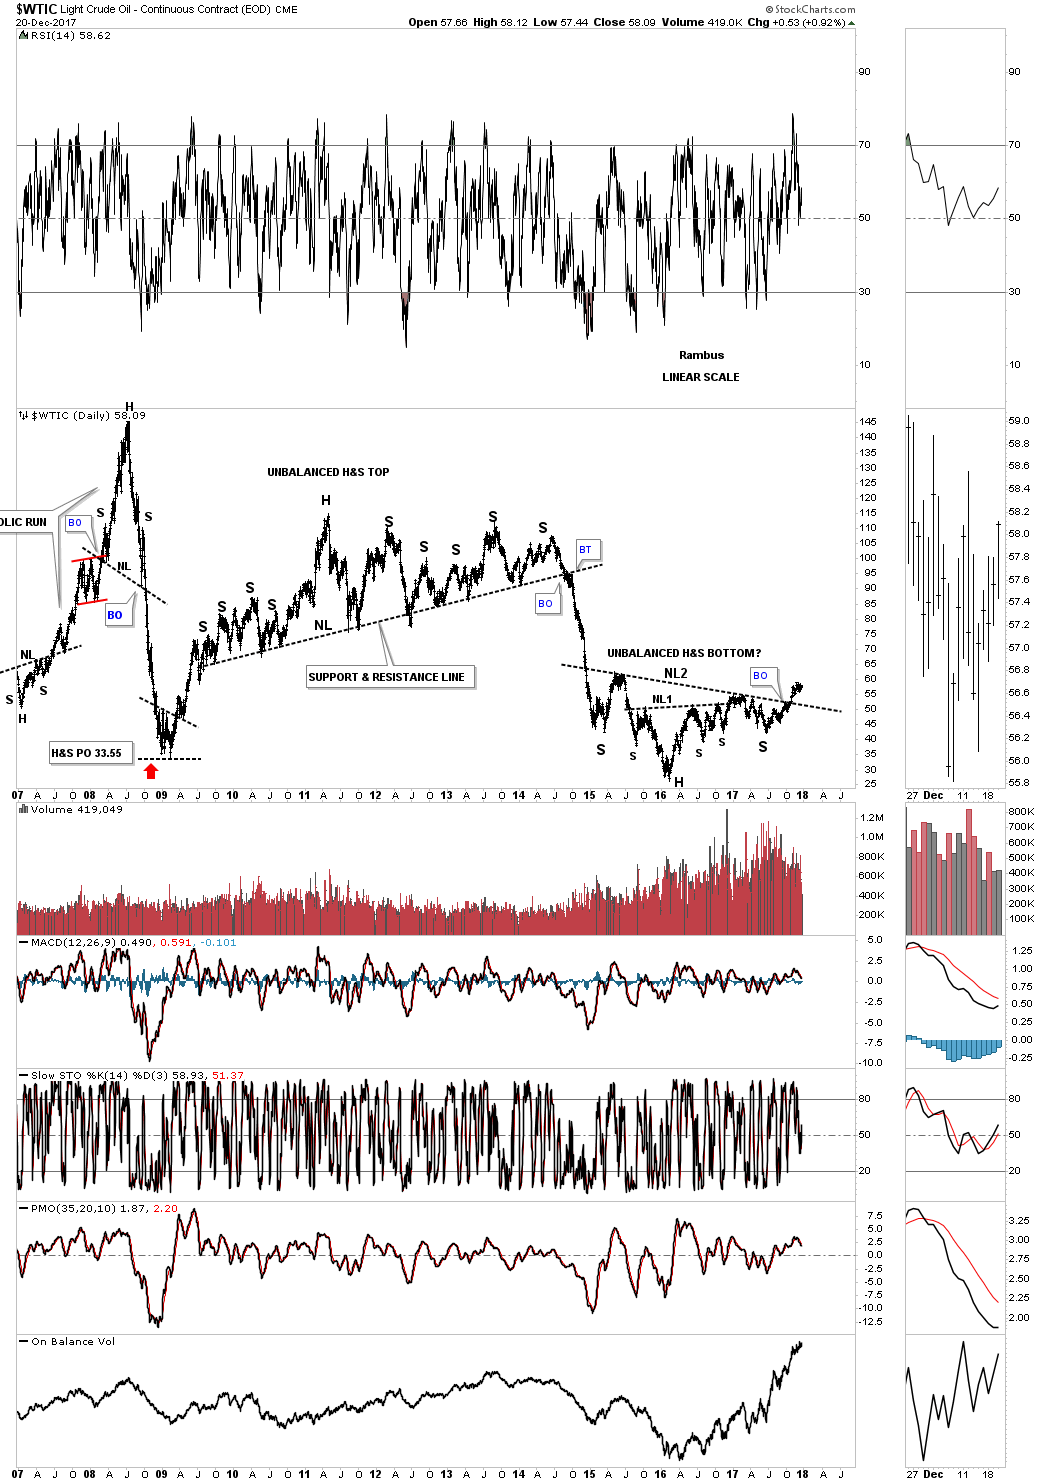
This 20 year monthly chart shows how the double H&S bottom fits into the big picture.
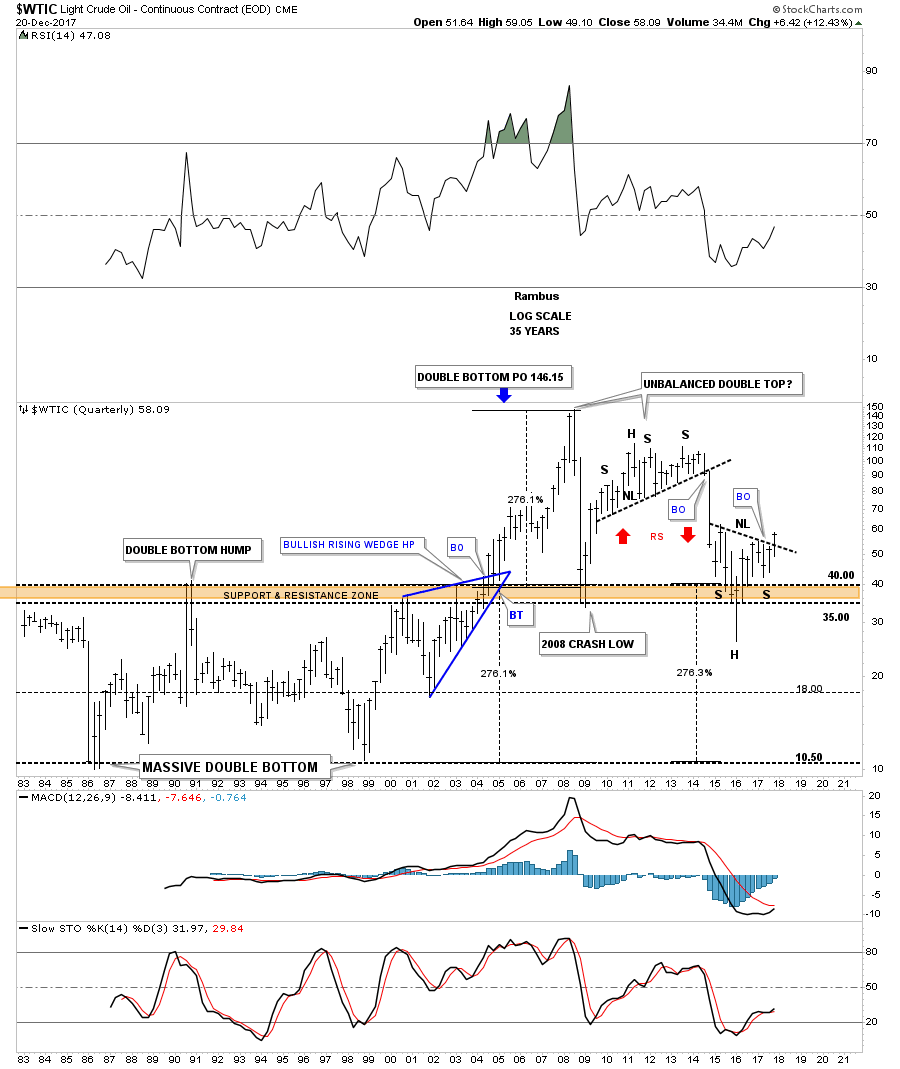
This last chart for tonight is a 35 year quarterly chart which puts everything in perspective. Keep in mind the measured move for a H&S pattern when you look at this chart. Time to get this posted. All the best…Rambus
The metals have been exhibiting as an actor in a soap opera would. They have taken us to the edge of our emotions on each and every swing, as they take us to the edge of each of our support and resistance regions, and then turn. But, I think many of you have lost the focus of the forest due to your concentration on the leaves. So, this week, I am going to open with our discussion of the leaves, and then focus on the forest. It’s time to get serious about this complex.
Ultimately, my point will be that anyone who is serious about this complex should look upon this market today as we did back towards the end of 2015, and look for buying opportunities, while keeping in mind the potential for that dreaded one more lower low. And, sometimes, the market surprises us and does not provide us with the lower low, and simply takes off. Either way, it’s time to prepare.
For the last several weeks, those that have reviewed my charts would have seen the clearly marked blue box support on my 8-minute GDX between 20.89-21.26. Moreover, we have been noting that should this support hold, we can see a strong rally off this region, and it can mark the long-term bottom in this complex. This past week, the market touched a low of 21.27, and began what seemed to be a strong rally.
(While I have been doing this for many years, I can honestly say I am still amazed at the accuracy of the turning points that Elliott Wave, coupled with our Fibonacci Pinball method, is able to provide us time and again, as we bottomed within one penny of our noted IMPORTANT support level, and the rallied to within pennies of our noted resistance.)
However, our analysis last weekend also noted that as long as 22.30 is respected as resistance, we have no initial indications of a longer-term bottom being in place. Moreover, the rally through 22.30 should have taken shape as an impulsive structure, and, to be honest, the rally off this past week’s lows counts best as a 3-wave rally in GLD, silver and the GDX.
So, yes, this action is still signaling strong potential for the dreaded one more lower low yet to be seen. But, with the manner in which the market reacted this past week, I caused me to modify my more “bearish” count in GDX to be looking for not two more lower lows, but, now, only one. As you can see, my primary count now views the rally we experienced this past week as an a-wave of wave 4 of an ending diagonal c-wave. That means we can see another rally to take us to at least 22.85 (a=c), with the potential of taking us as high as the 23.50 region (c=1.618*a) for wave 4.
I will note that the scenario I have been outlining the last few months of two lower lows pointing down to the 17-19 region is still “technically” on my radar as long as we remain below 22.30. But, I think the current micro set up is pointing to the GDX imminently breaking out over that level to invalidate that potential. So, consider that if we break 21.27 before we are able to break out over 22.35, it keeps that potential pattern alive. But, for now, I have taken it off my GDX daily chart as one of the top two potentials from a probabilistic sense, and it will only come back should we break down below 21.27 in the coming week.
Now, I am quite certain many of you are reading this and asking yourself “but can’t we simply break out from here?” And, the answer is that it is possible. But, since I do not have clear 5 wave structures off the recent lows (especially not in silver), we can view it as a 1-2, i-ii off the recent lows, which would portend a very strong rally about to be seen in the complex. And, since the pullback off this past week’s highs looks more corrective, I am going to look higher as long as we do not approach last week’s lows. In fact, I am starting to get the same sense of FOMO (Fear Of Missing Out) that I was “feeling” back towards the end of 2015 when I was strongly suggesting people be buying for the longer term.
So, this brings me to the discussion of the forest. It is really easy to get caught up in the micro-counts on these charts. It is also really easy to feel dejected or indifferent to this market due to this year and a half long pullback/consolidation we have been experiencing. So, it is time to remember that we are tracking a 2nd wave pullback off what we believe to be the VERY long-term lows struck in this complex.
As Frost & Prechter noted, “[s]econd waves often retrace so much of wave one that most of the profits gained up to that time are eroded away by the time it ends. . . At this point, investors are thoroughly convinced that the bear market is back to stay.”
Now, I think we have all read how a sizeable segment in the market is convinced that we are likely heading much, much lower in this complex. So, it does seem as though the character of a 2nd wave is exhibiting itself quite well during this decline we have been experiencing, especially since we broke the upper support back in September of 2017.
Therefore, for those investors that have a time horizon of longer than a few months, I suggest you look at the daily GDX and ABX charts. As you can see, my primary expectation is that we can surely see one more lower low in the complex, assuming the ideal pattern plays out in the coming months. However, as those who have experience in this complex know, sometimes the market does not provide us with that ideal lower low. We certainly have the minimum number of waves in place to support a complete 2nd wave structure. But, as I noted in late 2015, now is the time to be looking to deploy your capital, again, as long as your time horizon is longer than the next few months, as 2018 looks to be setting up as a very strong year for the metals complex.
See charts illustrating the wave counts on the Silver, GDX, GLD & ABX. (First published on Sunday Dec 17 for members)
Avi Gilburt is a widely followed Elliott Wave technical analyst and author of ElliottWaveTrader.net (www.elliottwavetrader.net), a live Trading Room featuring his intraday market analysis (including emini S&P 500, metals, oil, USD & VXX), interactive member-analyst forum, and detailed library of Elliott Wave education.


-
I know Mike is a very solid investor and respect his opinions very much. So if he says pay attention to this or that - I will.
~ Dale G.
-
I've started managing my own investments so view Michael's site as a one-stop shop from which to get information and perspectives.
~ Dave E.
-
Michael offers easy reading, honest, common sense information that anyone can use in a practical manner.
~ der_al.
-
A sane voice in a scrambled investment world.
~ Ed R.
Inside Edge Pro Contributors

Greg Weldon

Josef Schachter

Tyler Bollhorn

Ryan Irvine

Paul Beattie

Martin Straith

Patrick Ceresna

Mark Leibovit

James Thorne

Victor Adair