
Real Estate

In its November report, mortgage security firm Freddie Mac called 2017 the “best year in a decade” for the housing market by a variety of measures. These include low inflation, strong job growth and historically-low mortgage rates. This assessment is very encouraging, not just for homebuyers and builders and the U.S. economy in general, but also for commodities, resources and raw materials as we head into 2018.
Although past performance is no guarantee of future results, it’s still instructive to look back at how materials performed the last time the U.S. was ramping up housing starts and mortgages. The last housing boom, which peaked in 2006, was accompanied by elevated commodity prices. We could see a return to these valuations over the next couple of years on higher demand, a stronger macroeconomic backdrop and cyclical fundamentals, as shown in the following chart courtesy of DoubleLine Capital:
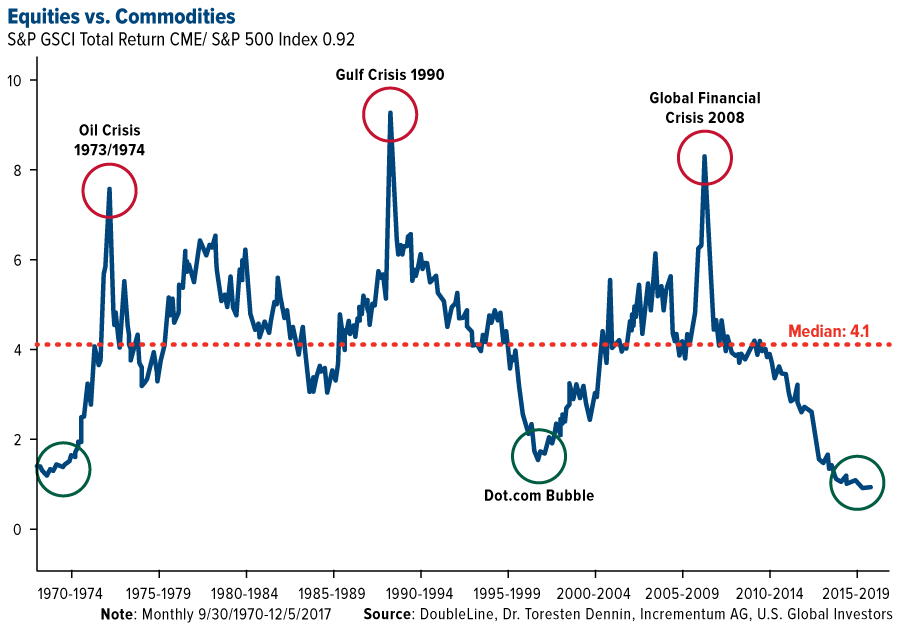
Speaking on CNBC’s “Halftime Report” last week, DoubleLine founder Jeffrey Gundlach said he thought “investors should add commodities to their portfolios” for 2018, pointing out that they are just as cheap relative to stocks as they were at historical turning points.
“We’re at that level where in the past you would have wanted commodities” in your portfolio, Gundlach said. “The repetition of this is almost eerie. And so if you look at that chart, the value in commodities is, historically, exactly where you want it to be a buy.”
A Wealth of Positive Housing Data
There’s more to support the commodities narrative than cyclicality.
For one, home builders right now are more confident of the future than they’ve been in over 18 years. December’s National Association of Home Builders (NAHB)/Wells Fargo Housing Market Index (HMI) soared to 74, eight points up from the November reading and its highest report since July 1999.

NAHB Chairman Granger MacDonald chalks up the incredible improvement in optimism to “new policies aimed at providing regulatory relief to the business community.” Other contributing factors include low unemployment rates, favorable demographics and a tight supply of existing home inventory.
In addition, new housing starts in November rose to a seasonally adjusted annual rate of 1.3 million, up 3.3 percent from October and a strong 12.9 percent from a year ago.
This is all very constructive (no pun intended), as the market is still trying to recover nearly a decade following the subprime mortgage crisis.
Millennials, the Largest U.S. Generation, Finally Entering the Market
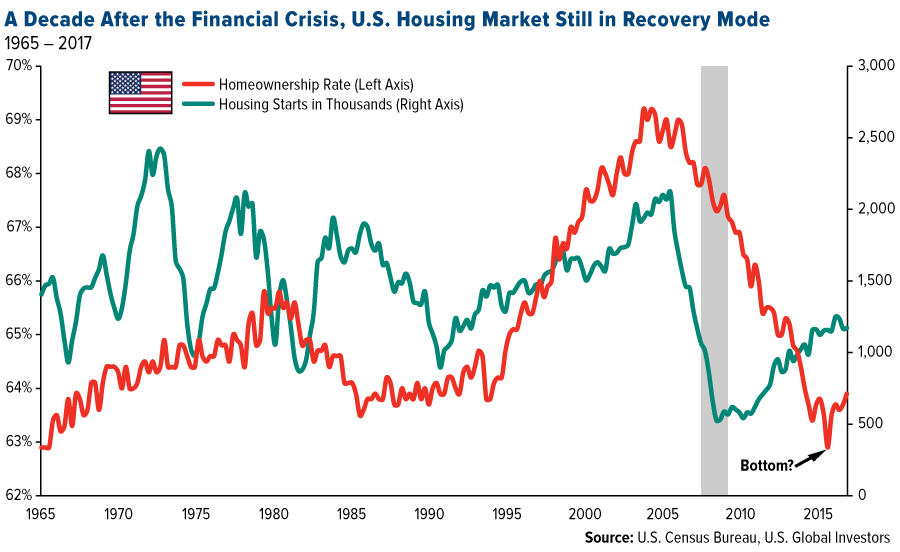
We’ve seen booms and busts in new housing starts over the past several decades, but homeownership rates in the U.S. took a huge blow as a result of the Great Recession. The rate dipped to a 51-year low of 62.9 percent in the second quarter of 2016, indicating buyers, especially first-time millennial buyers, are still struggling to save up for down payments.
Economists with the National Association of Realtors (NAR) note that student debt has played a massive role in delaying homeownership for young people, by as many as seven years on average. When asked how student loan debt has impacted their life decisions, more than seven in 10 millennials (those born roughly between 1980 and 1998) ranked “purchasing a home” as the most affected decision, followed by “taking a vacation.”
Since reaching its low last year, however, the homeownership rate has steadily improved, ending at 63.9 percent in the second quarter of 2017, a three-year high. This leads me to believe that the worst is behind us and that as the economy and labor market continue to improve, so too will demand for new homes. I also have high hopes that the tax cuts President Donald Trump signed into law today will encourage even more millennials, who have until now been sidelined, to join their older cohorts in owning a home.
Time to Add Commodities?
Indeed, all of the conditions appear ripe for another housing boom. Economic growth is on the upswing. The country is at near-full employment. Inflation and 30-year mortgage rates are also historically low.
When we factor in residential fixed investment and housing services, housing as a whole contributes between 15 and 18 percent to national gross domestic product (GDP). That’s a huge slice of the pie. And as I’ve pointed out before, housing has an extremely high multiplier effect. For every home that’s built, 2.97 full-time jobs and $162,080 in wages and salaries are created, according to a 2014 estimate by the NAHB.
Beyond that, increased home demand is good news for resources and raw materials. According to home-construction services firm Happho, for every 1,000 square feet of new housing, nearly 8,820 pounds of steel are required, as well as 400 bags of cement, 1,800 cubic feet of sand and 1,350 cubic feet of gravel and other aggregate. This doesn’t begin to touch on finishers such as brick, paint and tiles, or fittings such as windows, doors, plumbing and electrical. You can see the full infographic by clicking here.
Interested in learning how you can participate in the growing housing market? Unsure how to gain exposure to raw materials and commodities?
All opinions expressed and data provided are subject to change without notice. Some of these opinions may not be appropriate to every investor. By clicking the link(s) above, you will be directed to a third-party website(s). U.S. Global Investors does not endorse all information supplied by this/these website(s) and is not responsible for its/their content.
The S&P GSCI (formerly the Goldman Sachs Commodity Index) serves as a benchmark for investment in the commodity markets and as a measure of commodity performance over time. It is a tradable index that is readily available to market participants of the Chicago Mercantile Exchange.
The Standard & Poor’s 500, often abbreviated as the S&P 500, or just the S&P, is an American stock market index based on the market capitalizations of 500large companies having common stock listed on the NYSE or NASDAQ. The S&P 500 index components and their weightings are determined by S&P Dow Jones Indices.
The NAHB/Wells Fargo Housing Market Index gauges builder perceptions of current single-family home sales and sales expectations for the next six months as “good,” “fair” or “poor.” The survey also asks builders to rate traffic of prospective buyers as “high to very high,” “average” or “low to very low.” Scores for each component are then used to calculate a seasonally adjusted index where any number over 50 indicates that more builders view conditions as good than poor.

Listen – HERE Mp3 download.
Highlights
- Brimming with holiday cheer, Bob Hoye of Institutional Advisors rejoins the show with comments on the global financial bubble.
- The Dow could be approaching an ultimate peak – current valuations are stretched beyond those of the last equities market top of 2000.
- Bitcoin recently eclipsed the total value of Wal-mart, which should make for enlightening discussion around the holiday dinner table.
- As relatives learn that their disenfranchised Junior, Grandma Kettle and Uncle Fester, who have long shared the privilege of residing in the palatial household basement, suddenly hold enough BTC to pay off the mortgages of the entire neighborhood, a big spike in popularity is anticipated.
- One compelling BTC price estimate is $180,000.
- Gold hedge funds are turning away from PMs to Bitcoin to boost profits. Since the institutional money is finally pouring into the BTC realm.
- Bitcoin / altcoin miners are literally printing money, with the expressed blessings of the Fed / Treasury, as hubris filled authorities consider cryptos merely a commodity.
- Both the guest / host concur that the PMs offer solid relative values, with silver the more enticing of the two.
- The TEZOS ICO** with a minimum investment of $250 recently launched in pre-ICO skyrocketed to $12 (Figure 1.1.).
- Investors could reap a 20 fold increase in the $250 investment.
- Futures are trading on BitMEX for pennies using 100x’s leverage or no leverage at all, plus BitHTC.
- Berkshire Hathaway Shares trade for $300,000 – where is the Bitcoin Bubble when Bitcoin is 20 times cheaper?
- The much anticipated B2X fork will take place around December 28th!
$4,000 * 450M / 10M = $180,000
Now that gold hedge funds are turning to Bitcoin to boost profits, will the new institutional interest transfer to the herd as usual, resulting in a feeding frenzy, catapulting price into the vicinity of $100k? Berkshire Hathaway Shares trade for $300,000 – where is the Bitcoin Bubble when Bitcoin is 20 times cheaper? Bitcoin / altcoin miners are literally printing money with the expressed blessing of the Fed / Treasury, as authorities in their hubris consider cryptos only a commodity, not real money. Both the guest / host concur that the PMs offer solid relative values, with silver the more enticing of the two – both anticipate a new bull market rally in the sector.
Figure 1.1. TEZOS pre-ICO futures on HitBTC

Note: Graph prepared by Chris G. Waltzek – courtesy of HitBTC.

US treasuries are seeing action we have not seen for a while: Strong sharp steepening of the yield curve.

The yield curve is said to steepen when the spreads between short-term and long-term rates increases. The yield curve flattens when spreads shrink.
- A bearish steepener occurs when rates are rising and long-term yields are rising more than short-term rates. Spreads widen.
- A bullish steepener occurs when rates are falling and short-term rates are falling faster than long-term rates. Spreads widen.
- A bullish flattener occurs when rates are falling and long-term rates are falling faster than short-term rates. Spreads narrow.
- A bearish flattener occurs when rates are rising and short-term rates are rising faster than long-term rates. Spreads narrow.
The terms bearish and bullish refer to capital gains (bullish) or losses (bearish) if one is invested in government bonds.
Bearish Steepener Meaning
A bearish steepener is generally a sign that market participants believe the economy is getting stronger and the Fed (Central Bank), will be hiking rates faster than previously anticipated or more than anticipated.
What Happened Today?
- The housing market was stronger than expected: Housing Starts Jump More Than Expected: Economy Overheating?
- The current account deficit shrank more than expected: Current Account Deficit Shrinks Due to Hurricanes
June Rate Hike Odds

Synopsis
- The Fed Funds rate is currently 1.25% to 1.50%
- The odds of two quarter point hikes through the June meeting increased from 32.5% yesterday to 38.1% today. This is consistent with the bearish steepening of the yield curve.
I did not believe the Fed would hike as much as expected in 2018, and today does not change my mind.
By Mike “Mish” Shedlock
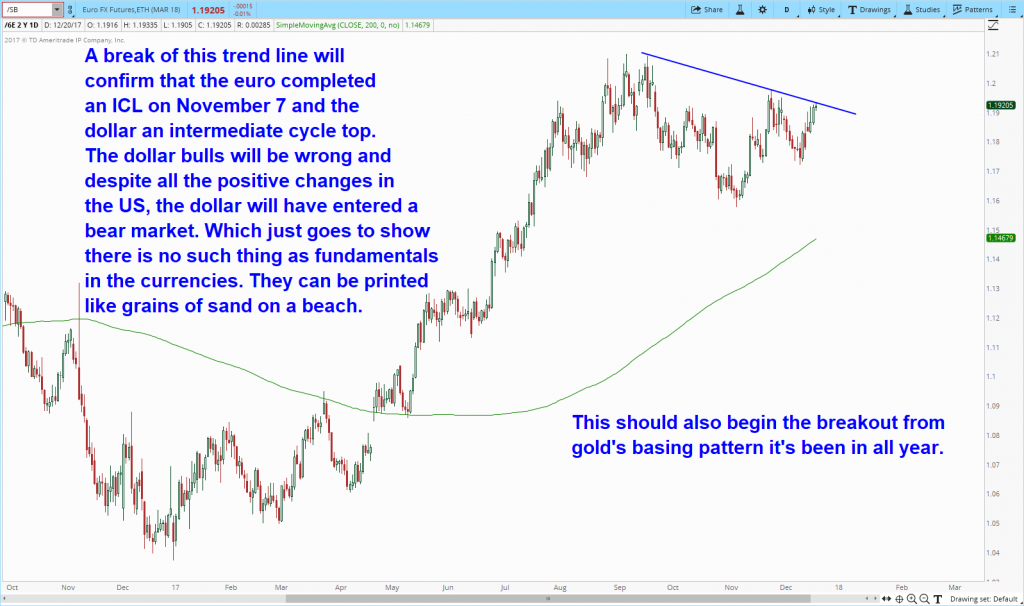
A break of this trend line will confirm that the Euro has entered a bull market and the dollar has entered a bear market. Gold is expected to finally be released from its year-long basing pattern.
Precious metals expert Michael Ballanger explains why he finds gold stocks “dirt cheap.”

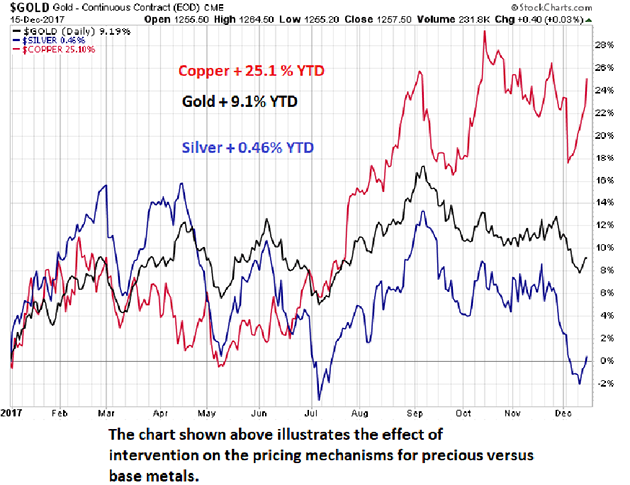
Here is a really good question. Anyone out there lose money trading gold and silver or related mining shares in the past couple of months? I did. My friends did. The bulk of the managed money (hedge fund) players did. However, it’s all “JUST FINE” because the Dow and the S&P hit all-time highs again as the last vestiges of the post-2008-GFC rescue reflation is now SURGING into paper assets. More importantly, those bullion bank millennials that were hired by their uncles and fathers and grandfathers in the banking business with EXPRESS INSTRUCTIONS to contain and control precious metals have now been given leave to TAKE PROFITS. Parties will be attended; frivolity and joy will be experienced; and massive bonuses will be paid. And the prices of gold and silver reside at levels representing 9.1% and 0.46% returns, year-to-date, versus 28.86% for the NASDAQ and 1,761% for Bitcoin. Is it any wonder why this new generation of investors ignores the precious metals complex like the bubonic plague?
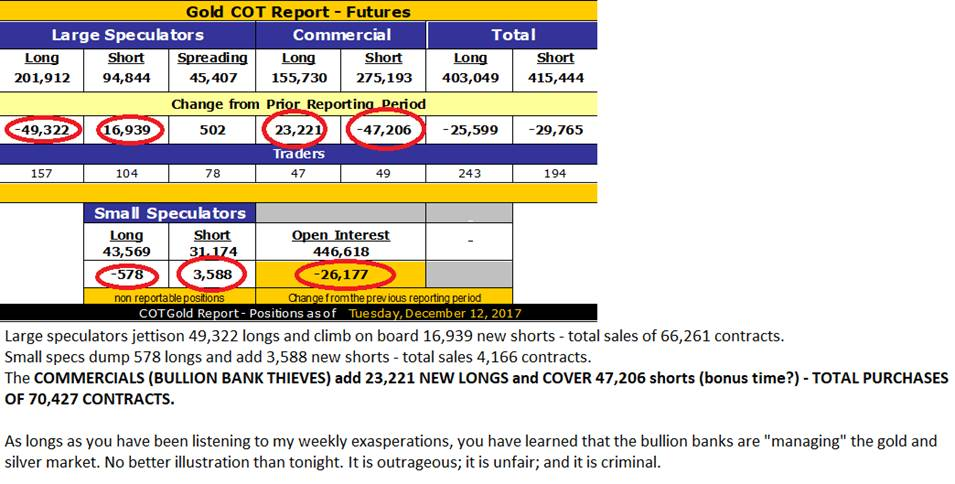
Friday’s COT report (as predicted) sent waves of revulsion through every nook and cranny of this portly countenance while sending my beloved canine howling into the upper regions of the house, certain beyond all doubt that wine bottles, coffee mugs, computer monitors, and the like were destined for flight paths not unlike the space shuttle on a clear day. The inappropriate and inordinately loud string of profanities and other rage-ridden invectives came as a result of the revelation of a massive reduction in the aggregate short position in gold and silver futures held by Commercial traders, otherwise known as bullion banks. As maddening as it was, it confirmed that greed rules the waves of highly motivated behaviors that exist today in the financial markets.
I opined at the end of November that “Bullion bank short covering will become year-end profit-taking” and received confirmation last Friday when they covered the equivalent of over 5.6 million “ounces” and it set a floor for pricing as it closed with its first weekly gain in the past four and only the third up week in the last twelve. The good (and possibly GREAT) news came Friday afternoon with a 70,427-contract swing comprised of new long and covered short positions and one of the top five Commercial purchase COT weeks in history. This is a classic repeat of the lows seen in early December of 2015 and while not as extreme in terms of the aggregate short position, the size of the drawdown was breathtaking and bullish for the near-term outlook. But then again, that was the analysis I gave in late November and again last week and continue to believe that the gold miners are dirt cheap here and certainly less stretched than the valuations virtually everywhere else. There are no champagne flutes tinkling at the gold miner parties this year; it has been a “beer and pretzels” year and not a great deal of fun.
There is an expression that has stayed with me since my early days as a commodities broker that came as a quote from a book I read highlighting stories from the soybean trading pit at the Chicago Board of Trade where the legendary Richard Dennis ruled the roost. “When they’re yellin’, ya should be “sellin’ and when they’re cryin;, ya shud be buyin’!!!” was the nuts and bolts of the phrase as it clearly defined one critical rule for trading against human emotion.
And, yes, there was indeed a time when one could utilize human fear and greed as a trading tool but that went the way of the dodo bird when the bankers decided to allow computers to manage markets and set prices arbitrarily by digital committee. The elitists that are now in control of the programmers and software engineers are, however, in full grasp and grapple of what is needed to keep the throngs at bay and avoid the storming of the banker Bastille complete with pitchforks and torches. They need rising paper markets! Whether it is Bowie Bonds or cryptocurrencies or blue-chip stocks or social media, give the legions of terminally indebted university grads the hope of enrichment and credit-relief by way of ANYTHING that can be bought, sold, traded or shorted, as long as it creates “flow” upon which the bankers can slice off their piece of flesh. Global “growth” is now 100%-dependent upon the financial economy with production of literally everything the responsibility of either robots or slave minimum-wage labor located in Third World sweatshops and Emerging Market warehouses. And this peculiarity is eventually going to rise up and bite the elitist price managers squarely on the backside.
Here in Canada, the Toronto housing bubble has made geniuses out of morons and millionaires out of part-time, construction-site laborers (not that there is anything wrong with work of that ilk) but you get my point. It has turned the city into an elitist stronghold and Asian mecca (again, nothing wrong with meccas or strongholds) but gone forever is the distinctive ethnic influence of the Irish, English, and Scottish ancestry that founded the city and morbidly diluted is the dominant influence of the Italians that built it later into the massive megalopolis that it has become. The Chinese money gorging on Toronto property is not just the result of “easy money” lending policies back home but more so “easily-printed-out-of-thin-air-money” that has been the national policy instrument allowing the migration of hundreds of thousands of cashed-up immigrants into the Canadian market place. The result has been infinitely unfair advantages for the holders of the Chinese shadow banking paper that gets easily converted to loonies and toonies and winds up in the hands of former residents of WASPy neighborhoods such as Rosedale and Forest Hill.
Now that speculators around the world have moved way beyond “yellin'” to the fever pitch of high-pitched, megaphone-assisted “howlin'”, the contrarian clarion call for equal and opposite reactions otherwise known as “sellin'”is long overdue. Similarly, the “cryin'” in the gold and silver pits and in the boardrooms of the junior exploration companies has been amplified to sound like Jerusalem’s Wailing Wall on a particularly bad day. Accordingly, the Senior (GDX/NUGT) and Junior (GDXJ/JNUG) gold miner ETFs are the items I will be “buyin'” as a suitable response to all that “cryin'”.
So, enjoy the rest of the month as we all race around completing our lists, emptying our bank accounts, and doing what we can to celebrate whatever it is we are supposed to be celebrating, be it religious or monetary or familial. I intend to curl up in my favorite recliner with a good book and a fine Chianti while sufficiently self-medicated to keep Fido calm and comfortable. Meanwhile, my significant other monitors gold and silver prices on an hourly basis, clad in her battle fatigues, her army-surplus flack jacket, mace canister, and emergency fog horn for that ominous moment where I descend into a calamitous state of unbridled rage. Based on the recent actions of the bullion bank behemoths, all should be well and good at least into late next month, after which we shall see.
Next update will be the 2018 Forecast Issue where I try to avoid total embarrassment. Minor embarrassment would be a bonus; accuracy would be heaven.
Originally trained during the inflationary 1970s, Michael Ballanger is a graduate of Saint Louis University where he earned a Bachelor of Science in finance and a Bachelor of Art in marketing before completing post-graduate work at the Wharton School of Finance. With more than 30 years of experience as a junior mining and exploration specialist, as well as a solid background in corporate finance, Ballanger’s adherence to the concept of “Hard Assets” allows him to focus the practice on selecting opportunities in the global resource sector with emphasis on the precious metals exploration and development sector. Ballanger takes great pleasure in visiting mineral properties around the globe in the never-ending hunt for early-stage opportunities.
Disclosure:
1) Michael J. Ballanger: I, or members of my immediate household or family, own shares of the following companies mentioned in this article: Stakeholder Gold Corporation. I personally am, or members of my immediate household or family are, paid by the following companies mentioned in this article: None. My company has a financial relationship with the following companies referred to in this article: Stakeholder Gold Corporation. I determined which companies would be included in this article based on my research and understanding of the sector. Additional disclosures are below.
2) The following companies mentioned in this article are billboard sponsors of Streetwise Reports: None. Streetwise Reports does not accept stock in exchange for its services. Click here for important disclosures about sponsor fees. The information provided above is for informational purposes only and is not a recommendation to buy or sell any security.
3) Statements and opinions expressed are the opinions of the author and not of Streetwise Reports or its officers. The author is wholly responsible for the validity of the statements. The author was not paid by Streetwise Reports for this article. Streetwise Reports was not paid by the author to publish or syndicate this article.
4) This article does not constitute investment advice. Each reader is encouraged to consult with his or her individual financial professional and any action a reader takes as a result of information presented here is his or her own responsibility. By opening this page, each reader accepts and agrees to Streetwise Reports’ terms of use and full legal disclaimer. This article is not a solicitation for investment. Streetwise Reports does not render general or specific investment advice and the information on Streetwise Reports should not be considered a recommendation to buy or sell any security. Streetwise Reports does not endorse or recommend the business, products, services or securities of any company mentioned on Streetwise Reports.
5) From time to time, Streetwise Reports LLC and its directors, officers, employees or members of their families, as well as persons interviewed for articles and interviews on the site, may have a long or short position in securities mentioned. Directors, officers, employees or members of their immediate families are prohibited from making purchases and/or sales of those securities in the open market or otherwise from the time of the interview or the decision to write an article, until one week after the publication of the interview or article. As of the date of this article, officers and/or employees of Streetwise Reports LLC (including members of their household) own securities of Stakeholder Gold, a company mentioned in this article.
All charts and images courtesy of Michael Ballanger.
Michael Ballanger Disclaimer:
This letter makes no guarantee or warranty on the accuracy or completeness of the data provided. Nothing contained herein is intended or shall be deemed to be investment advice, implied or otherwise. This letter represents my views and replicates trades that I am making but nothing more than that. Always consult your registered advisor to assist you with your investments. I accept no liability for any loss arising from the use of the data contained on this letter. Options and junior mining stocks contain a high level of risk that may result in the loss of part or all invested capital and therefore are suitable for experienced and professional investors and traders only. One should be familiar with the risks involved in junior mining and options trading and we recommend consulting a financial adviser if you feel you do not understand the risks involved.

-
I know Mike is a very solid investor and respect his opinions very much. So if he says pay attention to this or that - I will.
~ Dale G.
-
I've started managing my own investments so view Michael's site as a one-stop shop from which to get information and perspectives.
~ Dave E.
-
Michael offers easy reading, honest, common sense information that anyone can use in a practical manner.
~ der_al.
-
A sane voice in a scrambled investment world.
~ Ed R.
Inside Edge Pro Contributors

Greg Weldon

Josef Schachter

Tyler Bollhorn

Ryan Irvine

Paul Beattie

Martin Straith

Patrick Ceresna

Mark Leibovit

James Thorne

Victor Adair