
Currency


Bitcoin has been the headline item in recent weeks. Its pace has surpassed the gold and silver run of 1979-80 and the NASDAQ of 1999. But it is not unlike the real high-fliers of the Dotcom mania. A realistic comparison of Bitcoin is best done with Qualcomm of 1999.

The key lows in QCOM had been $2.36 in 1998 (42x move to $100), $0.92 in 1994 and $0.40 in 1992 (250x move to $100).
If the next consolidation in Bitcoin holds above $11,000 then we could be looking at a double from the corrective low.
The following charts display the dynamic action of investment vehicles in the sector during the last six months. Regardless of the extent of the upside moves, most have provided corrections back below their 20-day exponential moving averages, frequently testing the 50-day average.

Opinions in this report are solely those of the author. The information herein was obtained from various sources; however, we do not guarantee its accuracy or completeness. This research report is prepared for general circulation and is circulated for general information only. It does not have regard to the specific investment objectives, financial situation, and the needs regarding the appropriateness of investing in any securities or investment strategies discussed or recommended in this report and should understand that statements regarding future prospects may not be realized.
Investors should note that income from such securities, if any, may fluctuate and that each security’s price or value may rise or fall. Accordingly, investors may receive back less than originally invested. Past performance is not necessarily a guide to future performance. Neither the information nor any opinion expressed constitutes an offer to buy or sell any securities or options or futures contracts. Foreign currency rates of exchange may adversely affect the value, price or income of any security or related investment mentioned in this report. In addition, investors in securities such as ADRs, whose values are influenced by the currency of the underlying security, effectively assume currency risk. Moreover, from time to time, members of the Institutional Advisors team may be long or short positions discussed in our publications.
BOB HOYE, INSTITUTIONAL ADVISORS

After holding onto huge, unprofitable long positions for months, gold and silver futures speculators are finally giving up and bailing out, while commercial traders (who take the opposite side of these trades, since every long requires an offsetting short) are closing out their shorts at a near-record pace.
Here’s the gold data for last week, courtesy ofGoldSeek. Note the massive shift by speculators from long to short. They’re not in balance yet (where longs and shorts are equal) but they’re heading that way fast.

In silver, they’re just about in balance, which is historically about as far they usually go:

Here’s the same data for gold in graphical form with the silver bars representing speculator longs and the red showing commercial shorts. Note the long plateau followed by a rush to the middle, which is where rallies tend to begin.

One more week like the last two would put this indicator in screaming buy territory, but even if this is as far as it goes it’s still positive for January – which is a seasonally strong time for precious metals in any event.
For individual speculators, that means the junior miners are – again based on this one indicator – pretty good trades for the next few months.

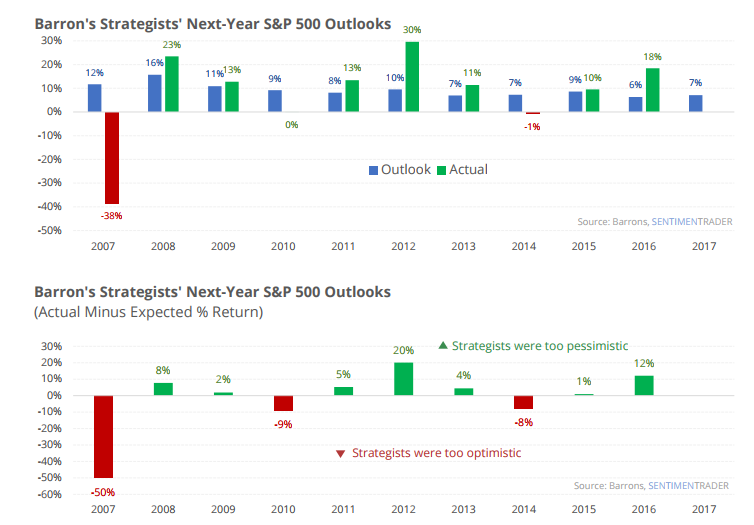
 Near the end of each year, Barron’s magazine highlights the outlooks for the next year from 10, or so, Wall Street strategists. As noted recently by Sentiment Trader:
“Strategists are a little more optimistic than the Big Money was, forecasting a gain of around 7% for the S&P 500 in 2018. That’s about how much they thought the S&P would rally in 2017. And 2016. And pretty much every other year. When forecasting, it’s often a good bet just to go with the base rate – the average probability of being positive, or average gain in a random year. For stocks, that’s about a 7% nominal return, with about a 65% probability of showing a gain. Just stick with those, and you’ll have a better record than most. In aggregate, that’s what Wall Street does.”
Of course, 2017, has been a much better than the forecasted year as one of the great triumphs of the Fed’s liquidity-driven policy is that investor’s “animal spirits” finally returned to the investment markets. However, actual results, as Sentiment Trader showed, can vary.
” They overestimated the market’s 2008 return by 50% (!) and underestimated the 2012 return by 20%. Like most outlooks, forecasts, and research pieces, the biggest value isn’t necessarily in the bottom line, but in the thought processes and data used to get there. In those senses, reading through the outlooks can be a great exercise. Using them just for the bottom-line guess at next year’s S&P level is next to worthless as an indicator.”
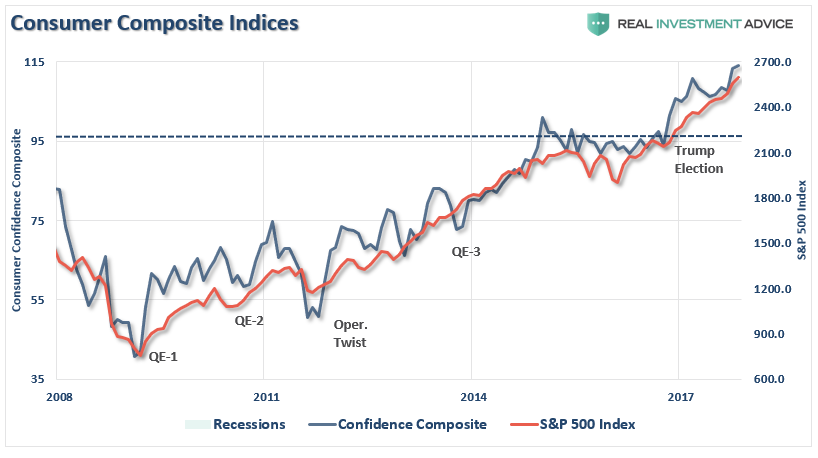
But, with the ongoing massive global Central Bank interventions, as Michael Lebowitz discussed yesterday, it should not be surprising that as markets continue their seemingly unstoppable advance. That advance has ultimately triggered the “greed factor” as shown by surging investor confidence and expectations which have surged to historically high levels. (The chart below is a composite index of both the University of Michigan and Conference Board surveys.)
Even the level of individuals believing the financial markets will be higher over the next 12-months has spiked sharply higher in recent months.
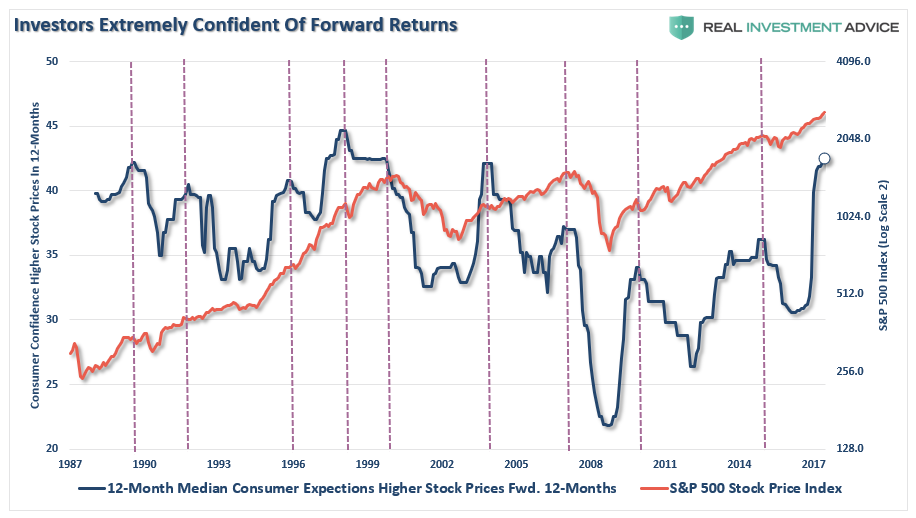
However, while Wall Street expects the markets to increase by 7% next year, the long-term historical average, the charts above suggest individuals have bigger aspirations.
How much bigger? A lot!
Schroders Global Investors Study recently surveyed over twenty thousand investors from around the globe to get their expected portfolio returns over the coming 5 years. To wit:
- Investors expect an annual return of 10.2% on their investments over the next five years
- The 2017 survey, which surveyed 22,100 globally who invest, found millennials even more optimistic. Those born between 1982 and 1999 expected their money to make average returns of 11.7% a year between now and 2022.
- Even the Baby Boomer generation is anticipating an above average return of 8.6% a year.
- Breaking it down by generation:
- Millennials (born 1982-1999, aged 18-35): 11.7%
- Generation X (born 1965-1981, aged 36-52): 9.8%
- Baby Boomers (born 1945-1964, aged 53-72): 8.6%
- Silent Generation (born 1923-1944, aged 73+): 8.1%”
Such levels of optimism may be a bit egregious given the overly optimistic positioning by investors in the market currently as shown.
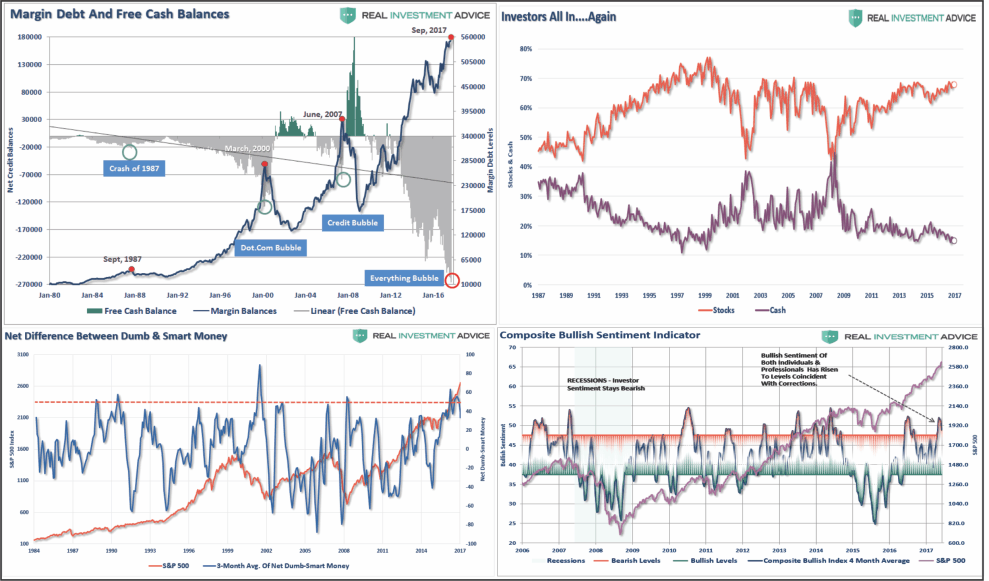
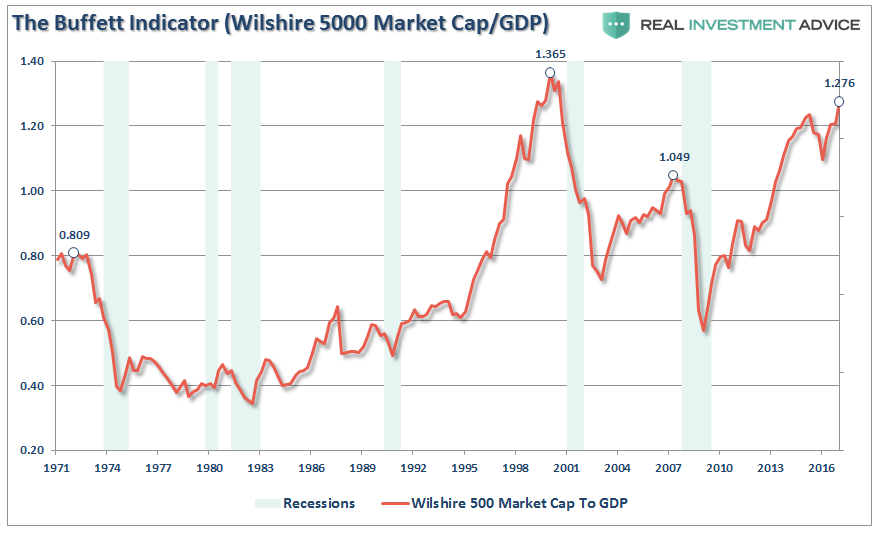
Add the overly optimistic outlook and positioning to a market that is the most overvalued, overbought, and extended, in the last 20-years and the risk to future returns becomes much more evident.
The reality, of course, is once again investors are setting themselves up for disappointment. The expectations of “compounding returns” of 6, 8 or 10% is a myth that needs to go away. As Richard Rosso wrote recently:
“When it comes to compounding, investors should never suffer torturous time to breakeven. Compound interest works if the rate of interest is consistent, not variable. You wouldn’t know it from stocks, especially this year, but from what I know, stocks are indeed a variable, and occasionally, volatile asset class.
So sorry, Suze. This bit of knowledge? Strike out. Not everything compounds.
‘Orman explained that if a 25-year-old puts $100 into a Roth IRA each month, they could have $1 million by retirement.’“

“As outlined in the chart above, on an inflation-adjusted basis, achieving a million-buck balance in 40 years by dollar-cost averaging $100 a month, requires a surreal 11.25% annual return. In the real world (not the superstar pundit realm), a blind follower of Suze’s advice would experience a whopping retirement funding gap of $695,254.68.
I don’t know about you, to me, this is a Grand Canyon expectation vs. reality-sized unwelcomed surprise.”
But yet, Millennials are currently hoping for “Orman” type returns.
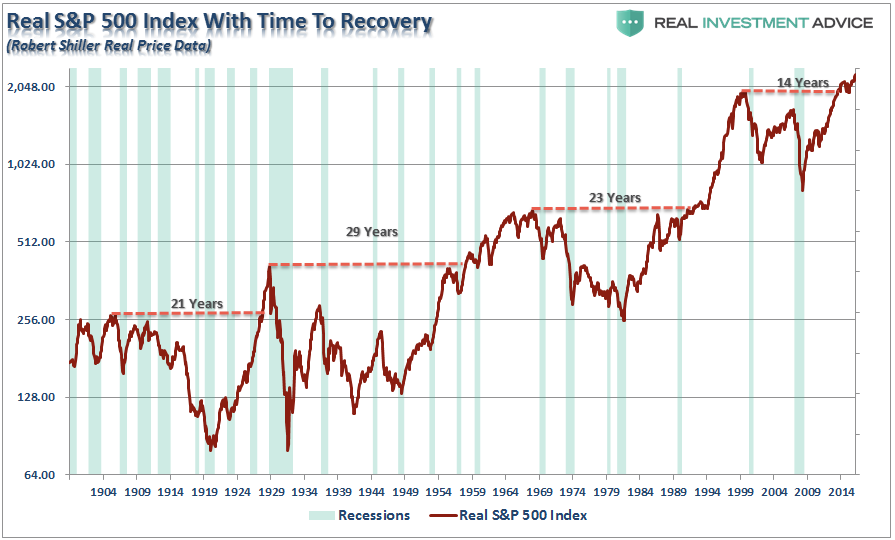
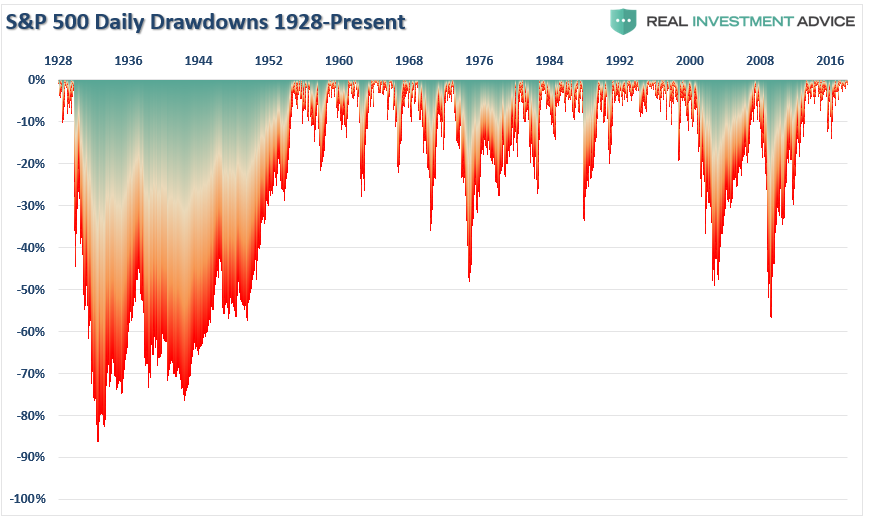
Reality is likely to be extremely disappointing as drawdowns of 10% or more have occurred throughout history with regularity.
Irrational Exuberance
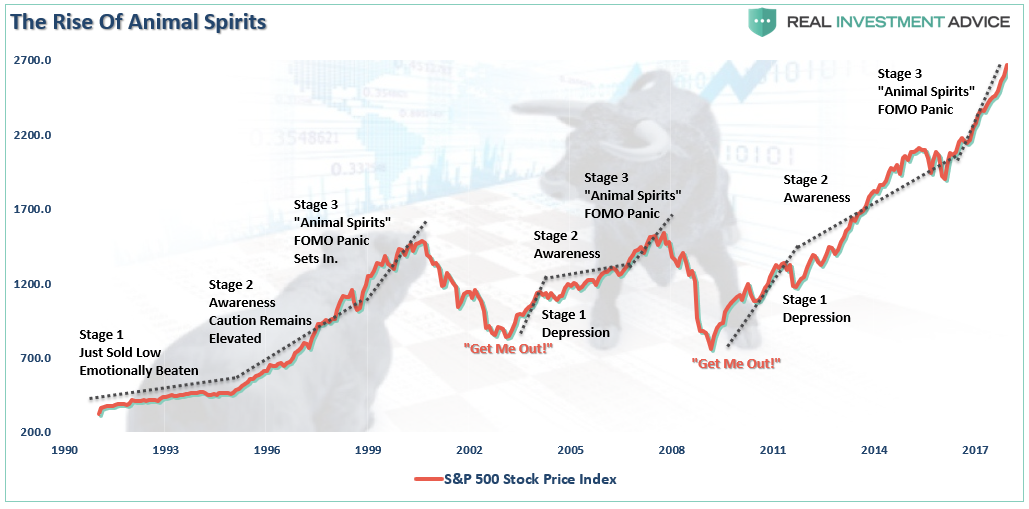
Here’s a little secret, “Animal Spirits” is simply another name for “Irrational Exuberance,” as it is the manifestation of the capitulation of individuals who are suffering from an extreme case of the “FOMO’s” (Fear Of Missing Out). The chart below shows the stages of the previous bull markets and the inflection points of the appearance of “Animal Spirits.”
At the peak of previous bull market advances, the markets have entered into an accelerated phase of price advances.
Since “the price you pay day is the value you receive tomorrow,” as famously noted by Warren Buffet, it should not come as a surprise that “value investing” is lagging the “momentum chase” in the market currently. But again, this is something that has historically, and repeatedly occurred, during very late stage bull market advances as the “rationalization” for a “never-ending bull market” is promulgated.
Given the length of the economic expansion, the risk to the “bull market” thesis is an economic slowdown, or contraction, that derails the lofty expectations of continued earnings growth.
While tax reform legislation may provide a bump to earnings growth in the near-term, it is the longer-term growth rates of the economy that matters. Furthermore, while providing a tax cut to corporations will certainly boost their bottom line, there is little evidence, historically speaking, “trickle-down economics” actually occurs. If it did, wages as a share of corporate profits wouldn’t look like this.

With an economy that is 70% driven by the 90% of the population who don’t benefit from corporate tax cuts, the long-term effects of a deficit and debt busting tax bill should be worrying investors.
But, for now, that is not the case as the rise in “animal spirits” is simply the reflection of the rising delusion of investors who frantically cling to data points which somehow support the notion “this time is different,” a point recently made by Sentiment Trader:
“We’ve discussed a multitude of momentum studies in the past month or two, with an almost universal suggestion that the types of readings we’ve seen this year are rare and hard to bust. This unrelenting bid has been one of, if not THE, most compelling bullish argument, and it shows little sign of stopping.”
But importantly, they always do.
We have seen this before.
There was no catalyst that we know of that burst the dot-com bubble in 2000. There was no catalyst that started the slide in the markets in 2008 until it triggered the Lehman bankruptcy and “all hell broke loose.”
Today, we once again have exuberance present and there is a widespread belief that nothing will stop this runaway train.
But eventually, for whatever reason, the market will top. It is impossible to predict when, or how it will happen. It just most assuredly will, and will do so just as everything seems to be its brightest.
It will be the rudest of awakenings for the slumbering bulls.
Lance Roberts

Lance Roberts is a Chief Portfolio Strategist/Economist for Clarity Financial. He is also the host of “The Lance Roberts Show” and Chief Editor of the “Real Investment Advice” website and author of “Real Investment Daily” blog and “Real Investment Report“. Follow Lance on Facebook, Twitter and Linked-In

 A Monthly Outlook on the Global Financial Markets
1. Prior market tops (1987, 2000, 2007, etc.) allowed asset managers to partially “insure” their risk assets by purchasing Treasuries that could appreciate in price as the Fed lowered policy rates. Today, that “insurance” is limited with interest rates so low. Risk assets, therefore, have a less “insurable” left tail that should be priced into higher risk premiums. Should a crisis arise because of policy mistakes, geopolitical crises, or other currently unforeseen risks, the ability to protect principal will be impaired relative to history. That in turn argues for a more cautious and easier Fed than otherwise assumed.
Economists prior to Keynes viewed “modeled” as well as “real time” economies as self-balancing, but subject to imbalances from external shocks like oil prices. Rarely did theory incorporate finance and credit as one of those potential earthquakes. It took Hyman Minsky to change how economists view the world by introducing the concept of financial stability that leads to leverage and ultimate instability. He alerted economists to the fact that an economy is a delicate balance between production and finance. Both must be balanced internally and then the interplay between them balanced as well.
One of the traditional push backs against attempts to predict “black swan” events is that they are by default unpredictable, rendering the entire exercise moot. However, for the second year in a row, Nomura’s Bilal Hafeez has found a loophole, or rather loop-animal: the grey swan.
As Hafeez writes, while he would like to be able to predict black swans, by definition that is impossible. “However, its close cousin the grey swan can be foreseen. These are the unlikely but impactful events that, in our opinion, lie outside the usual base case and risk scenarios of the analyst community. So as we did last year we have put on our creative hats and have come up with 10 potential grey swan events for 2018.“
For the purpose of this exercise, Nomura avoided the more widely discussed – and more probable scenarios such as the Italian elections, US Impeachment risk, North Korea conflict, which it covered in its event risk radar series, and has instead selected topics that have not been as widely discussed.
“Needless to say, none of them are our base case, but we think it is better to be prepared than not.”
So without further adoNomura’s potential grey swan events for 2018 include:
…also from Zerohedge:
“They Are Sleepwalking Into A Major Correction”: One Trader Expects A Violent Move In Bunds

-
I know Mike is a very solid investor and respect his opinions very much. So if he says pay attention to this or that - I will.
~ Dale G.
-
I've started managing my own investments so view Michael's site as a one-stop shop from which to get information and perspectives.
~ Dave E.
-
Michael offers easy reading, honest, common sense information that anyone can use in a practical manner.
~ der_al.
-
A sane voice in a scrambled investment world.
~ Ed R.
Inside Edge Pro Contributors

Greg Weldon

Josef Schachter

Tyler Bollhorn

Ryan Irvine

Paul Beattie

Martin Straith

Patrick Ceresna

Mark Leibovit

James Thorne

Victor Adair