
Gold & Precious Metals
This next set of ratio charts I consider to be the most important ratio charts if you are deciding whether to be an investor in the INDU or in Gold.
When the price is rising The INDU ( Dow Jones Industrial Average ) (a proxy for General Stock Markets) is rising against Gold , and when it is falling Gold is rising against the Dow.
This first ratio chart for the INDU:Gold is a daily look which shows the ratio breaking out above the top rail of a bullish rising flag with a completed backtest. It doesn’t look that impressive on a daily chart, but when we look at the longer term ratio chart it becomes very important.
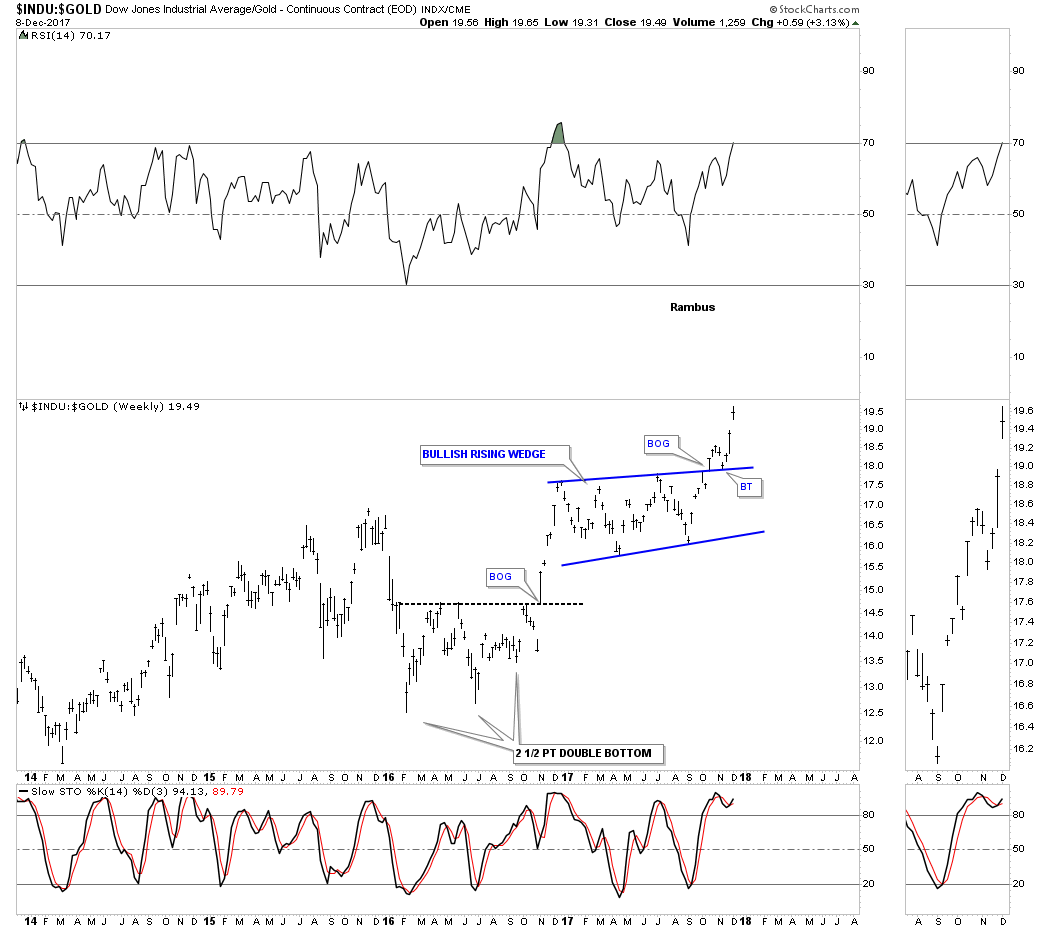
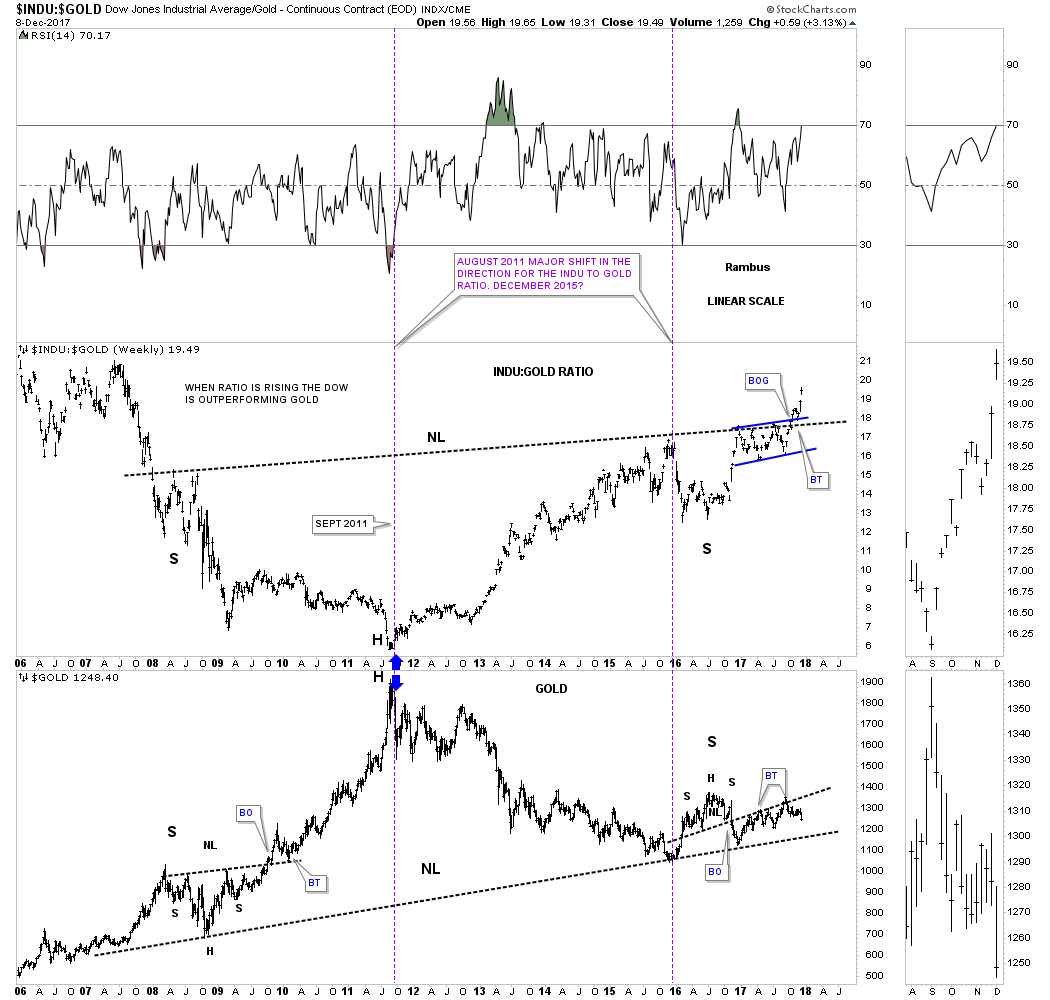
Below is a long term 10 year weekly chart which shows a massive H&S bottom on the ratio chart on top and a possible massive H&S top on gold on the bottom chart. Note how the blue bullish rising flag formed just below the neckline on the ratio chart which has given the ratio chart the energy it needed to finally breakout. I’ve been showing this ratio combo chart for a long time now so the breakout above the neckline is falling into place.
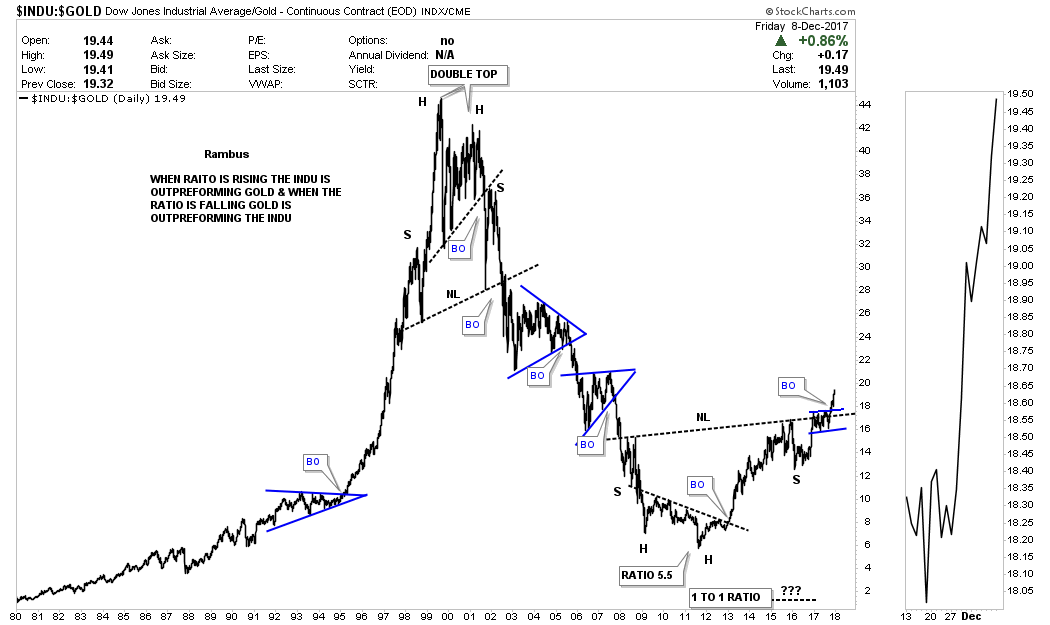
Below is a 38 year daily line chart for the INDU:gold ratio chart which puts the very big picture in perspective. This ratio chart tells you when you need to be trading in the INDU and out of Gold and visa versa. As you can see you wanted to be trading in the INDU going into the 2000 bubble top and out of gold. In 2000 that all changed. From that point forward you wanted to be trading in the PM sector staying away from the INDU.
There are many gold investors that swear that the ratio has to go as low a 1 to 1 before the gold bull market is over. As you can see the ratio got as low as 5.5 in 2011 which is close enough IMHO especially since the price action that followed that double bottom low. There is a massive H&S bottom with the breakout underway. We have a very clear line in the sand for the staunch gold bulls which is the neckline. As long as the price action trades above that neckline the INDU is going to outperform gold.
As the breakout is just now taking place this ratio could rise for many years to come regardless of all the reasons it can’t. I will have no problem reversing my stance if I see the neckline is broken to the downside, but until it is I have to give the ratio chart the benefit of a doubt. All the best…Rambus

 1. Jack Crooks: Gold quiet period about to end?
“Major U.S. stock indexes have been historically quiet this year. Now, that inactivity has spreadto the precious metals market. Gold stayed in a $34.50 trading range in November, the lowest gap between its high and low in any month since October 2005, according to the Journal’s Market Data Group.”
We believe this low volatility period is about to change for the shiny metal.
2. Technically Speaking: This Is Nuts
Since the election, markets have accelerated the pace of the advance. The advance has had two main story lines to support the bullish narrative.
3. The Unprecedented Moneymaking Potential of This New Technical Pattern
While everyone’s been talking about the Dow’s third major milestone this year – breaking the 24,000 mark – I’m focusing on something else…
You see, there’s a new technical pattern forming in a couple of department store stocks. If it’s true and you catch it at the right time, you can make a lot of money.
Todd Market Forecast for Friday December 8, 2017
Available Mon- Friday after 3:00 Pacific.
DOW + 118 on 499 net advances
NASDAQ COMP + 27 on 330 net advances
SHORT TERM TREND Bullish
INTERMEDIATE TERM Bullish
STOCKS : The market was greeted with a better than expected non farm payroll number and the result was a rally. In the old days, you might have seen a drop on a good report because it was feared that the Fed might be more tempted to raise rates
But, this Fed is fairly dovish and doesn’t like to surprise the financial markets. Right now a quarter point increase is anticipated at the FOMC meeting next Wednesday and this is pretty much baked into the cake.
Traders are back on board after getting sucker punched by ABC’s Brian Ross who was suspended for bad reporting. You may recall it was his false story that caused a 350 point decline and stopped us out of a good position. I hope some of you will send him a letter. I know I am.
GOLD: Gold was down another $3. Yesterday I semi joked that the bitcoin rage had robbed it of its speculators, but today several people were echoing that theme. Are they reading my letter without paying for it?
CHART: The S&P 500 made another all time closing high on Friday and there is nothing more bullish than an uptrending market. We also like the fact that the advance decline line confirmed the action by also making an all time high. Breadth normally deteriorates before a top of any significance.

BOTTOM LINE: (Trading)
Our intermediate term system is on a buy.
System 7 We are in cash. We bought the SSO at 107.07. Stay with it on Monday.
System 8 We are in cash. Stay there for now.
System 9 We are in cash.
NEWS AND FUNDAMENTALS: The non farm payrolls added 228,000 jobs. The expectation was for 190,000. Consumer sentiment came in at 96.8, lower than last month’s 98.5. On Monday we get job openings (JOLTS).
INTERESTING STUFF: Any man can make mistakes, but only an idiot persists in his error.—- Marcus Tullius Cicero— 106 BC to 46 BC.
TORONTO EXCHANGE: Toronto jumped another 80.
BONDS: Bonds had a minor bounce.
THE REST: The dollar is surging. Crude oil moved higher.
Bonds –Bearish as of Dec, 7.
U.S. dollar – Bullish as of Nov. 28
Euro — Bullish as of October 10.
Gold —-Bearish as of November 29.
Silver—- Bearish as of November 29.
Crude oil —-Bearish as of Nov. 27.
Toronto Stock Exchange—- Bullish as of September 20, 2017.
We are on a long term buy signal for the markets of the U.S., Canada, Britain, Germany and France.

Monetary conditions (+2 means the Fed is actively dropping rates; +1 means a bias toward easing. 0 means neutral, -1 means a bias toward tightening, -2 means actively raising rates). RSI (30 or below is oversold, 80 or above is overbought). McClellan Oscillator ( minus 100 is oversold. Plus 100 is overbought). Composite Gauge (5 or below is negative, 13 or above is positive). Composite Gauge five day m.a. (8.0 or below is overbought. 13.0 or above is oversold). CBOE Put Call Ratio ( .80 or below is a negative. 1.00 or above is a positive). Volatility Index, VIX (low teens bearish, high twenties bullish), VIX % single day change. + 5 or greater bullish. -5 or less, bearish. VIX % change 5 day m.a. +3.0 or above bullish, -3.0 or below, bearish. Advances minus declines three day m.a.( +500 is bearish. – 500 is bullish). Supply Demand 5 day m.a. (.45 or below is a positive. .80 or above is a negative). Trading Index (TRIN) 1.40 or above bullish. No level for bearish.
No guarantees are made. Traders can and do lose money. The publisher may take positions in recommended securities.
No, Make That Something “Historical” Is Happening
Last year we told you the 5000 year bottom in interest rates was in.
And that meant the 35 year bull market in bonds was over.
Bitcoin Trust was a top recommendation at last year’s World Outlook Financial Conference. Why? Because confidence in government and paper currencies is falling
Since March, 2009 we’ve predicted massive new highs in the Dow Jones. Guess what? It’s not over. Most don’t know why.
The pension crisis has just started and will become obvious in 2018
I’m sure you’re busy. I certainly am given all that’s happening in the economy and markets but what’s going on is so incredible that it merits my time in bringing it to your attention. From Volvo’s contract to deliver 24,000 self driving cars to Uber in 12 months – to the mindblowing rise in Bitcoin. And then there’s the 50 year low in US oil imports while production hits record highs. (Message to the Middle East – the US doesn’t need you anymore.)
Last year Donald Trump’s victory was just one more sign of the kind of historical changes we’ve predicted at the World Outlook Financial Conference and on Moneytalks since 2009. Everything’s on schedule – lots of money is to be made and lost.
What’s Coming
My bet is that we are on the cusp of the next stage of the world’s monetary crisis – and we all better be ready. This is not for the faint of heart. What’s about to happen is going to make the last five years seem tame. (Let that sink in for a moment.)
My goal is to make sure you’re protected and profit financially. Unfortunately the vast majority of people won’t be. In 2018, the pension problems at the city and state level are going to be more obvious. Consider that Illinois’ pension liability is now 280% of its entire annual tax revenues. Teachers in Kentucky are demanding each Kentucky household pay $3,200 for each of the next two years in order to top up their pension plan. (Good luck with that). This is not going to end well.
Neither are the banking problems in European and they, in turn, will exacerbate the strains on the European Union. Catalonia’s independence movement, the election last Sunday in Corsica of anti-EU advocate, Gilles Simeoni, the election in the Czech Republic of Eurosceptic Andrej Babis, and the vote in late October of two of Italy’s wealthiest regions, Lombardy and Veneto, to separate illustrate the problem.
As we’ve been predicting on Moneytalks since 2010, the European Union will come apart and the financial repercussions are huge – including a major boost to the US stock market. We’ve been saying that playing the euro to go down (first recommended at 1.54 to the dollar, now 1.17) was a fundamental long term position – hence it was to be sold on any rally.
The euro recommendation illustrates the approach we take at the World Outlook Financial Conference and on Moneytalks. You start by getting the big picture right and then devise strategies to take advantage of it.
And our record at the World Outlook speaks for itself.
Our #1 recommendation since October, 2012 has been to put between 30% and 50% of your money into the US dollar. At the same time we recommended quality dividend paying US stocks, real estate in the Phoenix area and Vancouver.
We warned of the drop in commodities including gold when it was still $1800.
At the Conference in early 2014 our energy analyst, Josef Schachter warned when oil was well over $100 that it was about to decline to the $32-$34 level. In what was a first anywhere, Mark Liebovit recommended the marijuana industry.
While that was a great call, Mark surpasses that last year with one of his top recommendations, Bitcoin Trust – now up 1500% – (obviously that doesn’t happen very often.)
My Point
Maybe we’ve been lucky that every year our specific recommendations have paid for the price of a ticket several times over. To that end, Keystone’s Ryan Irvine will be back to present his 2018 World Outlook Small Cap Portfolio. While past performance is not a guarantee of future results, it is impressive that the Outlook Small Cap portfolio has achieved double digit returns every single year. We’ll talk the loonie, gold and the markets with Martin Armstrong and James Thorne, real estate opportunities with Vision Capital’s Jeff Olin, and the marijuana industry with Mark Leibovit.
And after years of trying, I’m really excited to say that I finally got BT Global’s terrific stock picker, Paul Beattie to agree to speak.
No Surprise
As you probably guessed, I want you to come to the 2018 World Outlook Financial Conference. Why? Because we’re living in a time of historical change and people who don’t understand what’s going on are going to get killed financially. Of course a lot of people already are but conference attendees who followed our recommendations into the US dollar, US stocks, real estate in Vancouver, Phoenix and Victoria, and have bought the World Outlook Small Cap Portfolio have done well.
I understand that not everyone is interested in their personal finances – and I respect that. (Heck, I’ve got friends who I have to force to come because it conflicts with something on tv.) Maybe you’re already are on top of things. May you have other things on the go.
All I’m saying is that periods of historic change provide incredible opportunities and incredible danger. Simply put, at the World Outlook Conference our goal is to help you avoid the danger part and take advantage of the opportunities.
I hope to see you there.
Sincerely
Mike
PS – The 2018 World Outlook Financial Conference is Friday night Feb 2nd and Saturday, Feb 3rd at the Westin Bayshore. For tickets and other details go to www.moneytalks.net and click on the EVENTS button.
PPS As you probably know I’m big on educating our younger generation – goodness knows I go on about it enough. To that end we have a special offer – if you buy a ticket – you can bring a student or some other young person in your life, absolutely free. The only thing is that we ask you to let us know that you want a student ticket when you purchase your ticket. We have a limited number set aside and we want to be able to accommodate you.
![]()
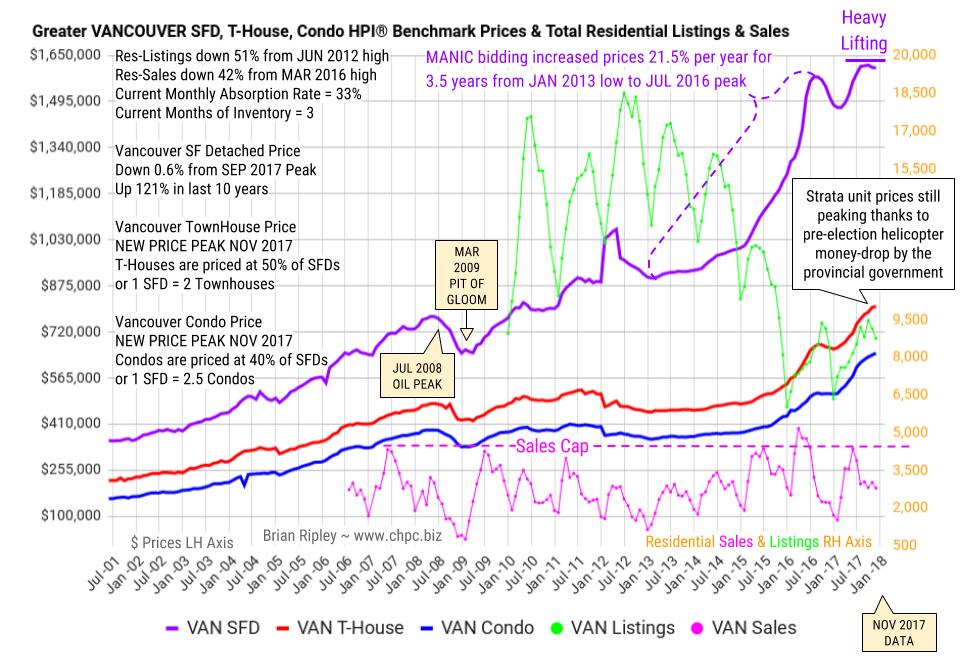
In November 2017, Vancouver detached house HPI prices remained at resistance but strata prices continued ticking up through the July 2016 peak. The manic buying spree moved detached prices up 21.5% per year since the JAN 2013 low and are now up 121% in the last ten years.
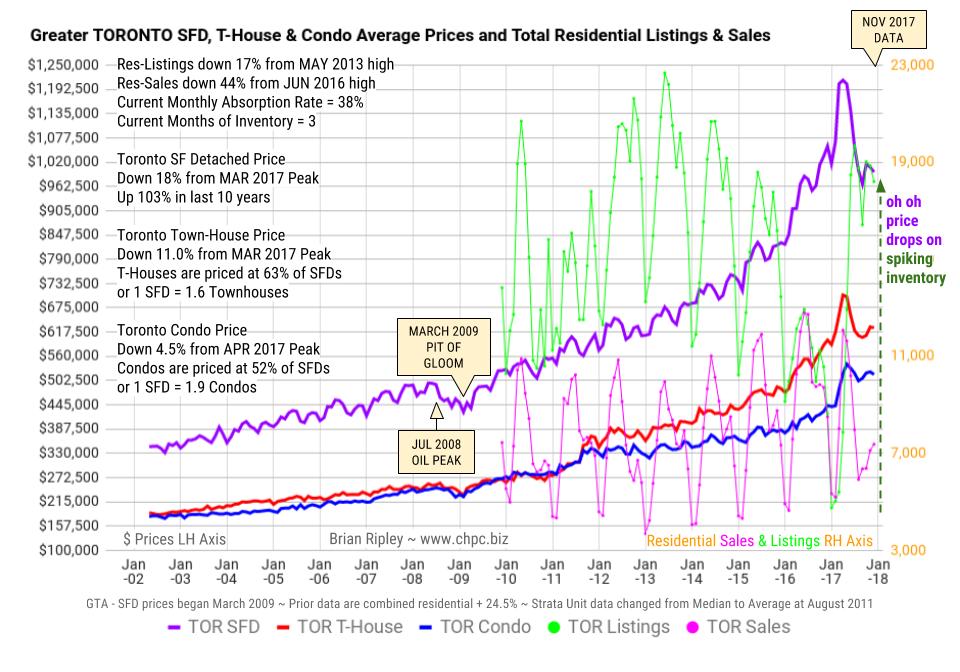
In November 2017 the Toronto housing sector prices remained depressed below their near term showoff spike highs as listing levels spike on seasonally slow sales; that and the winter tendency to hibernate is producing the right side of the “Eiffel Tower” price series.


-
I know Mike is a very solid investor and respect his opinions very much. So if he says pay attention to this or that - I will.
~ Dale G.
-
I've started managing my own investments so view Michael's site as a one-stop shop from which to get information and perspectives.
~ Dave E.
-
Michael offers easy reading, honest, common sense information that anyone can use in a practical manner.
~ der_al.
-
A sane voice in a scrambled investment world.
~ Ed R.
Inside Edge Pro Contributors

Greg Weldon

Josef Schachter

Tyler Bollhorn

Ryan Irvine

Paul Beattie

Martin Straith

Patrick Ceresna

Mark Leibovit

James Thorne

Victor Adair