
Wealth Building Strategies
The money to be made is in non-U.S. markets, according to Jeffrey Gundlach. For long-term investors, he recommends a specific ETF.
That ETF is INDA, the iShares fund that tracks the Indian equity market. He singled out India because of the growth of its workforce and its tradition of education and technology.
“It could go up 1,000% in the next 20 years,” Gundlach said, “just like China did.” INDA is up 32% year-to-date and carries an expense ratio of 0.71%.

Gundlach is the founder and chief investment officer of Los Angeles-based DoubleLine Capital. He spoke at the Schwab IMPACT conference on November 16. His talk was titled, “2017: At the Home Stretch.”
I’ll go over what he said about the global economy and why he believes emerging markets are a compelling opportunity, along with some “insane” developments in various asset classes.
The global landscape
This has been a very easy year for investors, he said, with no volatility in bonds, although short rates have gone up. The S&P is up 17%, but he said investors would actually have been unlucky to have over-allocated to it, since some of the emerging markets have performed better.
…also:

In a recent post, I came to the following conclusion:
“the notion that simply ‘following the trend’ in Gold will lead to vast riches is a false one.”
I made this statement after analyzing a simple trend following system (going back to 1975), using the 200-day moving average as a signal of when to get in (closes above it) and when to get out (closes below it).
The most common response to the post:
“You’re using the wrong moving average. You need to use the x-day moving average for Gold. That is the one that works.”
Translation: I should have used the Holy Grail. The only problem: it doesn’t exist.
In testing other popular moving averages such as the 100-day, 50-day, and 20-day, we find that they actually fared worse than the 200-day.

These shorter-term moving averages also traded in higher frequency, meaning the net returns after commissions/slippage would be even lower.

That’s not to say there isn’t some variation that would have worked better than the 200-day moving average in the past. Given the nearly infinite number of permutations, I’m quite sure that there is. Whether it’s a change in time period, indicator, or some combination thereof – if you look long and hard enough you’ll find something that works better.
But that’s not the question. The question is whether there’s enough evidence to show that trend following in Gold has been superior strategy to buy-and-hold.
There doesn’t seem to be, and mining the data to prove otherwise would serve no purpose other than confirming some bias. What would be the point of optimizing for the perfect past return unless there was some fundamental reason why a certain time period/indicator should continue its outperformance in the future?
Lacking such a reason, you are merely chasing optimization, trying to find the combination that would have given you the best past result.
Much more important than your choice of indicator or time frame is 1) whether there’s a fundamental/behavioral reason for a strategy to outperform, and 2) whether you’re willing to stick with it through the inevitable tough times. When your strategy is out of favor, will you avoid the temptation to constantly re-optimize to what’s currently “working”?
Most can’t/won’t which is yet another reason why most active managers, even when they have an exploitable edge, fail to outperform. You have to be willing to take the bad with the good because a) the very best performing strategies all have many periods of bad and b) you cannot predict when the good/bad periods are going to occur.
Do yourself a favor and stop searching for the Holy Grail. I realize that isn’t easy; it goes against human nature which is always searching for something better, striving for perfection. But perfection doesn’t exist in markets and that’s probably good thing. For if it did there would be no risk and therefore no reward.
***
Related Posts:

With the stock market and Bitcoin reaching all-time highs, what can possible go wrong? In offering my thoughts on 2018, I see my role in reminding investors to stress test their portfolios. Is your portfolio built of straw, sticks or brick?

First, let me allege many investors have portfolios built of straw and sticks rather than brick. How do I know this? Here’s a brief check:
- If a robust portfolio is a diversified one (the only free lunch on Wall Street), then please check whether you have rebalanced your portfolio of late. If not, odds are equities have taken on an oversized portion in your portfolio, thus making it more vulnerable than you might have intended in a downturn.
- Equities are part of the so-called risk assets in a portfolio. But what about the rest of the portfolio? Have you been chasing yield by extending duration of your fixed income portfolio? Have you accepted less creditworthy issuers? Have you been lured by the promise of higher yields by financing something in a private placement? I have news for you: without judging the merits of those investments, odds are high that the value of these investments are more correlated with risk assets than you might be aware. Read: just because the label says fixed income doesn’t mean you are diversified.
Without a doubt, equities have had an extra-ordinary run. There is the view that, without a recession, you cannot have a bear market. In our analysis, that’s true for the most part – but is “for the most part” good enough? The notable exception is the Crash of 1987 where a bear market was not accompanied by a recession. In today’s context, the buy-the-dip crowd will remind you that the ’87 crash was, well, a buying opportunity. As such, if you are an asset manager interested in keeping your job, you buy. It reminds of the 1980s where buying IBM office equipment was the sure way to keep your job, as no one would question your choice. Here’s a chart that shows the S&P 500 with the percent drawdown from any peak, with recessions shaded:
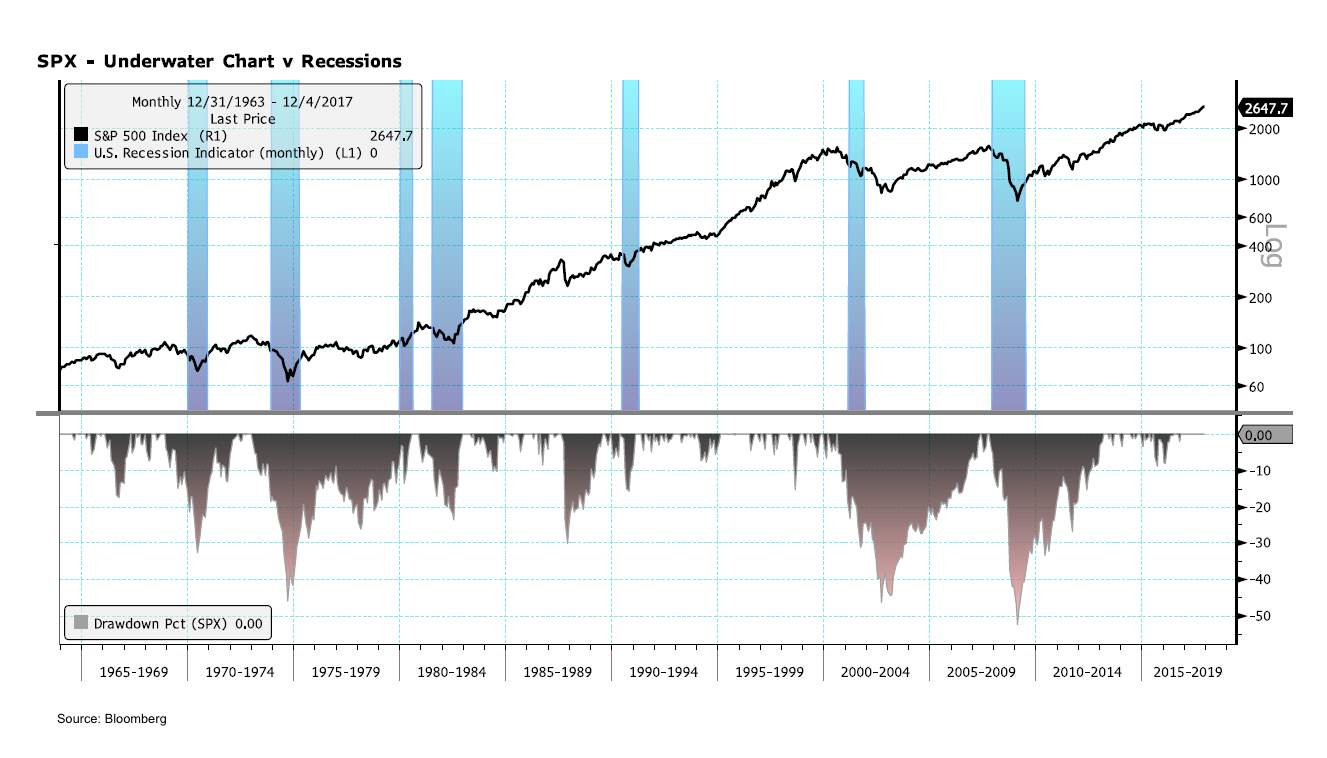
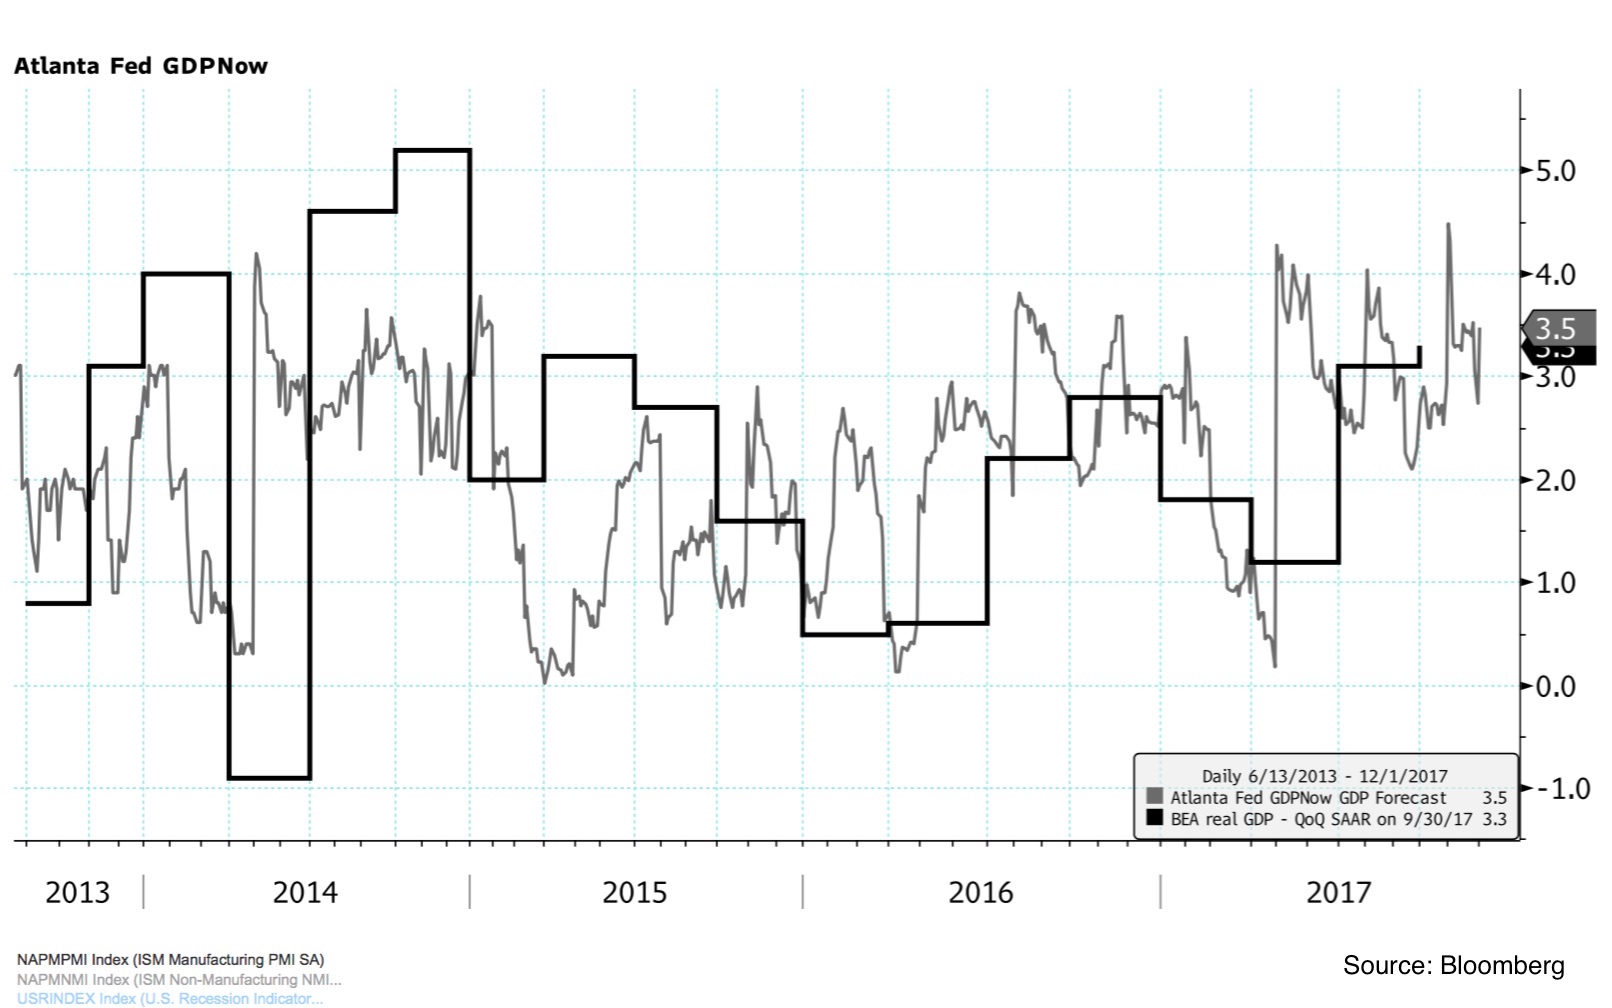
Keep in mind that we may not know about whether we are in a recession until we are well into it; also note the above chart is based on monthly data, thus not showing the maximum drawdown intra-month. That said, few economic forecasters are predicting a recession in the near future. Below is the quarter over quarter, seasonally adjusted GDP in black, then in grey the so-called Atlanta Fed GDPNow indicator, an indicator trying to predict the current quarter’s GDP reading:
So why be concerned? In a recent discussion with market veteran David Kotok (Chairman & CIO of Cumberland Advisors) regarding the views of an analyst who is optimistic about the outlook, he paraphrased Ronald Reagan’s debate with Walter Mondale: “I am not going to exploit his youth and inexperience…”, adding, “we will see if he knows how to swim.”
What are the optimists missing? First, let me make clear that you do not have to be a pessimist to be concerned. Risk assets are called risk assets for a reason: if you aren’t concerned, that should be the very first sign why you should be concerned. The prudent investor manages risk. However, risk management has become more complex in an era where central banks have helped propel asset prices to new highs; in an era where very low, if any returns can be had in so called risk-free assets. For European investors, returns are negative for many investment grade fixed-income investments, not just government securities. Monetary policy is indeed designed to encourage more risk taking. All the more so, when “risk is off”, i.e. when risk assets re-price lower, investors may be losing more money than they signed up for. If history is any guide, this could amplify any downturn as investors re-calibrate their portfolios to match their risk tolerance in an era when risk levels may be elevated once again.
Below, I’m highlighting a few factors that investors may want to pay particular attention to; this is not intended as a crystal ball, but food for thought.
First, the most obvious: a glass that’s considered half full can also be considered half empty. Facts don’t have to change for an assessment of those facts to change. What was a brilliant project may suddenly be considered a bottomless pit. Some say the recent under-performance of tech stocks is due to the fact that these firms already pay relatively low taxes and, thus, benefit less from lower corporate taxes than others. Have a look at this chart of some of Wall Street’s darlings. Is it yet another buying opportunity or have we seen the top in the markets?
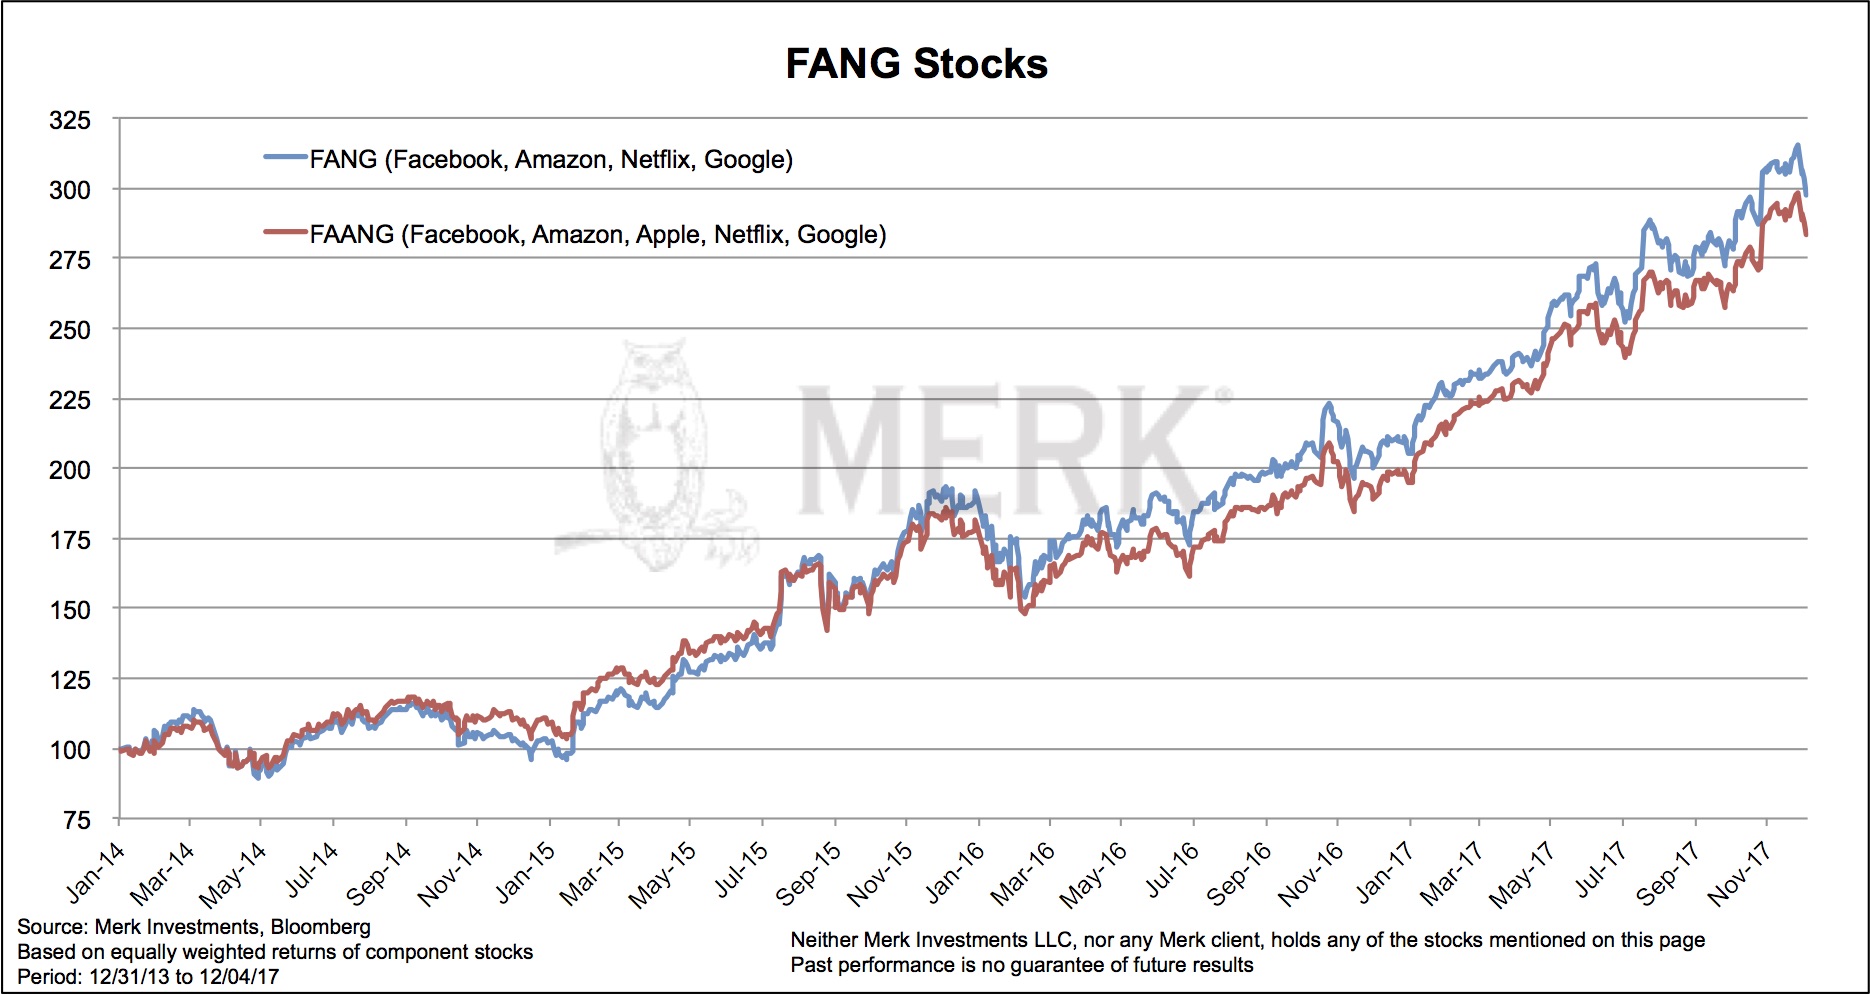
Broader market indices reached new highs as those former market leaders have turned. That said, other market breadth indicators we monitor appear to show little concern.
Let’s switch to something that may very well be changing: the tax system. I’ll leave it up to tax pros to dissect the details, but would like to focus your attention on what I believe is an under-reported theme: there are incentives in the proposed tax legislation to limit the deductibility of interest expense. The potential new limits on deducting mortgage interest, but more relevant for the markets may be limits on deductibility of interest expense for corporations. While there are exceptions, it appears there will be caps on how much in interest expense is deductible for corporations (section 3301 of the GOP House bill). This will make it less attractive to do debt financing, more attractive to pursue equity financing. Less debt may be good news for financial stability, but it means the supply of equity may go up, thus causing potential downward pressure on prices.
Year-end tax optimization may also take on a new dimension this year, as large college endowments might race to reset the cost basis of their investments, assuming their gains will be subject to taxation going forward. In this context, it is quite plausible that the Santa Claus rally came early this year (the Santa Claus rally is a colloquial term for a year-end rally).
With regard to monetary policy, we are told a Powell Fed will be very similar to a Yellen Fed. I disagree: from what I have learned about Mr. Powell, he appears extremely well versed when it comes to bank regulation, but is agnostic when it comes to monetary policy. I have had to search long and hard to find original content on his monetary policy views. That’s not necessarily bad, but suggests that he will rely on others – presumably the staff at the Federal Reserve or possibly someone else on the FOMC Board – when it comes to setting monetary policy. My view is that the Fed is on auto-pilot until, well, until something disengages said autopilot. I can see Mr. Powell manage a financial crisis; but I do not think anyone knows how he will react when there are unforeseen surprises in the economy or the markets. My best guess is he’ll convene committees and come up with what appears to be a reasonable decision. The relevance being that markets don’t wait for committees to be convened. So if volatility shoots up in the markets, not just for a few minutes, but for weeks, substantial damage may be caused to risk assets. A textbook approach to monetary policy suggests that the Fed, not the markets are in charge, hence, why rush? Except that in an era of compressed risk premia and elevated asset prices, maybe, just maybe, the markets are in charge. If early 2016 is any guide, the Yellen Fed back-peddled promptly. As a new Fed Chair comes in with good intentions, I do not think Mr. Powell wants to be bullied by the markets.
The Fed, of course, will never admit that they are slaves of the markets. They react to financial conditions. But what’s the difference? In normal times, there might be a big difference, but when central banks have made risk assets appear to carry only little risk, I argue that there isn’t much difference. Indeed, the reason Ms. Yellen tells us quantitative tightening (QT) is akin to watching paint dry on a wall is because she doesn’t want financial conditions to deteriorate as the Fed’s balance sheet is being reduced. In my humble opinion, that’s an oxymoron because both raising interest rates, as well as reducing the Fed’s balance sheet are inherently designed to tighten financial conditions. That’s the whole point! Except, of course, that financial conditions haven’t tightened:
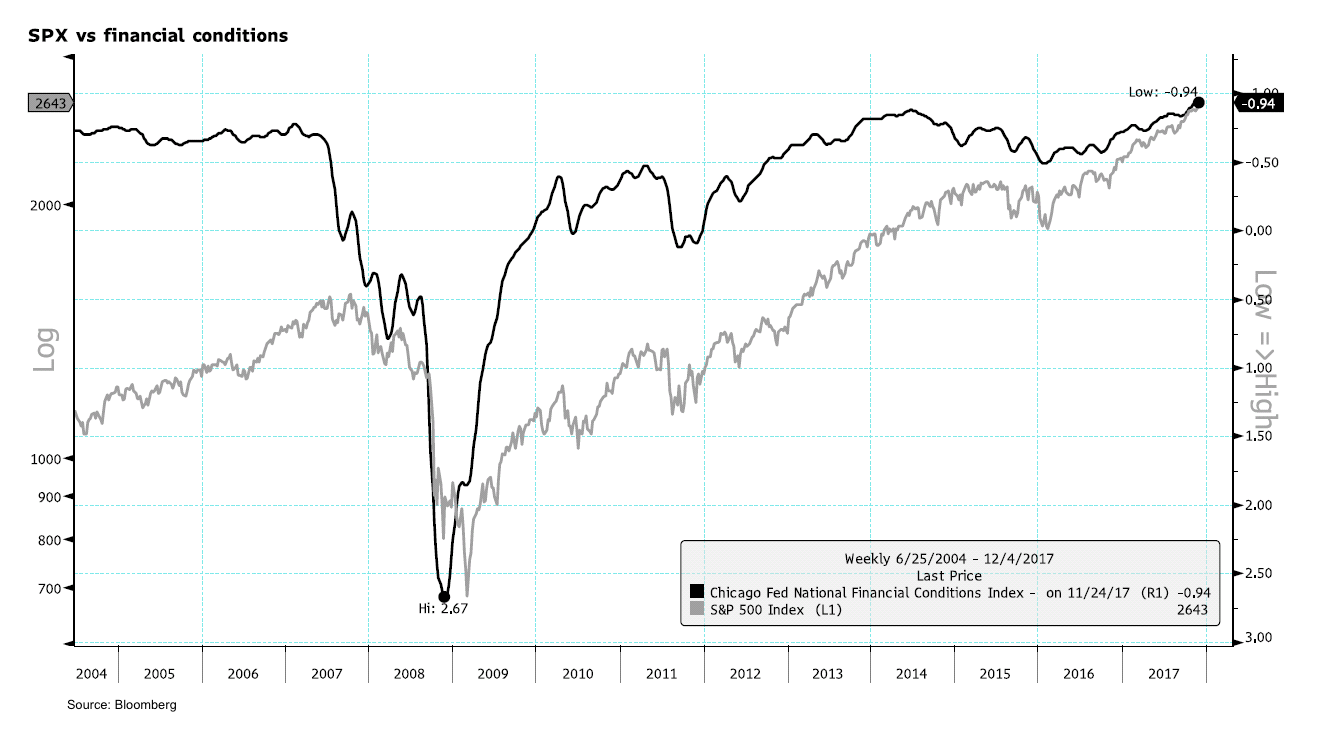
The Fed can set interest rates, but doesn’t dictate how easy it is for borrowers to get credit. In a typical economic expansion, the Fed will start to raise rates to make it more expensive to borrow money (to tighten financial conditions!). But because the economy does well, banks might ease lending standards; or demand by borrowers may pick up for other reasons despite higher rates. As a result, the Fed continues to tighten until, well, until the economy at some point slows down. It’s this indirect dynamic that makes it so difficult for the Fed to engineer a soft-landing, i.e. to stop tightening just in time for excesses to be avoided. There’s a chance that the Fed will get this right. I just assign a very low probability to it.
So what does it mean for different asset classes:
- Equities: you be the judge. I don’t like where equities are, rather seek my returns elsewhere.
- Treasuries: many, including the Fed, suggest long-term rates ought to move higher, that the reducing of the Fed balance sheet will lead to higher long-term rates. I’m not convinced. My view is the Fed’s actions (together with fewer global central bank purchases) will lead risk premia to expand once again. That is, just as QE caused risk premia to come down, QT will push risk premia higher again, causing headwinds to risk assets. Read: there may well be a flight into Treasuries. Together with higher short-term rates, this a flattening of the yield curve. And that, in turn, is a sign of tighter financial conditions to come.
It may well be that all the good news of the tax legislation is priced in, thus not causing equities to move and not causing Treasuries yields to move higher (part of the so-called Trump trade was higher Treasury yields reflecting higher long-term growth prospects).
- Gold has been resilient despite higher rates. In my assessment, this has two reasons: one is that the Fed Funds rate has been very low, thus real yields have stayed low despite nominal rates inching up. More relevant may be that gold may be the easiest diversifier. I call it such because, in our analysis, the correlation to equities since 1970 is just about zero. To get non-correlated returns otherwise, you either need to move to cash (which many are reluctant to do) or embrace sophisticated long-short strategies (which many are also reluctant to do, albeit for different reasons).
- The dollar. Once again, there’s talk about the dollar rallying because growth prospects are better in the US. I would like to caution that the dollar rallied for many years on the prospect of Fed tapering. When it ultimately started, the dollar fell. Now we’ve started the process of taper talk at the ECB, but it is also a drawn-out affair. More so, the euro may have become a funding currency. That is, in risk-off environments, I’ve increasingly seen the euro rally. As such, the euro may be a diversifier for those concerned about risk assets.
As indicated, we don’t have a crystal ball, but that doesn’t mean we don’t have an opinion. We will discuss more in our December 12 outlook webinar (click to register). We will also give you food for thought for the global macro environment in the era of a Powell Fed. And if you are interested in a behind the scenes look at the sort of data we look at in our research meetings, we are working on a special report to share with those interested.
If you believe this analysis might be of value to your friends, please share it with them; follow me on LinkedIn and Twitter.
Axel Merk
President & CIO, Merk Investments

Wednesday December 6, 2017 Available Mon- Friday after 3:00 Pacific.
DOW – 40 on 443 net declines
NASDAQ COMP + 14 on 920 net declines
SHORT TERM TREND Bullish
INTERMEDIATE TERM Bullish
STOCKS: Stocks meandered on Wednesday in a seemingly confused manner. We liked the fact that the high techs and the NASDAQ showed signs of life but the listed market couldn’t get out of its own way.
Breadth was still not encouraging and the put call ratio remains low. Given the seasonality, it’s tempting to put on a trading position, but let’s hold off for now.
GOLD: Gold was up $2. Just an anemic bounce within a downtrend.
CHART: The NASDAQ Composite is just curling up from an oversold condition. This has a decent chance of projecting further strength. If this market rallies, it’s unlikely that the Dow and S&P 500 will sit around.

BOTTOM LINE: (Trading)
Our intermediate term system is on a buy.
System 7 We are in cash. Stay there for now. We’re looking to get back in, but we can’t get an all clear just yet.
System 8 We are in cash. Stay there for now.
System 9 We are in cash.
NEWS AND FUNDAMENTALS: The ADP employment report showed an additional 190,000 jobs, more than the expected 186,00. Oil inventories dropped 5.6 million barrels. Last week they dropped 3.4 million.
INTERESTING STUFF: “The difference between ‘involvement’ and ‘commitment’ is like an eggs-and-ham breakfast: the chicken was ‘involved’ – the pig was ‘committed’.”——– unknown
TORONTO EXCHANGE: Toronto was down 7.
BONDS: Bonds were up slightly.
THE REST:The dollar continued its rally. Crude oil got smacked, pretty good in spite of the lower inventories.
Bonds –Bullish as of November 14.
U.S. dollar – Bullish as of Nov. 28
Euro — Bullish as of October 10.
Gold —-Bearish as of November 29.
Silver-— Bearish as of November 29.
Crude oil —-Bearish as of Nov. 27.
Toronto Stock Exchange—- Bullish as of September 20, 2017.
We are on a long term buy signal for the markets of the U.S., Canada, Britain, Germany and France.

Monetary conditions (+2 means the Fed is actively dropping rates; +1 means a bias toward easing. 0 means neutral, -1 means a bias toward tightening, -2 means actively raising rates). RSI (30 or below is oversold, 80 or above is overbought). McClellan Oscillator ( minus 100 is oversold. Plus 100 is overbought). Composite Gauge (5 or below is negative, 13 or above is positive). Composite Gauge five day m.a. (8.0 or below is overbought. 13.0 or above is oversold). CBOE Put Call Ratio ( .80 or below is a negative. 1.00 or above is a positive). Volatility Index, VIX (low teens bearish, high twenties bullish), VIX % single day change. + 5 or greater bullish. -5 or less, bearish. VIX % change 5 day m.a. +3.0 or above bullish, -3.0 or below, bearish. Advances minus declines three day m.a.( +500 is bearish. – 500 is bullish). Supply Demand 5 day m.a. (.45 or below is a positive. .80 or above is a negative). Trading Index (TRIN) 1.40 or above bullish. No level for bearish.
No guarantees are made. Traders can and do lose money. The publisher may take positions in recommended securities.

While everyone’s been talking about the Dow’s third major milestone this year – breaking the 24,000 mark – I’m focusing on something else…
You see, there’s a new technical pattern forming in a couple of department store stocks. If it’s true and you catch it at the right time, you can make a lot of money.
But timing is everything because this pattern is a tricky one.
Make sure your kids aren’t looking over your shoulder trying to read this educational piece. If you are the squeamish type, you may not be able to get through this article in one reading. I’m going to teach you a new technical pattern with a not-so-happy name.
Let’s examine the profit potential of this macabre-sounding pattern that may be taking place on a couple of department store stocks…
The Dead Cat Bounce
The pattern gets its name from an old saying among traders that “even a dead cat will bounce if dropped from a high enough level.”
And the same for goes for stocks. Well, it goes for stocks when you’re interested in a short-term recovery-type trade, which is great for a quick profit.
A dead cat bounce (DCB) is the type of pattern that usually forms after a sustained drop in share price, let’s say six months to a year. At that point, the stock may become a turnaround candidate with the potential to be a nice performer over the long haul. But that’s just potential…
The stock being observed is still one that had a significant drop in share price over a long period of time.
These stocks are generally trading at or near a year’s low in price, so to expect them to just bounce back to previous all-time highs or start making new highs is actually not that realistic.
The term “bounce” in the name of the strategy signifies to me this will be a somewhat sharp or quick upward move. After a stock soars again, it’s not uncommon for it to fall back to Earth. In fact, it’s generally likely.
It may bounce a few times at this low and start hammering a lengthier bottoming-type technical setup like a double or triple bottom, a rounding bottom, or a cup-and-handle pattern.
But it first has to bounce, and the dead cat bounce is the first pattern to watch for when stocks are at significant lows. We use it to profit from the short-term recovery of a falling stock.
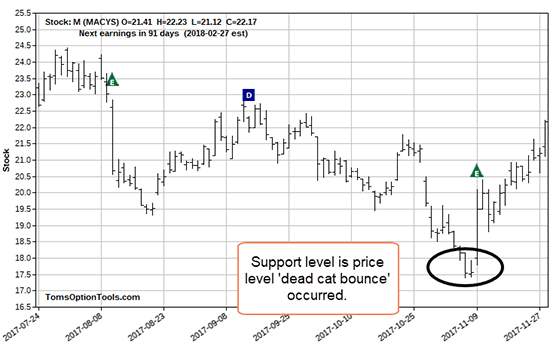
A Look at Macy’s

The “E” I circled indicates Macy’s Inc.’s (NYSE: M) most recent earnings report.
M stock dropped after all the previous earnings reports on the chart. Yet the stock recently bounced after its 52-week low. The previous post-earnings downward trend makes it hard to know if the latest report factored into the bounce.
Look at what my tools show as the percentage move of the stock after the last few earnings reports:
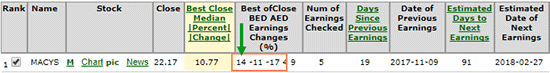
The most recent percentage move is on the left. It was better than the two preceding earnings reports. In the chart, you can also see how the stock moved over the last three earnings reports.
Earnings Whisper shows that Macy’s earnings came in better than expected at $0.23 per share versus estimates of $0.19 per share. Revenue met expectations at $5.3 billion.
The report from the earnings website also stated Macy’s expects fiscal-year earnings between $2.91 and $3.16 per share, excluding items compared to the company’s previous guidance between $2.90 and $3.15 per share.
Based upon the action in the share price, we see that investors considered it favorable news. Even Jim Cramer on CNBC called M a buy at the time.
The Cause for Concern with This Pattern
Most of the time, we only notice the dead cat bounce after it has already happened…
Around earnings reports, I encourage you to watch the price action for a stock at a 52-week low or near lows over a six-month period. I am not talking about looking for a straddle or strangle, but looking for a straight, long call option trade.
What I look for if I’ve missed the bounce (which has happened to everyone) is a retest of the price from which the stock bounced.
I look for that price to hold as a support. Since it bounced from that price once, I look for it to do so again as it will have formed a double-bottom support.
click here – you’ll get Tom’s twice-weekly Power Profit Trades delivered directly to your inbox, free of charge.

-
I know Mike is a very solid investor and respect his opinions very much. So if he says pay attention to this or that - I will.
~ Dale G.
-
I've started managing my own investments so view Michael's site as a one-stop shop from which to get information and perspectives.
~ Dave E.
-
Michael offers easy reading, honest, common sense information that anyone can use in a practical manner.
~ der_al.
-
A sane voice in a scrambled investment world.
~ Ed R.
Inside Edge Pro Contributors

Greg Weldon

Josef Schachter

Tyler Bollhorn

Ryan Irvine

Paul Beattie

Martin Straith

Patrick Ceresna

Mark Leibovit

James Thorne

Victor Adair