
Gold & Precious Metals
 The gold market is heading towards a big fundamental change that few are prepared. While many analysts in the alternative media community suggest that the gold price is manipulated due to Fed and Central bank intervention, there is another more obscure rationale that is the likely culprit. I call it, “The Blind Conspiracy.”
But, before I get into the details of this Blind Conspiracy, there are a few very troubling developments in the alternative media community that I would like to discuss first. The bulk of these concerns has to do with the increasing amount of faulty analysis and misinformation as well as the peddling of lousy conspiracy theories on the internet.
Why is this a big problem? Because a lot of readers are being misguided as to the true nature of the serious predicament we are facing. Half of the emails that I receive are from readers who are bringing up doubts based on other analysts’ faulty analysis and misinformation. Thus, it takes a great deal of effort to provide the real facts and data to counteract the damage being done by certain individuals, even those with good intentions.
Furthermore, an increasing number of so-called precious metals analysts have switched over to Bitcoin and other cryptocurrencies, believing that gold and silver will no longer function as monetary metals. However, some of these analysts suggest that silver will still be valuable because it will be used as critical raw material in advanced products in our new HIGH-TECH WORLD. I find this idea of a future modern high-tech world quite amusing when we can’t even maintain the failing complex infrastructure we are currently using.
American Society Of Civil Engineers 2017: U.S. Infrastructure Grade Is…???
According to the Amercian Society Of Civil Engineers, ASCE, they just came out with their grade this year for U.S. infrastructure. Does anyone want to guess what overall grade we received here in the good ole U.S. of A? The ASCE gave us a D+:

Well, at least a D+ isn’t an “F” grade. Here is the ASCE’s Infrastructure Report Card Grading Scale for receiving a “D”:
“D” GRADE = POOR, AT RISK
The infrastructure is in poor to fair condition and mostly below standard, with many elements approaching the end of their service life. A large portion of the system exhibits significant deterioration. Condition and capacity are of serious concern with strong risk of failure.
The ASCE U.S. Infrastructure Report also provides separate grades for different aspects of U.S. infrastructure. For example, the U.S. Energy Infrastructure received a “D+” as well. This is a brief description of the Energy Infrastructure:
Much of the U.S. energy system predates the turn of the 21st century. Most electric transmission and distribution lines were constructed in the 1950s and 1960s with a 50-year life expectancy, and the more than 640,000 miles of high-voltage transmission lines in the lower 48 states’ power grids are at full capacity.
Moreover, the report states that $4.5 trillion needs to be invested 2016-2025 to raise the U.S. infrastructure to a “B’ Grade. However, only $2.5 trillion has been budgeted. Thus, we are $2 trillion short of the total amount needed. Regardless, I doubt we will be able to spend anywhere close to the budgeted $2.5 trillion over the next decade for our infrastructure. Unfortunately, I see the U.S. Government and private sector running into serious financial trouble by 2020 as the massive amount of debt and derivatives finally take down the system.
So, the question remains. How are we going to move into a new HIGH-TECH world if we can’t even maintain our current infrastructure?
The notion that we can bring on some new “Energy Technology” fails to consider the tremendous amount of raw materials, manufacturing, transportation, and logistics to repair and maintain our current infrastructure. You see, we have much bigger problems than just replacing an energy source or technology. But, to understand that principle, you must look past superficial thinking and “Silver-Bullet energy technologies.”
Now, if you hear certain analysts suggesting that gold and silver will no longer be used as money in the future because cryptocurrencies will take over the monetary role in our new high-tech world, you may want to contact them and provide the link to the U.S. Infrastructure D+ Grade Report.
Destroying Once Again…. Certain Myths About The Gold Market
If I collected an ounce of gold for every email that I have received about patently false gold myths and conspiracies; I could buy one hell of a lot of silver….LOL. Gosh, if I went back to my email folder and added up all the emails on this subject, it would number well over 500 in my ten years publishing articles in the alternative media community. However, I continue to receive the same type of emails because individuals are still being misled.
Before I begin, let me say that I focus my work on disproving the faulty analysis by other individuals, and not directing anything negative towards the person. I am adamantly against the idea of “targeting the messenger.” Rather, I like to target the faulty message. So, there is nothing personal in my attempt to set the record straight.
Let me start off by saying…. THERE AREN’T MILLIONS OF TONS OF HIDDEN GOLD in the world. Anyone who continues to believe this needs to pay close attention to the following information.
One of my readers sent me the following recent YouTube video by Bix Weir, titled “Vast Gold Riches Hidden In The Grand Canyon“:

In the video, Bix quotes a New York Times article published on June 19, 1912, that proclaimed vast gold riches in the Grand Canyon. According to Bix, this massive gold find is what prompted the starting of the Federal Reserve because billions of ounces of new gold from the Grand Canyon dumped into the market would destroy the monetary system.
While this may sound plausible to the layman, if we carefully read the article and do some additional research, we will come to a much different conclusion than what Mr. Weir is suggesting.
First, Bix makes a grave error during the interview when he states “billions of ounces of gold,” rather than “billions of Dollars of gold.” Here is the segment of the article:

There’s a big difference between a billion ounces of gold and a billion dollars worth of gold. For example, the market price of gold in 1912 was $20.65 an ounce. If we assume that $2 billion worth of gold was extracted from the Grand Canyon, it would equal approximately 100 million oz of gold. If we take it a step further and convert it to metric tons, it would equal 3,110 metric tons…. a figure much much lower than one million tons stated by Mr. Weir.
Second, the article provides us with an idea of the very low quality of the gold found in the silt on the banks of the Grand Canyon:

As we can see, the individual in charge of the mining operation in the Grand Canyon stated that the value of gold was worth 50 cents per yard. When gold miners refer to a “yard,” they mean a cubic yard or a volume that equals 1.3 tons. With an ounce of gold worth $20 in 1912, 50 cents a yard is a tiny amount of gold. Thus, 50 cents worth of gold in a yard is approximately 0.025 oz or one-fortieth of an ounce of gold.
Let’s compare the supposed vast Grand Canyon gold riches worth 50 cents a yard to the gold mining that took place in Alaska during the same period. According to the data provided by the U.S. Bureau of Mines in 1912 Report:

This chart represents “Placer” gold mining in Alaska, which was the same type of gold mining that took place on the banks of the Grand Canyon. Placer gold mining is the process of washing gold from gravel, sand or silt. Lode mining is extracting gold ores from veins in rock. Here we can see that the average value of gold recovered in Alaska in 1912 was $2.10 per cubic yard. Now, why on earth would anyone want to go to the remote location in the Grand Canyon and mine gold for 50 cents a yard when you could receive four times as much in Alaska??? Please, someone forward that information to Mr. Weir.
Third, the notion of extracting Billions of Dollars of gold from the Grand Canyon fails logistics miserably. Let’s overlook Mr. Weir’s error in quoting billions of ounces of gold rather than billion dollars of gold and consider the tremendous logistics of mining that amount gold out of the Grand Canyon. According to the same U.S. Bureau of Mines 1912 Report linked above, Alaska produced a total of 7.4 million oz of gold worth $154 million between 1880 and 1912:

So, in over three decades of mining placer gold in Alaska, the total amount was $154 million. Furthermore, the value of the gold per yard was likely much higher between 1880-1900. Regardless, it took a great deal of human resources, energy, and capital to produce the $154 million worth of gold and the most ever produced in one year during that time-period in Alaska, was 1,066,000 oz of gold in 1906 valued at over $22 million.
Which brings us to the next logical conclusion…. was it ever possible for anyone to produce billions of dollars worth of gold valued at 50 cents a yard in the Grand Canyon when a small percentage of that amount ($154 million) took over three decades to produce in Alaska? Hell, even during the mighty California Gold Rush of 1848, the peak year of 3.9 million ounces in 1852 was only worth $80 million. However, the average annual gold production for the California gold rush was only 1.3 million ounces per year valued at $26 million. It would take a great deal of time mining gold during the famous California Gold Rush to equal just $1 billion.
Even at $1 billion, that is only 50 million oz of gold or a measly 1,555 metric tons of gold. Again, nowhere near the one million tons of gold suggested by Mr. Weir.
Lastly, the supposed vast gold riches in the Grand Canyon came to a dismal end. That’s correct. If we spent a few minutes doing a bit of research on the internet, we would find out The Rest Of The Ugly Story.

(American Placer Gold – Spencer Mining Operation 1911, Grand Canyon)
According to Arizona State history of gold mining at Lee Ferry in the Grand Canyon, the American Placer Gold company needed coal to process the gold. Unfortunately, the only coal seam was 28 miles away. So, the gold mining investors decided to incorporate a steamboat to transport the coal:

Investors decided a 92-foot steamboat would improve coal transport and gold production; it was ordered and assembled by late February 1912. Dubbed the Charles H. Spencer, the steamboat performed the way it was supposed to, but it burned most of the coal it transported in the process. Spencer also had trouble with his amalgamator and by 1912 his investors had seen enough and shut the project down. Spencer left, and his boat sank to the bottom of the Colorado River. The Charles H. Spencer is now on the National Register of Historic Places as a shipwreck in Arizona.
Just consider for a moment the type of intellectual thought process taken by these investors who couldn’t understand that the steamboat would consume most of the coal during its 28-mile trip.
Thus, the LIFE & DEATH of the Great Vast Gold Riches in the Grand Canyon came to an abrupt end, not because there were billions of ounces of gold that would destroy the global monetary system, but rather due to the typical mistake made by investors. And that is… the belief that utterly incompetent management and miners could extract low-quality gold that is uneconomical to produce.
So, if we look at the New York Times article that Mr. Weir quotes as his source of billions of ounces of gold, we can logically assume that it was likely written by the company spokesman to get more POOR UNWORTHY INVESTOR SLOBS to purchase the American Placer Gold stock before it went belly-up. It’s called the PUMP and DUMP…. a shady stock marketing technique that has been going on for hundreds of years.
If we can have an open mind and the ability to discern fact from fiction or lousy conspiracy theories, we can finally put an end to the notion that the world has a Million Tons of Hidden Gold in the world.
THE BLIND CONSPIRACY: The Gold Market Is Heading Towards A Big Fundamental Change
Now that we have dispensed with certain conspiracies that don’t pass the smell test, there is a real one that very few are aware. I call it the BLIND CONSPIRACY. The interesting thing about this conspiracy is that nobody really knows about it. However, it behaves like a conspiracy because many individuals and parties are manipulating the market which is providing a false sense of security to the average investor.
Thus, investors with a false sense of security, continue to invest in STOCKS, BONDS, and REAL ESTATE at amazing inflated values. Today, the Dow Jones hit a new record high of 24,272 points:

If you look at this chart of the Dow Jones Index, it is starting to resemble the Bitcoin chart. However, Bitcoin’s graph is moving up at a level ten times more insane than the Dow Jones Index:

While the Dow Jones Index increased 4,200 points, or 21% since the beginning of 2017, the Bitcoin price has surged more than $9,000, or a staggering 1,125% increase. Furthermore, the Bitcoin price doubled in just the past month. This is completely insane. Even though a lot of Bitcoin enthusiasts are shouting for $20,000 and $100,000 Bitcoin, if we are ever going to get there, there needs to be a serious correction first. However, we may have already seen the top of Bitcoin at $11,400.
Folks, nothing goes straight up and then continues even higher. I would be very cautious about investing in Bitcoin at this time. Both the stock market and cryptocurrencies are extremely overbought… to say the least. On the other hand, gold and silver have been selling off over the past several days and are even closer to their lows and cost of production.
Getting back to the Blind Conspiracy and the Big Fundamental Change in the gold market, investors are entirely in the dark about the dire energy predicament we are facing. I continue to receive emails from individuals in various industries that tell me the “Situation is MUCH WORSE than you realize.” Also, there are good CLUES published in the media if you are IN-TUNE to this information.
According to this jewel, titled Oil Major: 70% Of Crude Can Be Left In The Ground, by Nick Cunnigham:
“A lot of fossil fuels will have to stay in the ground, coal obviously … but you will also see oil and gas being left in the ground, that is natural,” Statoil’s CEO Eldar Saetre told Reuters in an interview. “At Statoil we are not pursuing certain types of resources, we are not exploring for heavy oil or investing in oilsands.
If heavy oil and oil sands are to be left unproduced, then a lot of oil will need to stay in the ground. According to the USGS, about 70 percent of the world’s discovered oil reserves are in the form of heavy oil and bitumen. Much of that comes from Venezuela – one of the last places in the world that an oil company wants to do business in these days – and Canada.
Last year, Statoil abandoned Canada’s oil sands, selling off its assets to Athabasca Oil Corp. But Statoil is hardly alone in the exodus. ConocoPhillips unloaded a whopping $13.3 billion of oil sands assets to Cenovus Energy earlier this year. Shell sold off $4.1 billion in oil sands assets to Canadian Natural Resources. Meanwhile, ExxonMobil wrote off 3.5 billion barrels of oil sands from its book in February, admitting that they were unviable in today’s market.
ConocoPhillips’ CEO said that it would no longer invest in any oil project that needs a breakeven price of $50 or higher, according to the FT.
If the Major Oil Industry believes that upwards of 70% of the oil reserves should be left in the ground, how much do we really have left to produce?? Furthermore, it was quite surprising to see that the ConocoPhillips CEO said they would no longer invest in oil projects with a breakeven above $50. Folks, there aren’t many oil discoveries available with a price tag less than $50 a barrel.
Again, the clues are all around. Let me repost the completely awful financial results by the second largest natural gas producer in the United States. Chesapeake Energy produced the second highest amount of natural gas during the first nine months of 2017 at 2.9 billion cubic feet per day compared to ExxonMobil’s 3.1 billion cubic feet per day. So, what benefit did Chesapeake receive for producing the country’s second largest amount of natural gas? Take a look at the Q3 2017 Cash Flow Statement:

After everything was considered, Chesapeake’s operations provided $273 million in cash (shown in the highlighted yellow). For those who are not familiar with Cash Flow Statements, we subtract capital expenditures from cash from operations to arrive at their FREE CASH FLOW. Unfortunately for Chesapeake, they spent a staggering $1.6 billion (highlighted in blue) on drilling and completion costs (capital) to produce their natural gas and oil. Thus, Chesapeake’s Free Cash Flow was a negative $1.3 billion.
That would have been terrible news if it wasn’t for the sale of properties of worth $1,193 million ($1.2 billion.. two lines below the highlighted blue line). Which means, the financial wizards at Chesapeake used asset sales to help pay for their natural gas drilling capital expenditures. How long can Chesapeake sell properties to fund their drilling costs??
Are we starting to get a PICTURE here? Regrettably, even highly trained energy analysts do not understand that the oil and gas industry is cannibalizing itself just to stay alive. If investors do not understand just how bad our energy situation has become, they are BLINDLY investing in the worst assets (STOCKS, BONDS & REAL ESTATE) that derive their value from the burning of ENERGY.
This is the BLIND CONSPIRACY. It’s taking place right in front of our eyes, and virtually no one sees it.
We are going to experience a Massive Fundamental Change in the gold market because investors will finally begin to understand what a true store of wealth is versus one that is an ENERGY IOU. Stocks, Bonds, and Real Estate get their value from burning energy IN THE FUTURE, while a gold or silver coin bought today, received its value from burning energy IN THE PAST. That is a big difference that investors, even precious metals investors fail to realize.

The US economic boom is still in progress, where a boom is defined as a period during which monetary inflation and the suppression of interest rates create the false impression of a growing/healthy economy*. We know that it is still in progress because the gap between 10-year and 2-year Treasury yields — our favourite proxy for the US yield curve — continues to shrink and is now the narrowest it has been in 10 years.

Reiterating an explanation we’ve provided numerous times in the past, an important characteristic of a boom is an increasing desire to borrow short to lend/invest long. This puts upward pressure on short-term interest rates relative to long-term interest rates, which is why economic booms are associated with flattening yield curves. The following chart shows the accelerating upward trend in the US 2-year yield that was the driving force behind the recent sharp reduction in the 10yr-2yr yield spread.
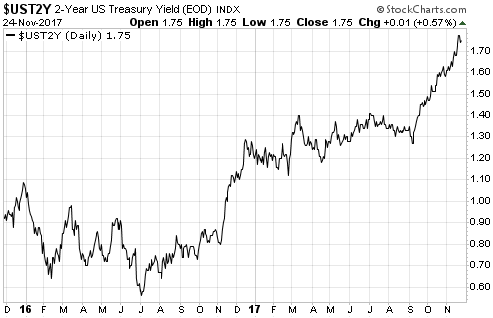
The above paragraph explains why a yield-curve trend reversal from flattening to steepening invariably occurs around the time of a shift from economic boom to economic bust. Such a reversal is a sign that the willingness and/or ability to take on additional short-term debt to support investments in stocks, real estate, factors of production and long-term bonds has diminished beyond a critical level. From that point forward, a new self-reinforcing trend involving debt reduction and the liquidation of investments becomes increasingly dominant.
The recent performance of the yield curve indicates that the US economy hasn’t yet begun the transition from boom to bust.
*The remnants of capitalism enable some genuine progress to be made during the boom phase, but the bulk of the apparent economic vibrancy is associated with monetary-inflation-fueled price rises and activities that essentially consume the ‘seed corn’.

I would no sooner invest without using charts than I would drive down a freeway at 90 miles per hour with my head in a blindfold or a brown paper bag. What would you think if the Weatherman came on the TV and instead of showing you a chart, presented you with a table of data? – or you boarded a plane with the windows shuttered and the Captain explaining “Oh – I don’t need to see out – my instruments provide me with all the information I need to fly the plane.”? Charts are about perspective and proportion, and without them you’ve got none.
By the time you are done reading this review you will, or should be if you are reasonable, be left in no doubt about the awesome money making power of charts, properly used. On clivemaund.com our investing strategy is simple, we go where the action is. Until 2011 some of the best gains were to be made in the Precious Metals space and we tracked that sector closely during its bullmarket. Then it changed and in more recent times the action has shifted to biotech, blockchain and cryptocurrencies, and marijuana, Tech generally and the FANGS etc. Because we go where the action is, that is why we are able to make the big gains you will see set out below on a regular basis. The charts presented below are color coded – blue for Oil, coral for Biotech, green for Marijuana and yellow and white for Blockchain, a sector we are just moving into. Because these charts are largely retrospective the usual indicators appended above and below them have been removed to save space and reduce clutter. Note that clicking on the company name will take you to the most relevant report on its stock on clivemaund.com where the password protection has been removed in order that you are able to open it. Now read on… Biotech & Medical StocksWe just closed a nice trade in Scythian. We spotted that a Double Bottom was forming above its rising 200-day moving average, accompanied by a positive volume pattern, so bought it on a couple of occasions as it marked out the 2nd low of the pattern. Took profits last week after it had arrived at a resistance level in an overbought state… Scythian Biosciences SCYB.V C$6.75

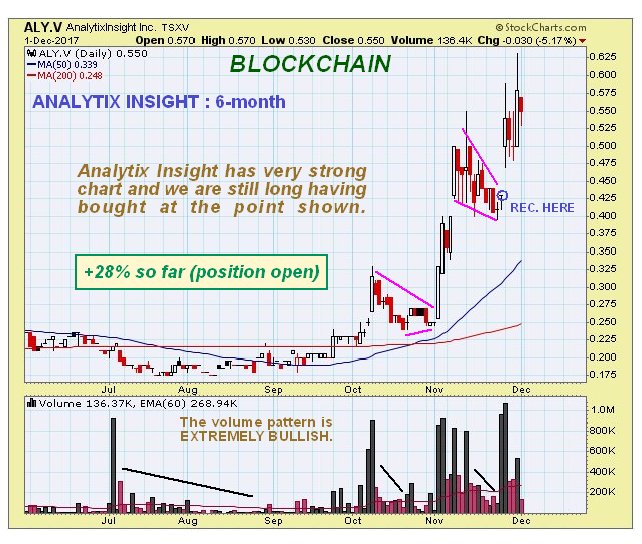
Blockchain StocksAnalytix Insight Inc ALY.V, ATIXF on OTC, C$0.55, C$0.43 Analytix has a very strong chart. We bought it about a week ago as it completed a tight bull Flag, which it then broke out of so that we are now up 28% and holding for further gains. Note the powerfully bullish volume pattern…
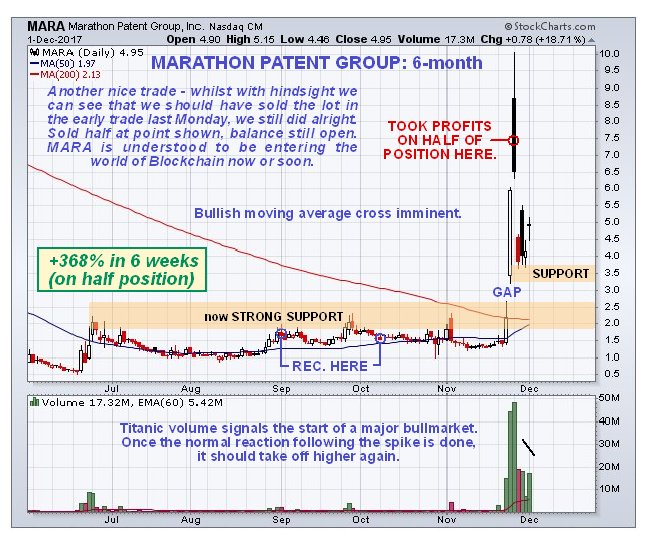
Marathon Patent MARA on NASDAQ CM, $4.95 Accumulated Marathon Patent from September through November, having observed that a Cup & Handle base was completing, accompanied by a bullish volume pattern, and that the price was converging with its falling 200-day moving average. It broke out a week or two ago and went nuts to the upside on immense volume, which was clearly a very bullish development. We sold half our position at a good price in expectation of a heavy reaction, which ensued, and held the balance for a later resumption of the advance. After we bought this stock there was a 1 for 4 reverse split, which evidently didn’t do it any harm. It is understood that, despite the name, this is now a Blockchain stock.
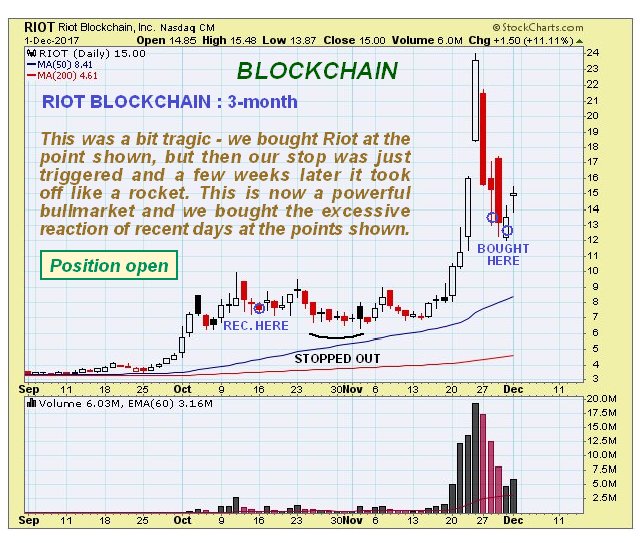
Riot Blockchain RIOT on NASDAQ CM, $15.00 We were on to Riot Blockchain as far back as October, when we bought it, but tragically we were just stopped out, because a few weeks later it broke out and took off like a rocket. Then it overreacted to the downside last week giving us a chance to jump on it at a relatively good price. Given that this stock is in one of the hottest sectors on the planet and that it is one of the few Blockchains that are publicly traded, it has the potential to do a moonshot, especially as it only has 8.32 million shares outstanding and a float of only 3.83 million.
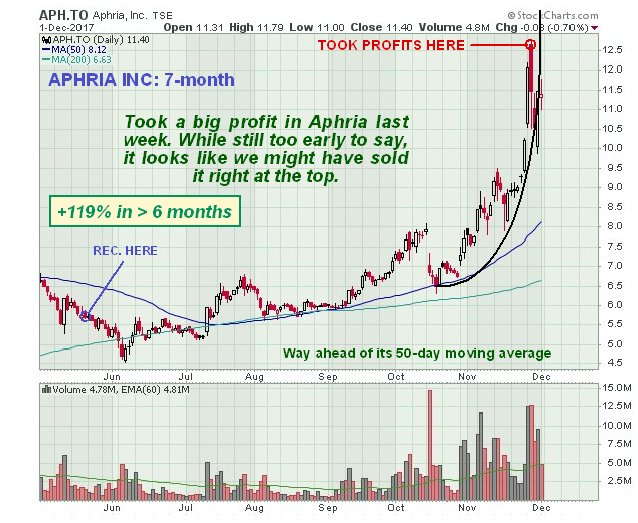
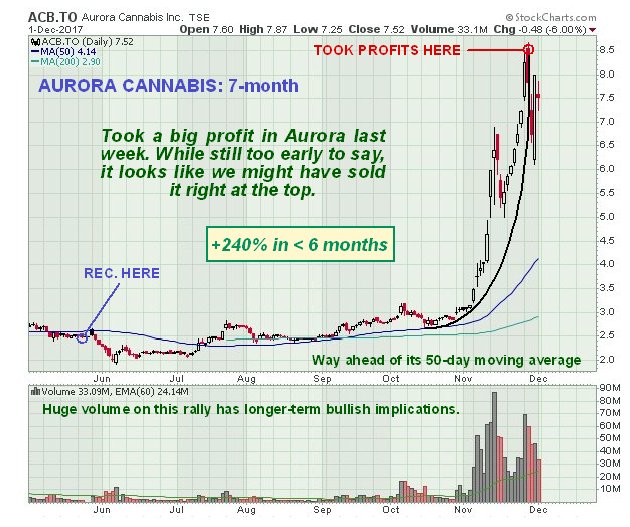
Cannabis StocksGiven the number of cannabis stocks shown below, you might be forgiven for thinking that the writer has a predisposition towards cannabis, perhaps even has an addiction problem. Not true, we went for them because they looked like they were going to appreciate, and they did. Canadian cannabis companies are the global leaders in the field, largely thanks to the moronic Federal threat to the industry south of the border, and Canada sports some of the biggest names in the industry like Aphria, Aurora Cannabis and Canopy Growth Corp, which have all done very well this year. Their growth potential (no pun intended) has not gone unnoticed by either the Alcohol and Tobacco industry or big Pharma, who are starting to circle overhead like vultures in readiness to swoop and take over these companies. This is why we went for Aphria and Aurora Cannabis over 6 months ago, which have proved to be very good investments that we sold at the peak of the recent parabolic ramp for big gains… Aphria Inc APH.TSX, APHQF on OTC, C$11.40, $8.95
Aurora Cannabis ACB.TSX, ACBFF on OTC, C$7.52, $5.92
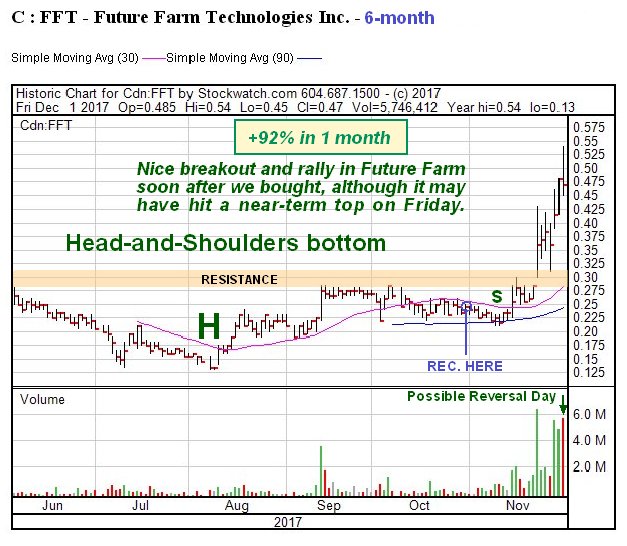
Future Farm Technologies FFT. CSX, FFRMF on OTC, C$0.47, $0.376 While Future Farm might have thought it would escape our notice tucked away out in the countryside, it didn’t, because we spotted that a Head-and Shoulders bottom was completing in it, so we went for it late in October before it broke out and are up 92%. However, a toppy candle formed in it on high volume on Friday, so it may now react back…
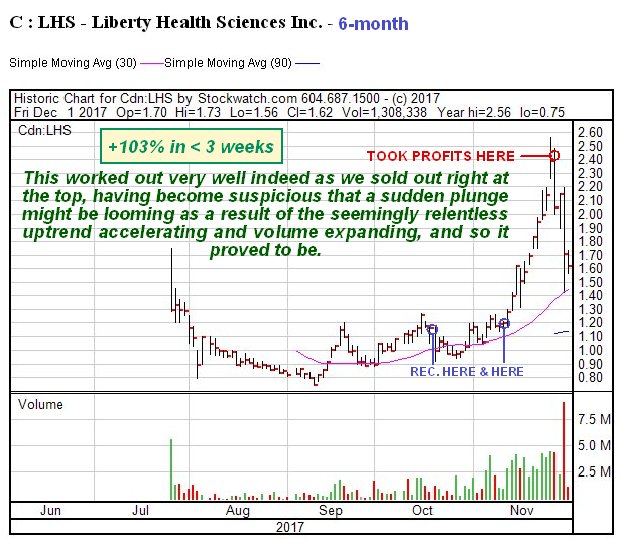
Liberty Health Sciences LHS.CSX, LHSIF on OTC, C$1.62, $1.28 It seems to be “de rigueur” these days for a company to massage its stock price higher before giving its shareholders a jolly good soaking with a funding exercise. We “smelt a rat” in the nick of time and offloaded Liberty Health for a nice profit right at the top, having grown suspicious due to an excessively orderly advance on expanding volume. This was a nice trade because it collapsed immediately after we sold it at the peak.
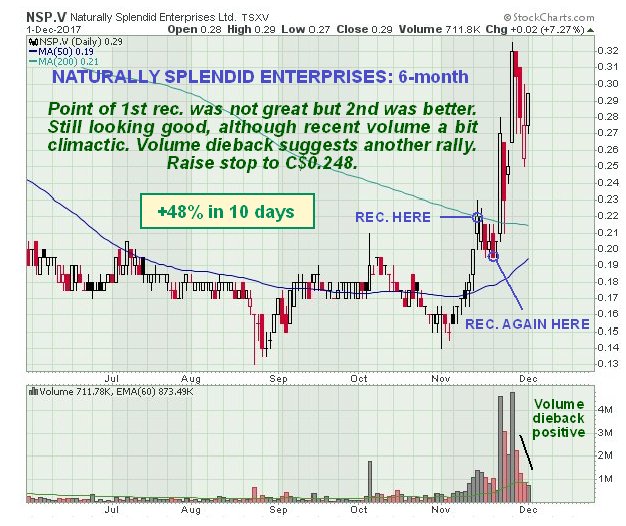
Naturally Splendid Enterprises NSP.V, NSPDF on OTC, C$0.29, $0.24 We bought Naturally Splendid at a good point, after being alerted to “something going on” by the 1st impulse wave which got turned back by the falling 200-day moving average. Volume pattern indicated it was going higher again, so we bought it during the formation of a tight bull Flag, and sure enough it took off higher gain, so that we are now up 48% on the last purchase in 10 days. This position is still open and we raise the stop to C$0.248 for a risk free trade.
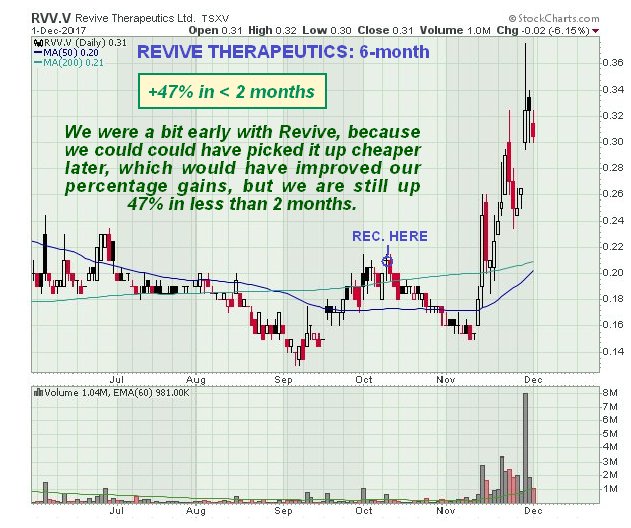
Revive Therapeutics RVV. V, RVVTF on OTC, C$0.31, $0.242 The timing of entry into this could have been better as we could have picked it up cheaper a month later, but it revived and went on to do what was expected of it with a steep advance that has resulted in us being up 47%, so it’s a case of “all’s well that ends well”, except of course, that “you shouldn’t count your chickens until they’ve hatched”, as we haven’t sold it yet.
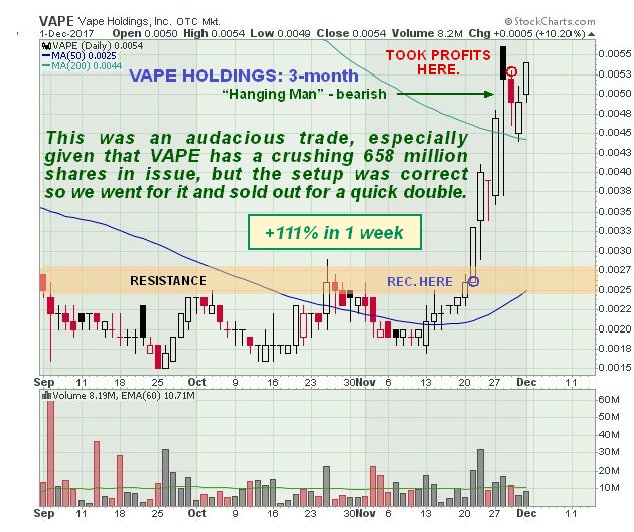
Vape Holdings VAPE on OTC, $0.0054 We worked out that Vape was ready for a sharp rally and bought it right before the rally started, and sold it last Wednesday for a quick 111% gain in less than a week. Nice work if you can get it. Be good if it reacts back so that we can perhaps give it another go.
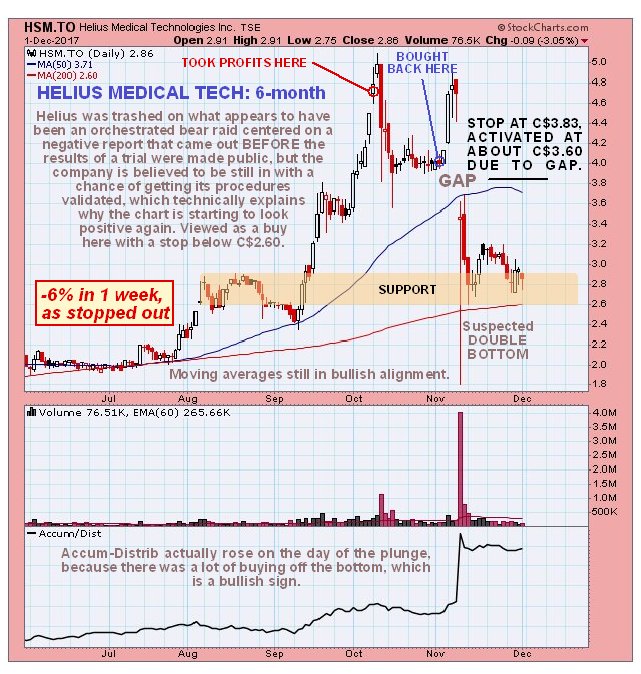
Not all of our trades are profitable of course – there be always be a number of trades that don’t work out as expected. This is because charts indicate probabilities not certainties, and there are always uncertainties that can throw things out of kilter, just as in everyday life. You can do the same commute for decades, but each and every day you have to be ready for the unexpected, such as a child running out in from of your car. In the same way, when trading, you have to be prepared to duck and dive and roll with the punches. For example, a charismatic well connected CEO of a company may suddenly get run over by a bus, and the next trading session the stock tanks. The only people in this game who are right all the time are liars, and in fact the only way to be right all the time is to have a time machine, like Doc and Marty’s DeLorean in the Back to the Future movies, which would be very useful as you could zip forward a year, take a quick peek at the charts, zoom back and make a fortune. Whilst visiting the Universal Studios’ lot in L.A. a few years back I came across this DeLorean, seemingly abandoned, and made them an offer for it, but they refused to sell – I believe they are using it to fast forward and see which movies they are making will do well at the box office, although they would never admit it of course. Here are a couple of examples of our losing trades to balance things up… Helius Medical Technologies HSM.TSX, HSDT on OTC, C$2.86, $2.23
After trading Helius well for quite a while, we sold it near to the early October peak, and then bought it back at a lower price early in November. After rising again for some days it suddenly cratered, due to a broker’s report that came out before the results of an important medical trial were due to be posted, resulting in instant big losses for those long the stock, and it is thought that this was an organized bear raid where those taking part hastily covered their shorts before the results came out and the price bounced back. This theory is given added credence by the fact that the Accum line actually rose on the drop. Thus there is thought to be a fair chance that a Double Bottom is forming here, especially as the price is at important support and above its rising 200-day moving average although this is a difficult setup because there is a lesser chance that the pattern is instead a bear Flag. We were saved from much bigger losses by a stop at C$3.83, which was only activated at C$3.60 due to a large gap down. Molori Energy MOL.V, MOLOF on OTC, C$0.30, $0.25
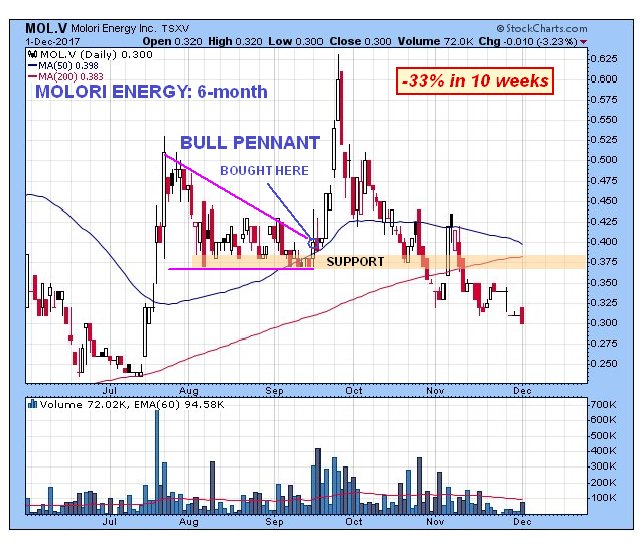
This is another stock that, after showing great promise, did an abrupt about face and ran into the sand. We bought it at the point shown, then it took off higher as expected and everything appeared to be “ship shape and Bristol fashion” but then it lost all its gains, didn’t turn up as it should have done at support and has run off into an erosive decline, leaving us with a significant loss, but it’s probably too late to ditch it now as the current light volume suggests it could turn up again. Fortunately trades like this are in the minority. Stops are a way to handle such situations, although stops can be a double-edged tool as they can frequently result in you being shaken out before a big move, such as befell us with Riot Blockchain as set out above. This is especially the case with low-priced stocks.
Oil Stocks
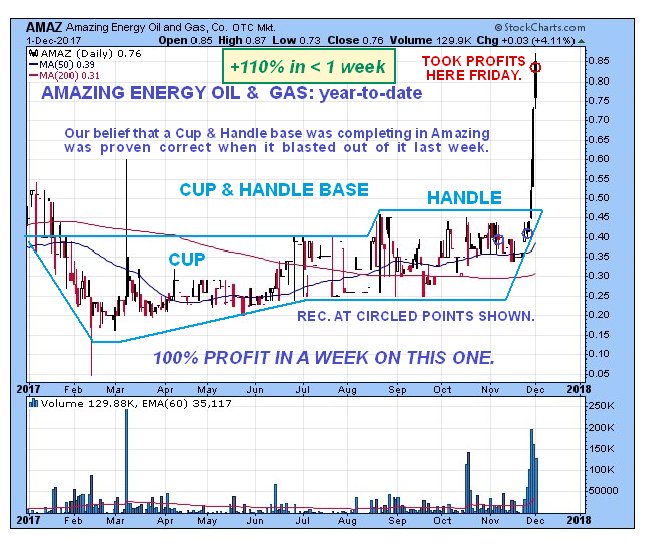
Amazing Energy Oil & Gas AMAZ on OTC, $0.76
This was an “amazing” trade, because after other investors had done the spade work all year building out an admittedly rather bizarre looking Cup & Handle base, we showed up like royalty at just the right time, the day before a sizable rally started, and grabbed a nice profit on Friday, because after becoming overbought at resistance, it looks like it might now react back or consolidate.
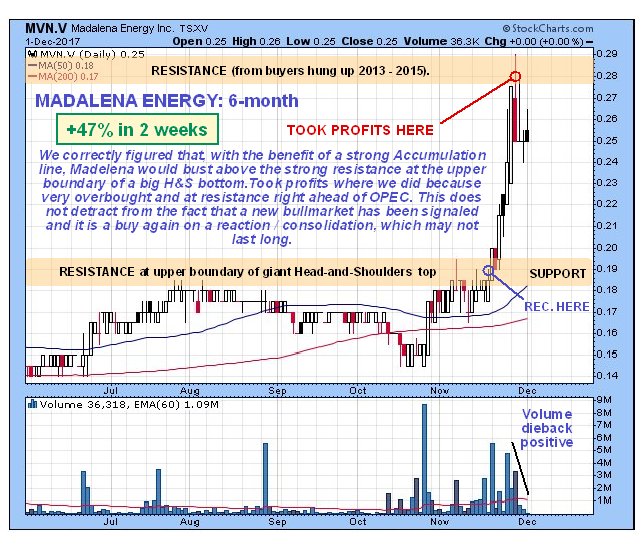
Madelena Energy MVN,V, MDLNF on OTC, C$0.25, $0.214 Here again we let other slower-witted investors do the donkey work of building out a big Head-and-Shoulders base, and then our limo rolls up to bag a quick 47% profit in 2 weeks. “Thank y’all – be seeing ya!”
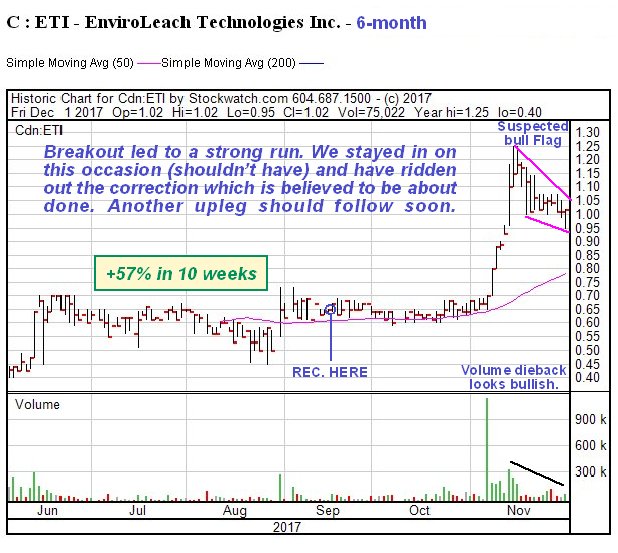
General StockEnviroleach ETI.CSX, EVLLF on OTC, C$1.02, $0.808 There’s a tremendous “Urban Mining” story behind both Enviroleach and Mineworx Technologies, that you are cordially invited to read here. We bought Enviroleach a little early back in September, but “no regrets” because early in November it broke out on big volume and rose strongly. Has reacted back on declining volume in recent weeks in what is believed to be a bull Flag. If this is what it is another upleg should begin soon.
Any of you PM buffs remember this silver call made in September 2011?…
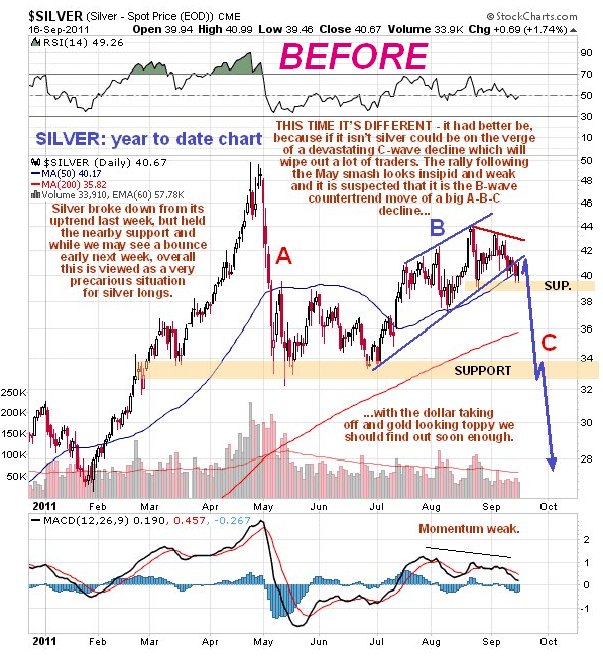
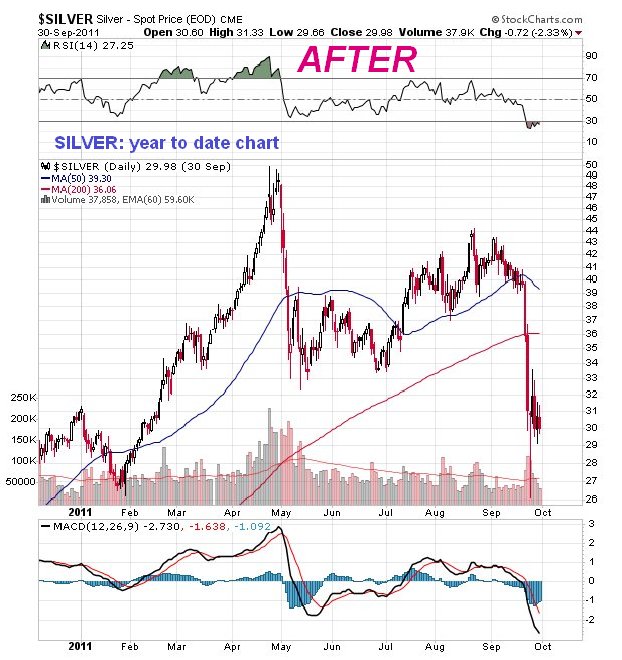
I learnt that one subscriber in California who shorted silver made enough out of this trade to buy his wife a fancy sports car, although this turned out to be a case of enlightened generosity, as guess who ended up driving it most of the time? Finally, a word about the broad US stockmarket. There was a quite dramatic drop intraday on Friday, the biggest for a long time, after which it rallied late in the day to close only a touch down on the day. This was being hailed in many quarters as a sign of its resilience, because the “buy the dip” crowd dutifully showed up as usual and saved the day, but that’s not how it looks to us. That action Friday was a sign of growing nervousness that left behind a large bearish “Hanging Man” candlestick on the chart.
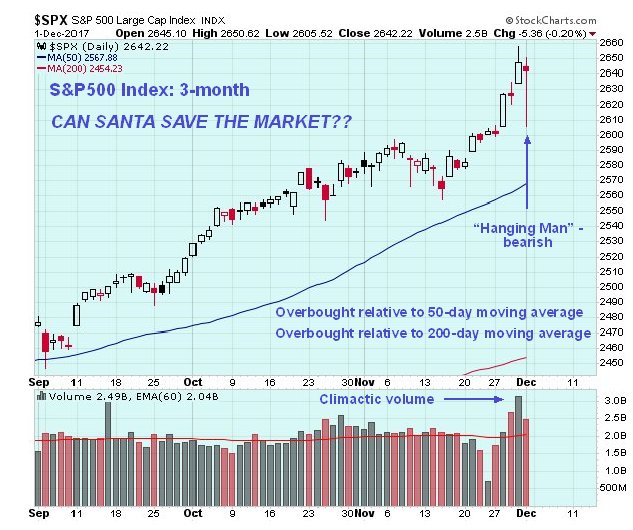
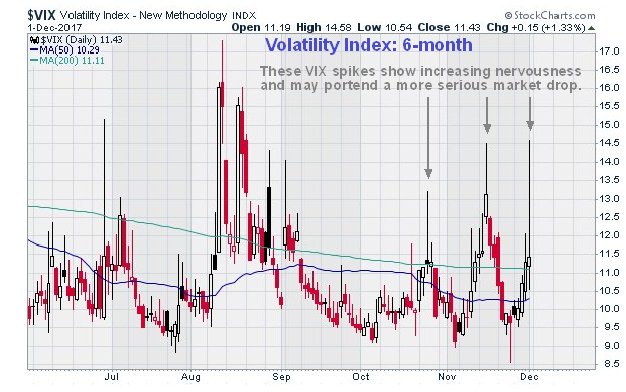
That big intraday swing also caused the third big VIX spike in as many months on Friday, also a sign of growing nervousness in the markets. While it is widely assumed that Santa will do his thing and bring good cheer to the markets as he does most years, this year he might imbibe a little too much mead or sherry and not be in a fit state to come to the markets’ rescue. It is therefore advised to pull in stops tighter than usual and perhaps do some Puts – we will be looking at some on the site. Fundamentally this might relate to the Neocons moving closer to their objective of bringing down Trump, since the markets might drop hard in the face of the crisis that would result.
The successful use of charts as demonstrated in this review depends above all on common sense, experience and a sense of proportion, in this game formal qualifications count for nothing. In this sense at least the market is a level playing field in that it doesn’t care if you are the Prince of Monaco or a taxi driver – if you get it right you win, if you don’t you lose. The reason why so many highly qualified people, especially those with PHDs, fall on their faces trading markets is that they arrive on the scene with a superiority complex and the market quickly cuts them down to size.
I have done a considerable amount of work preparing this report, so now I am going to ask you to do just a little, although I understand that this may be asking a bit much of a “Millennial”. Get a pen and do a back of the envelope calculation, or use a tablet, and ask yourself how many of these trades you would need to pull off to cover a subscription to clivemaund.com and then how many you would have to do to have a positive impact on your life. When you have done the Math, I look forward to welcoming you as a subscriber.
here is no absurdity so palpable but that it may be firmly planted in the human head if you only begin to inculcate it before the age of five, by constantly repeating it with an air of great solemnity. Arthur Schopenhauer
Gold bottomed in 2002, and it took nine years for its trade to a high of roughly $1900 (September 2011). Contrast that to Bitcoin, in less than 1/3rd of the amount of time it is showing gains of more than 11,000%. It took nine years for Gold to show gains of roughly 700% and Gold has given up a substantial portion of those gains.

We bailed out of Gold in 2011 for two reasons:
-
Gold was trading in the extremely overbought ranges, and the Gold Bug Camp could not contain their glee; they thought the sky was the limit. Instead, they found out that the Ground was a lot closer.
-
The masses were not embracing Gold, and they refused to treat or view it as a currency.
Only those from the hard money camp continued to believe that Gold was a currency, but sadly their numbers are dwindling with the passage of each day. The masses view Bitcoin as cool and secure; a feat Gold has struggled to achieve and is not likely to achieve in the foreseeable future. Whether this is true or not, hardly matters for when it comes to investing, perceptions are all that matter.
Does this mean the precious metals sector is dead?
Well, that depends on what one means by dead. Gold has performed abysmally since (it topped out) 2011. The money supply soared, and Gold tanked, not exactly a good sign. In doing the opposite of what was expected from it, Gold cemented the view that it was an ancient relic that has no place in today’s monetary system. We are speaking in terms of Mass Perception. What we think, matters not; we follow trends, and we don’t waste time trying to look at things from a personal vantage point. There are many reasons for Gold’s underperformance after 2011; one of them was the “velocity of the money supply” which all but stalled after 2011. However, the masses don’t waste time on details like this. They look for simple cause and effect answers. Money supply soared, Gold did nothing, and hence Gold is a waste of time. A bit simplistic but that’s the mass mindset for you. However, looking forward some factors could limit Gold’s lustre
Demand for Gold in India continues to drop
India’s gold consumption is likely to drop to its lowest in eight years in 2017, hit by government moves to make bullion trading more transparent and by faltering demand from some rural areas, the World Gold Council (WGC) said on Thursday.
Evidence of weaker appetite in a country where gold is used in everything from investment to wedding gifts could drag on global prices that have been hovering near their highest in three weeks. India is the word’s No 2 consumer of gold behind China. Full Story
The Dollar appears to be putting in a base

The dollar topped in early 2017 and what did Gold do? Absolutely nothing; take a look at the chart below. Instead of surging to new highs it could not even trade past its July 2016 highs. The dollar, in contrast, has been going through a well deserved period of consolidation after mounting a stunning rally that started in 2011. It tested support and held, and as long as it does not close below 90 on a monthly basis, the outlook will remain bullish. Consequently, a monthly close above 94.50 will open the possibility for a test of the old highs.

The dollar topped in Jan of 2017 as mentioned above but if one looked at the chart of Gold only, one would think that the dollar hardly pulled back. The reaction was boring, to say the least, and to make matters worse; Gold put in a lower high than it did in July of 2016, even though the dollar traded below its 2016 lows.
Gold has also been putting a series of lows since 2013, and during this period it has not managed to trade above $1350 for a significant period. A fortress of strength comes into play in the $1350 ranges, and unless it can trade above this level on a monthly basis, the outlook will remain Neutral to bearish.
Conclusion
The dollar is getting ready to mount a rally, demand for Gold is declining, and Gold has been unable to trade past $1350 even in the face of a weaker dollar. Then we have the Bitcoin market, which the masses (especially millennia’s) find to be a lot more exciting and rewarding than Gold. All these factors don’t bode well for Gold. It appears that Gold is likely to test the 1000 ranges unless it decides to diverge and trend upwards in tandem with the dollar. Bitcoin, on the other hand, is now in the feeding frenzy stage, so this market is ripe for a correction. However, the upward move is still not over. After a hard correction, Bitcoin is likely to resume its upward trend.
Gold will probably never experience a move akin to that of Bitcoin, but that does not mean it won’t make for a good investment one day. For now, the trend is neutral; a weekly close below $1100 will darken the outlook for Gold, but a monthly close above $1350 will indicate that Gold is ready to trend higher.
Word to the wise; never fall in love with any investment. In the end, it’s the trend that you should pay attention to, for no sector can trend upwards forever. The odds of the Dow trading to 29,000 are far better than of Gold trading to $1900.
Iteration, like friction, is likely to generate heat instead of progress.
George Eliot

 QUESTION: You have said that the future will be cryptocurrencies. The Bank of Canada has come out and acknowledged what you have been saying that such private issue challenges the government’s profit structure. Do you think electronic money will be viable sooner or later down the road?
PG
ANSWER: Electronic currency is ALREADY the bulk of the money supply. When you deposit $100 in a bank, it lends out $90 from your deposit and your bank statement still reflects you have $100. However, the person who borrowed the money now has $90 in their account. The government did not “print” money to cover that extra $90, rather they just created “electronic” money.
So what is the big thing about cryptocurrencies? The idea is that it is money that will not depreciate and is strangely not “fiat.” Yet, it is no different than the electronic money created by the bank, which is also outside the strict domain of government.
If you just look at the price of Bitcoin, it demonstrates that this is merely a speculative boom indistinguishable from the Dot.COM Bubble, which also reflected a new era in technology. If Bitcoin was truly an alternative currency that was supposed to retain its value, the mere fact that the rice has soared like any stock proves that it is by no means a “store of wealth” that somehow is better than currency in which it must still be converted to use in the bulk of the economy.
If the power grid failed, everyone would be broke. You could not even buy food. Society would revert immediately back to barter. There are risks to any form of electronic money be it a bank or crypto. The government WILL move toward cryptocurrencies THAT THEY WILL CONTROL, not the private sector. I have stated before, they argue electronic money eliminates cash crime from bank robberies, drugs, prostitution, etc., but it introduces more sophisticated hacking computer crimes.
The crime issue is the excuse, but the real issue remains the hunt for taxes. I have to wonder if the government is not behind this entire cryptocurrency phenomenon. Satoshi Nakamoto is the name assigned to this mysterious unknown person or people who designed Bitcoin and created its original reference implementation. Nobody knows who invented this technology. It is entirely possible that this movement is a false flag created by the government to move society to accept the end of tangible money. It is very strange that the person who invented this technology is unknown and has not stepped forward to demand some royalty.
…also from Martin:

-
I know Mike is a very solid investor and respect his opinions very much. So if he says pay attention to this or that - I will.
~ Dale G.
-
I've started managing my own investments so view Michael's site as a one-stop shop from which to get information and perspectives.
~ Dave E.
-
Michael offers easy reading, honest, common sense information that anyone can use in a practical manner.
~ der_al.
-
A sane voice in a scrambled investment world.
~ Ed R.
Inside Edge Pro Contributors

Greg Weldon

Josef Schachter

Tyler Bollhorn

Ryan Irvine

Paul Beattie

Martin Straith

Patrick Ceresna

Mark Leibovit

James Thorne

Victor Adair