
Gold & Precious Metals

- Mark Liebovit’s top recommendation at last year’s World Outlook Financial Conference was Bitcoin Trust @$110 – trades today @ $928 – up 743%
- Jim Dines recommended Canopy Growth @ $13 – trades today @ $19 – up 46%
- James Thorne shockingly recommended Bombardier @ $2.00 – trades today @$3.02 – up 51%
- Ryan Irvine recommended International Road Dynamics @ $2.50 – taken over 3 months later at $4.25 – up 70%
Those are great results but that’s the whole point of inviting some of the top analysts in the English speaking world to the World Outlook Financial Conference for the past 29 years. Obviously past performance is not a guarantee of future success but the results we have achieved over the years have not been by accident. Our analysts have been chosen precisely because they have strong track records.
No, they are not right every time, but their uncanny ability to read the various investment markets while employing proven risk management techniques has clearly raised their probability of success dramatically. Whether you’re interested in stocks, gold, oil, real estate, interest rates or currencies – we bring in the top analysts to the World Outlook Financial Conference to cover them all.
It’s an incredible line-up for Feb 2nd & 3rd, 2018. Martin Armstrong has been called the highest paid financial advisor on the planet. Heck, I’ve called him the top economic forecaster in the world. Let me give you just a couple of examples. At the Outlook in 2013 he correctly predicted the date of the Russian invasion of Ukraine and the accompanying massive outflow of capital that would push the US dollar and stocks higher. More importantly he clearly predicted the rise of the Dow Jones Index through 18,000 and told the audience to buy every dip because the next stop was 23,700. We came within a quarter of a percent of his target this month so I can’t wait to hear what he has to say now.
Mark Leibovit will also be at the 2018 Outlook. Mark has been Timer’s Digest Timer of the Year, Gold Market Timer of the Year and Long Term Timer of the year. While he’s been great in all those areas – my favourite of his forecasts came at the 2014 Conference where he told us to start to invest in marijuana stocks starting with GW Pharmaceuticals at $67. Mark has repeated his recommendation of the marijuana industry every year. I think it’s safe to say that was a good call but I’ll be interested in what he has to say this year as the industry and the stocks become more mainstream.
I won’t go through all the 2018 speakers right now (they’re available HERE) but let me give you just one more example of the quality of analyst featured at the World Outlook Conference. Keystone Financial’s Ryan Irvine has been producing a World Outlook Small Cap Portfolio for the past 8 years – and as I said past performance is no guarantee of future success but I like my chances. The Small Cap Portfolio has returned double digits every single year – no exceptions.
Obviously I want to hear Ryan’s picks at this year’s conference. I’m worried it will cost me too much money if I don’t!
What Will Happen in 2018
The easiest prediction is that the rate of change will continue to increase, which will produce big price swings in a variety of investments.
Goldman Sachs just predicted four more interest rate hikes in the States in 2018. If they’re right, it will have a huge impact on the US dollar. The loonie will go down as a result unless the Bank of Canada raises our rates with them. And if they do what will be the impact on real estate and Canadian stocks?
Currency moves are going to provide a huge opportunity for those who position themselves properly. I’m pleased to say that the currency recommendations at the Outlook Conference have made a lot of people money but I think 2018 will be an even bigger year.
I continue to be most worried about the government bond market. If rates rise, bonds will certainly go down, which is why I’ve been telling people to get rid of government bonds with maturities of 3 years and longer. At the 2018 Outlook we’ll talk a lot more about the vulnerability of government bonds.
The Pension crisis in Europe and the States will also be a big story in 2018 with major financial implications, as well as social and political ones. We’ll talk more about how to position yourself to both protect and profit from the pension problems.
The Bottom Line
The level of volatility and the violence of the moves in all markets necessitates taking advantage of the best possible research and analysis available. While financial programs and conferences often feature cheerleaders for a variety of products or industries, we focus on top flight independent analysis. The bottom line is that I am confident that our analysts can make you back the price of admission many times over.
Periods of historic change provide incredible opportunities and incredible danger.
At the 2018 World Outlook Financial Conference and on MoneyTalks, I’m trying to help you avoid the danger and take advantage of the opportunities.
I hope to see you there.
Sincerely
Mike
PS – The 2018 World Outlook Conference is Friday night Feb 2nd and Saturday Feb 3rd at the Westin Bayshore in Vancouver. For tickets and other details go to www.moneytalks.net and click on the events button.


Market participants are often heard saying things like “you can’t trade Gold on fundamentals.” With no cash flows to discount, Gold is a different animal than stocks or bonds. It is said to swing higher and lower due to changes in investor sentiment alone. Many a trader will advise you to simply follow the trend:
- When Gold is in an uptrend, own Gold.
- When Gold is in a downtrend, go to cash.
Going back to 1975 (when Gold futures began trading), how would such a strategy have fared?
At first glance, pretty good. Owning Gold when it closed above its 200-day moving average and moving to cash when it closed below it would have resulted in a higher return (5.1% vs. 4.6%) with lower volatility (16.5% vs. 20.0%) than buy-and-hold.

The maximum drawdown: 51% for trend following versus -69.6% for buy-and-hold.

Case closed, trend following wins?
Not so fast. We have yet to include the transaction costs that exist in the real world. The trend following strategy would have traded around 3.75 times per year going back to 1975. At a cost below 0.14% per trade, trend following still beats buy-and-hold. At anything above 0.14%, trend following underperforms.
 \
\
While 0.14% may seem somewhat high in today’s world, for a long time it would have been deemed quite cheap (see chart below). It’s likely that the average transaction cost (slippage and commission) since 1975 was well above 0.14%. Which means it would have been difficult for trend following to beat a buy-and-hold strategy in practice.

Source: A Century of Stock Market Liquidity and Trading Costs, Jones (2002)
Does that mean trend following in Gold “doesn’t work”? It depends on what your definition of “work” is. If by “work” you simply mean a higher return, then that might be be an accurate assessment (if we include transaction costs). But looking back at history, the real value in trend following is not on the return side of the equation, but on the risk side. (Note: we showed something similar in our research paper on moving averages and leverage in the equity market).
As evidence of this, trend following produced a higher return in all of the worst years for Gold. This is what leads to the lower volatility/drawdown profile, as you are cutting your losses after a break of the 200-day moving average that continues lower.

The trade-off, beyond higher transaction costs? Missing out on upside during strong periods (ex: 2002 – 2012) and being whipsawed in choppy, sideways markets (ex: 1990, 2014, 2017). Overall, the trend following strategy would have outperformed in only 35% of years since 1975 (ignoring transaction costs). This includes a long stretch from 1998 through 2009 where a simple buy-and-hold of Gold outperformed a trend-following strategy in every year except one (2002, when they were tied).

What should a trader/investor take away from all of this?
Markets are hard. The notion that simply “following the trend” in Gold will lead to vast riches is a false one. It would have been far from easy for someone to stick with such a trend following strategy over time (many, many periods of underperformance) and far from conclusive that doing so would have been superior than buy-and-hold (if we include transaction costs). And while most traders talk of trend following in terms of capturing profits from strong upward moves, the real value in trend following is just the opposite: in avoiding strong downward moves that continue lower for a period of time.
So while the saying “you can’t trade gold on fundamentals” may be true, that doesn’t mean trading it on technicals is any easier.
***
Related Posts:
To sign up for our free newsletter, click here.
This writing is for informational purposes only and does not constitute an offer to sell, a solicitation to buy, or a recommendation regarding any securities transaction, or as an offer to provide advisory or other services by Pension Partners, LLC in any jurisdiction in which such offer, solicitation, purchase or sale would be unlawful under the securities laws of such jurisdiction. The information contained in this writing should not be construed as financial or investment advice on any subject matter. Pension Partners, LLC expressly disclaims all liability in respect to actions taken based on any or all of the information on this writing.
CHARLIE BILELLO, CMT

While politicians hammer out the details it is generally accepted that corporations and by extension the investor and asset owner classes are targeted for benefits under the coming Republican tax plan. The logical implication of that beneficial treatment is that barring a market meltdown in the interim, people looking to unload stock positions and take profits would tend to wait until January in hopes of gaining the 2018 tax benefit vs. 2017’s tax code.
Among the under performing sectors subject to tax loss selling in late 2017 I have selected the gold miners for this post because they tend to be counter-cyclical and “in the mirror” to the broad risk ‘on’ asset party currently ongoing. We have noted again and again that with the asset party in full swing the miners’ fundamentals cannot possibly look good, and at face value they don’t. Sector fundamentals like gold/oil and gold/materials ratios are not good and macro fundamentals like gold vs. stock markets, the economy (which is relatively strong) and the yield curve are not at all supportive either… as they currently stand.
In a perfect world stock market-to-gold ratios, long-term interest rates and the yield curve would work together to signal a time of change for the macro. The red shaded areas show a logical limit for stocks vs. gold, the 100 month exponential moving average has limited 30 year yields for decades and the yield curve is on the same message, heading toward but not yet to a logical limit.

Below is the current status of just one of the macro fundamentals we track, the 10yr-2yr yield curve. The reference to “Op Twist by another name & method” has to do with the curve flattening implications highlighted in this post on Nov. 20. The bond market manipulators led by Ben Bernanke announced an operation to buy long-term debt and sell short-term debt in 2011 with the expressed objective of sanitizing inflationary signals. Well boyz, job well done. The Goldilocks boom particularly, kicked in with the Semiconductor Equipment cycle that we first noted in early 2013.
I have no idea whether they actually named the new scheme, but if Treasury follows through on it they will be trying to continue pressuring the curve to flattening; in other words, trying to keep the good times going… because that is what politicians do and I have little doubt that Sec. Mnuchin is more politician than financial guy. This political guy has announced that he plans to issue more short-term bonds and less long-term bonds in order to rig the yield curve further as the Fed unwinds QE. Of course he is a buttoned down man of great wealth and good taste. He would never use the word “rig”… publicly. That is my word. Again, per the WSJ…
The Treasury’s new approach will shift some of that upward pressure on yields to shorter-term debt and away from longer-term debt.
In other words, the goals of the new operation are similar to Twist. The former rammed the macro into boom times and the latter would seek to keep it going. As noted in the post linked above, it seems pretty desperate. If things are so good, why continue flexing the manipulative arms of policy and government? Bueller? Anyone?

So the market can be manipulated but ultimately it will have its way. One wonders about the efficacy of a scheme overlaid on top of an already mature scheme of similar aims. Playing it straight here, the yield curve is, like stock to gold ratios, on its way but not to logical limitations. So for now, it’s party on Garth!
The job of a market manager is to manage the present as unemotionally as possible while looking ahead with sensible plans based on incoming and historical market data. The yield curve has been impulsively flattening, which is indicative of a boom or risk ‘on’ phase and an impairment of the fundamentals for gold and the gold stock sector. It’s just the way it is right now folks.
But what about next month or especially the month after that… or February? We have been cross referencing the above indicators and now can add in a fiscally imposed indicator as well in the form of beneficial changes to the tax code, for the wealthy, the investor class and corporate interests, at least. The stock market bull is going to be rudely interrupted at some point and the question is, at what point? Enter the indicators.
I believe the bull market will probably not end until the next deflationary u-turn, possibly at the 30yr yield limiter around 3.3%, stocks fully retraced vs. gold and the yield curve either inverted, flat or around the trend line noted above. The timing of those conditions can extend indefinitely since they are all big picture markers.
But on the short-term, an overbought stock market that has teased the bears with every little short-term twitch that resolves bullish may at least see the party interrupted if newly tax-unburdened players decide to unload early in the new year. Going the other way, the gold sector, current poor fundamentals and all, has three things potentially going for it…
- We are in the jaws of tax loss selling season for this under performing sector, and…
- The seasonal aspect for gold and the miners is constructive for a December or January secondary low, and…
- By definition, any interruption in the risk ‘on’ markets bull phase would favor risk ‘off’ gold and its counter-cyclical miners. US and many global markets are overbought and the US at least, has a new tax benefit wrinkle in the mix.
Let’s end with a look at the seasonal setup in gold and the miners as tax loss selling season progresses and tax gain selling season approaches. Gold’s 40 year seasonal average (Source: mrci.com) shows a corrective low in October/November ( ) and secondary lows in December and January. A literal interpretation (not recommended, but it is a frame of reference) is for strength from mid-December through January. Given the status of gold’s Commitments of Traders, it would be best to keep the bullish view restrained beyond January.

HUI checks in with a view of the 2014 and 2015 bear market years along with what may have been the first year of a new bull market, 2016. In all three cases the index bottomed in either November, December or January (also, let’s not forget 2017’s rally into mid-February). In the case of 2014’s November low, after a bottom retest in December a good rally followed into mid-March. In 2015 HUI bottomed in November, went sideways and had a surge in January. Those were bear market rallies and so, were limited after the seasonal played out.
2016, which I believe may have been the bear market low, bottomed in January and then impulsively worked its way upward until the over-hyped sector fell apart as its fundamentals degraded (in this post we used the gold/oil ratio as just one example).

Now, lest the above appear to be cherry picking of years, let’s expand HUI’s seasonal to 2008, so that we can smooth it out to include both bull and bear cycles. As you can see January and February have been the most bullish months with gains of 3.9% and 4.8%, respectively.

Bottom Line
A combination of a fiscal policy event (tax reform) and seasonal aspects could set up counter trend moves in the risk ‘on’ stock market and the much more risk ‘off’ gold sector. Noting the larger trends, if this comes about it could just be a counter trend move in the still bullish stock market and still bearish gold sector. It will depend on when the big macro signals register (they move oh so slowly).
My current tack is to remain balanced within stock market segments with some counterweight positions in quality gold stocks. Tax selling season is still in effect, so there could be some volatility near-term but there seems a pretty good potential of a shakeout of recent trends as we move into 2018. NFTRH will be charting the best gold stocks (per my view and especially per the views of trusted associates/fundamental sources) more intensively now, along with our ongoing regular coverage of broad markets and stocks. Consider an affordable membership ahead of time, rather than after the fact as we prepare for coming events.
By Gary Tanashian from Notes From The Rabbit Hole

Leverage, American Style
Against the Crowd
Liquidity Lost
Mobbing the Exits
Home for Christmas, then Hong Kong
“Life invests itself with inevitable conditions, which the unwise seek to dodge, which one and another brags that he does not know, that they do not touch him; but the brag is on his lips, the conditions are in his soul. If he escapes them in one part they attack him in another more vital part. If he has escaped them in form and in the appearance, it is because he has resisted his life and fled from himself, and the retribution is so much death.”
– Ralph Waldo Emerson, “Compensation”
Bonfires are fun to watch, but they eventually burn out. Human folly apparently doesn’t, so we just keep adding to the absurdities. The volume of daily economic lunacy that lights up my various devices is truly stunning, and it seems to be increasing. I shared a little of it with you in last week’s “Bonfire of the Absurdities.” Since it’s a holiday weekend and I was traveling all week, today I’ll just give you a few more absurdities to ponder. And this shorter letter will lighten your weekend reading load.

First, let me thank everyone who took my advice to register early for my next Strategic Investment Conference, March 6–9, 2018, in San Diego. Hundreds of you are now confirmed to attend. I know many more intend to do so. Sadly, we can’t accommodate an unlimited number of you. I can’t say when we will reach capacity, but I hope it is soon. I am in negotiations right now with a very familiar name whose economic views are, shall we say, different from mine. Our idea is to debate those differences in front of an audience. Fireworks will likely ensue. But, to get this to happen, I need some numbers to line up. You can help by registering for the conference now. Click here for more information.
Now, on with the absurdities.
When I asked my “kitchen cabinet” of friends for instances of the absurd, Grant Williams sent a monumental slide deck. I guess I should have expected that, as the absurd is one of his specialties. My computer almost melted trying to download the deck, but it finally finished and was worth the wait. Here is just one example of craziness.
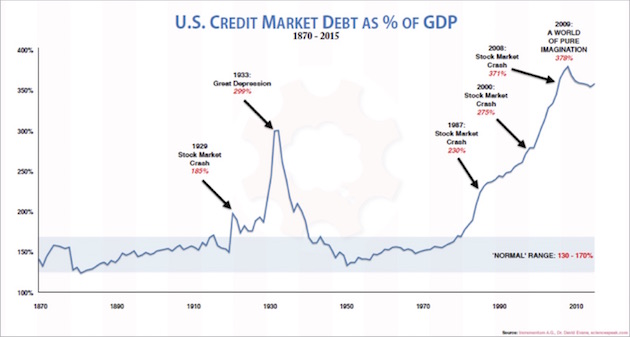
This chart is straightforward: It’s outstanding credit as a percentage of GDP. Broadly speaking, this is a measure of how leveraged the US economy is. It was in a sedate 130%–170% range as the economy industrialized in the late 19th and early 20th centuries. It popped higher in the 1920s and 1930s before settling down again. Then came the 1980s. Credit jumped above 200% of GDP and has never looked back. It climbed steadily until 2009 and now hovers over 350%.
Absurd doesn’t do this situation justice. We are mind-bogglingly leveraged. And consider what the chart doesn’t show. Many individuals and businesses carry no debt at all, or certainly less than 350% leverage. That means many others must be leveraged far higher.
Now, the usual economic pundits tell us that the situation is safe and under control and that we all have plenty of cash and cash flow to be able to handle this load of debt. Worrying about debt is so 1900s, they say. And they may have a point, in that many of us are able to use debt in responsible ways. But how about that $1.2 trillion in student debt?
While lending has been a very lucrative business in recent decades, it’s hard to believe it can last. At some point we must experience a great deleveraging. When that happens, it won’t be fun.
“Contrarian” investors believe success lies in going against the crowd, because the crowd is usually wrong. That is often a very good assumption. My own experience suggests one small adjustment: Pay attention not to what the crowd says but to what it does. Words are cheap.
This next chart is a prime example. We see here the amount of cash held by Merrill Lynch clients from 2005 to the present, as a percentage of their assets. The average is about 13%.
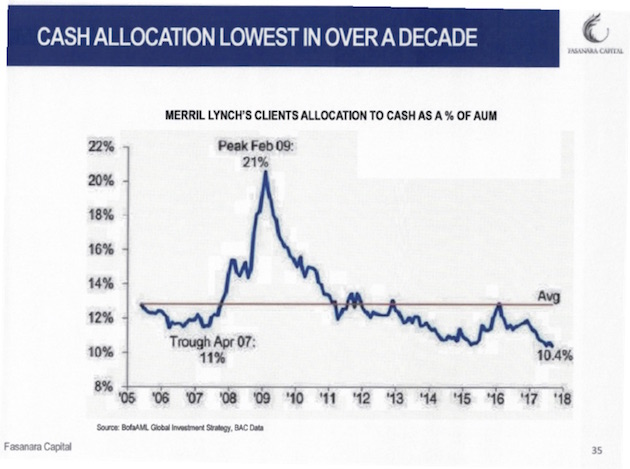
Of course, people hold cash for all kinds of reasons that don’t necessarily reflect their market outlook. Nor does this chart tell us how their non-cash assets were allocated. The pattern is nevertheless uncanny. In 2007, as stock indexes reached their peak, cash holdings were well below average. They rose quickly as the crisis unfolded, peaking almost exactly with the market low in early 2009.
In other words, at the very time when it would have been best to reduce cash and buy equities, Merrill Lynch clients did the opposite. And when they should have been raising cash, they kept their holdings low. I don’t think this pattern is unique to Merrill Lynch’s clients; I suspect we would see the same at most retail brokerages. Market timing is hard for everyone.
The disturbing part is where the chart ends. Merrill Lynch client cash allocations are now even lower than they were at that 2007 trough. Interest rates are much lower, too, so maybe that’s not surprising. Central banks spent the last decade all but forcing investors to buy risk assets and shun cash. This data suggests it worked. But whatever the reason, investor cash levels suggest that caution is quite unpopular right now. So if you consider yourself a contrarian, maybe it’s time to raise some cash.
Michael Lewitt’s latest letter came in this morning. He began with the marvelous Ralph Waldo Emerson quote that I used at the beginning of this letter, and then he helpfully contributed this list of absurdities:
Anyone questioning whether financial markets are in a bubble should consider what we witnessed in 2017:
• A painting (which may be fake) sold for $450 million.
• Bitcoin (which may be worthless) soared nearly 700% from $952 to ~$8000.
• The Bank of Japan and the European Central Bank bought $2 trillion of assets.
• Global debt rose above $225 trillion to more than 324% of global GDP.
• US corporations sold a record $1.75 trillion in bonds.
• European high-yield bonds traded at a yield under 2%.
• Argentina, a serial defaulter, sold 100-year bonds in an oversubscribed offer.
• Illinois, hopelessly insolvent, sold 3.75% bonds to bondholders fighting for allocations.
• Global stock market capitalization skyrocketed by $15 trillion to over $85 trillion and a record 113% of global GDP.
• The market cap of the FANGs increased by more than $1 trillion.
• S&P 500 volatility dropped to 50-year lows and Treasury volatility to 30-year lows.
• Money-losing Tesla Inc. sold 5% bonds with no covenants as it burned $4+ billion in cash and produced very few cars.
This is a joyless bubble, however. It is accompanied by political divisiveness and social turmoil as the mainstream media hectors the populace with fake news. Immoral behavior that was tolerated for years is finally called to account while a few brave journalists fight against establishment forces to reveal deep corruption at the core of our government (yes, I am speaking of Uranium One and the Obama Justice Department). In 2018, a lot of chickens are going to come home to roost in Washington, D.C., on Wall Street, and in the media centers of New York City and Los Angeles. Icons will be blasted into dust as the tides of cheap money, cronyism, complicity, and stupidity recede. Beware entities with too much debt, too much secrecy, too much hype. Beware false idols. Every bubble destroys its idols, and so shall this one.
The next absurdity is absurd because it is so obvious, yet many don’t want to see it. Too bad, because I’m going to make you look. This comes from Michael Lebowitz of 720 Global. It’s the S&P 500 Index overlaid with the Federal Reserve’s balance sheet and the forecast of where the Federal Reserve intends to take its balance sheet.
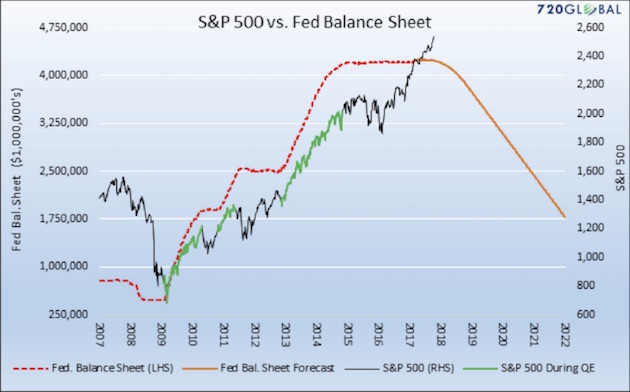
As I noted above, the Fed and other central banks have practically forced investors into risk assets since 2008. You can see the relationship very clearly in this chart. The green segments of the S&P 500’s rise occurred during quantitative easing programs. Correlation isn’t causation, but I think we can safely draw some connections here.
Ample low-cost liquidity drives asset prices higher. That’s not controversial. It makes perfect sense that the withdrawal of ample low-cost liquidity would also impact asset prices in the opposite direction.
The Fed has even given us a schedule by which it will unwind its balance sheet. Michael’s chart gives us a sense of how far the S&P 500 could drop if the Fed unwinds as planned and if the relationship between liquidity and stock prices persists. Either or both of those could change; but if they don’t, the S&P 500 could fall 50% in the next few years.
At the risk of repeating myself, I think it is borderline dysfunctional for the Fed to be raising interest rates and at the same time experimenting with reducing its balance sheet. Where’s the fire? Seriously, we waited for four years, deep into the recovery, before the Fed found enough intestinal fortitude to begin to timidly raise rates. And now they think they have to proceed at warp speed? I just don’t see this ending well.
What would be really absurd, I submit, would be to see this data and then somehow convince yourself that stock prices can keep climbing or even merely hold steady as the prime mover that drove them higher moves in the opposite direction.
Another peculiar wrinkle in the situation today is that many investors see all these warning signs but think they can keep riding the market higher and hedge against losses at the same time. It doesn’t really work that way. However, it’s easy to see why people think they can get away with it. Wall Street firms have rolled out all kinds of volatility-linked products that purport to protect you from sudden downside events.
In various ways, most of these products are linked to the Volatility Index, or VIX. Volatility has been persistently low as the market has risen in recent years. That has made it cheap to buy protection against a volatility spike. However, it’s not clear if the sellers of this protection will be able to deliver as promised.
My friend Doug Kass has been concerned about this for some time. He believes the risks of a “flash crash” are rising, and those who think they are hedged may learn that they are not. He shared this Morgan Stanley graphic of how many VIX futures contracts would have to be bought to cover a one-day market drop.
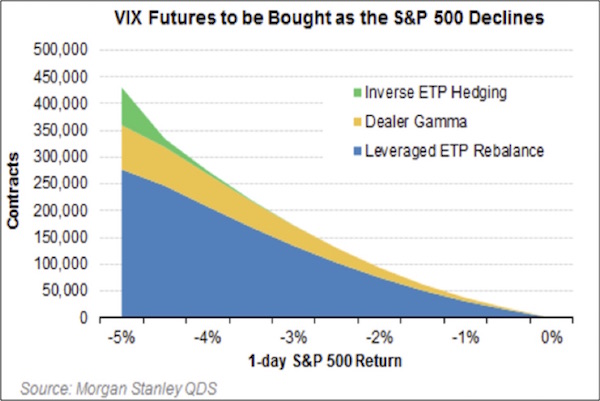
Between hedgers, dealers, and ETP sponsors, a one-day 5% downward spike in the S&P 500 would force the purchase of over 400,000 VIX futures contracts. This was in October, and the figure has probably risen more since then. Doug isn’t sure a market under that kind of stress can deliver that much liquidity.
Every market downturn seems to expose the vacuity of some new, sophisticated hedging product. In 1987 it was “portfolio insurance.” Whatever the particulars, the schemes all purport to let investors ride the market higher without taking on meaningful downside risk. That is not how hedging works. I suspect the various VIX-linked products will disappoint buyers when the unwind occurs.
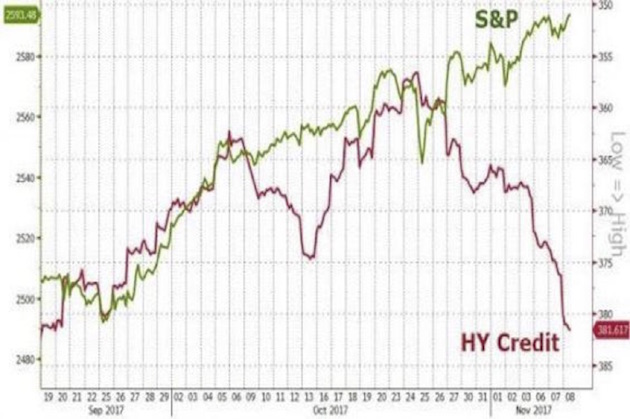
Doug also shared what will be the final graph for this week and observed, “This is the dreaded alligator formation, and the jaws always close.” It’s just a matter of time. It could take another year and get even sillier, but when that gator snaps its jaws shut, a lot of people will get bitten. I personally think the bubble in high-yield debt, accompanied by so much covenant-lite offerings, will be the source of the next true liquidity crisis.
The amount of money available to market makers to use to maintain some type of order in a falling high-yield market is absurdly low. Investors in high-yield mutual funds and ETFs think they have liquidity, but the managers of those funds will be forced to sell into a market where there is no price and there are no bids. Oh, the bids will show up at 50% discounts. Distressed-debt funds and vulture capital will see opportunities, and they will be there. Talk about blood in the streets.
And with this list of fun topics on Thanksgiving weekend, I will leave you to your ruminations.
Home for Christmas, then Hong Kong
Other than a brief trip here and there – and who knows what will slip into the schedule – I will be home for most of December. This Thursday Shane and I fly to Tulsa to see my newest granddaughter, Brinlee Porter, who will be brought into the world by her mother Amanda on Tuesday. Amanda’s sister Abigail and another granddaughter are staying with us this weekend and will return to Tulsa tomorrow.
Shane and I will be in Hong Kong for the Bank of America Merrill Lynch conference in early January. That trip will be made even more fun because Lacy Hunt and his wife JK will be there with us. We are going to take an extra day or two and be tourists. I’ve been to Hong Kong many times but have never really gotten out of the business district. Well, Louis Gave did pick me up in his old-fashioned Chinese junk and took me around to the other side of the island to the yacht club, where we had dinner. The water got a little choppy, and I got a little seasick, so I was grateful for the car ride back. But it was really quite a beautiful outing. I very much like Hong Kong.
One of the things that I will be doing in Hong Kong is getting some new dress shirts. My workouts the past year or so have focused a lot more on my shoulders and shrugs, and I have actually added a full inch to my neck size. I have literally only one shirt that I can (barely) button to be able to wear a tie with. I have been waiting for the Hong Kong trip, because you can get a custom shirt made in just a few days, remarkably cheaply. I’m not sure that will mean I’ll be wearing more ties, but at least I will be able to do so comfortably when the need arises.
Lugano, Switzerland, was beautiful. We were with my associate Tony Courtney, and he drove us to the Lake Como area for lunch on Sunday, negotiating all the switchback roads to the accompaniment of his playlist of James Bond movie tunes, which, while appropriate, also affected his driving style. I was glad when we got to the restaurant and could sit still and breathe deeply. But it was fun. And the weather was marvelous.
I spoke to a number of Swiss money managers and family offices while I was at the conference, and I can tell you there was not a sense of complacency. They were all very nervous and not quite sure what to do – not unlike many of my readers. We took an informal poll, and a majority of the attendees felt that the Swiss National Bank’s balance sheet would top $1 trillion in less than a year. They are goosing it in order to keep a lid on the Swiss franc. Interestingly, 65% of the attendees felt that the SNB should not be buying US equities (it now owns more than 3% of Apple, for instance); and while this audience earns their keep by managing money for mostly non-Swiss clients, they were all concerned about the continued strength of the Swiss currency and wondering how long it can remain so strong.
Still, one way or another, we will all Muddle Through. And as I hit the send button, I am noticing one of the anomalies of my life in a high-rise in what is essentially downtown Dallas (although technically the locals call it Uptown). The high-rise apartment building some 100 yards away from me has a pair of nesting red-winged hawks that have lived there for the last two or three years. The male actually landed on my balcony once, and I’ve often thought about putting out some meat to see if I could attract him back, as seeing him up close is magnificent. The weather is perfect, and I see as I glance out that the pair are doing an aerial dance. I think I’ll walk out on the balcony with a book and just watch. You have a great week!
Your enjoying the little things in life analyst,

John Mauldin
subscribers@MauldinEconomics.com
Copyright 2017 John Mauldin. All Rights Reserved.

-
I know Mike is a very solid investor and respect his opinions very much. So if he says pay attention to this or that - I will.
~ Dale G.
-
I've started managing my own investments so view Michael's site as a one-stop shop from which to get information and perspectives.
~ Dave E.
-
Michael offers easy reading, honest, common sense information that anyone can use in a practical manner.
~ der_al.
-
A sane voice in a scrambled investment world.
~ Ed R.
Inside Edge Pro Contributors

Greg Weldon

Josef Schachter

Tyler Bollhorn

Ryan Irvine

Paul Beattie

Martin Straith

Patrick Ceresna

Mark Leibovit

James Thorne

Victor Adair