
Timing & trends
…..related: All the Reasons Cryptocurrencies Will Never Replace Gold as Your Financial Hedge
Square, a payment company, is playing around with Bitcoin. In an article on CNBC, we read:
Jack Dorsey’s company is testing support for bitcoin through its Cash payments app.
“We’re exploring how Square can make this experience faster and easier, and have rolled out this feature to a small number of Cash app customers,” a Square spokesperson said via email to CNBC. “We believe cryptocurrency can greatly impact the ability of individuals to participate in the global financial system and we’re excited to learn more here.”
The test does not allow individuals or businesses to send or accept bitcoin, Square said.
Shares of Square spiked more than 5 percent Wednesday to a record high as one Wall Street firm was quick to recommend the stock on this potential development. The stock closed up 2.3 percent at $40.66 a share.
We are always skeptical when we hear something like: “Stock X has rallied because Y.” It is very hard to pinpoint specific reasons behind a given move. We’re not saying that the Bitcoin news was not the reason why Square went up. We’d simply rather say that it is a possibility rather than certainty as it might be gleaned from many media stories. The same goes for the “Bitcoin goes up because of the Square move” story. Wait, does Bitcoin affect Square or does Square affect Bitcoin? Which one is it? Or is it both? You can immediately appreciate the subtlety of any reasonable answer. While the Square story reads well and for precisely this reason is featured heavily in the media, the recent price move might have implications for the Bitcoin market beyond the possible temporary impact of the news.
For now, let’s focus on the charts.
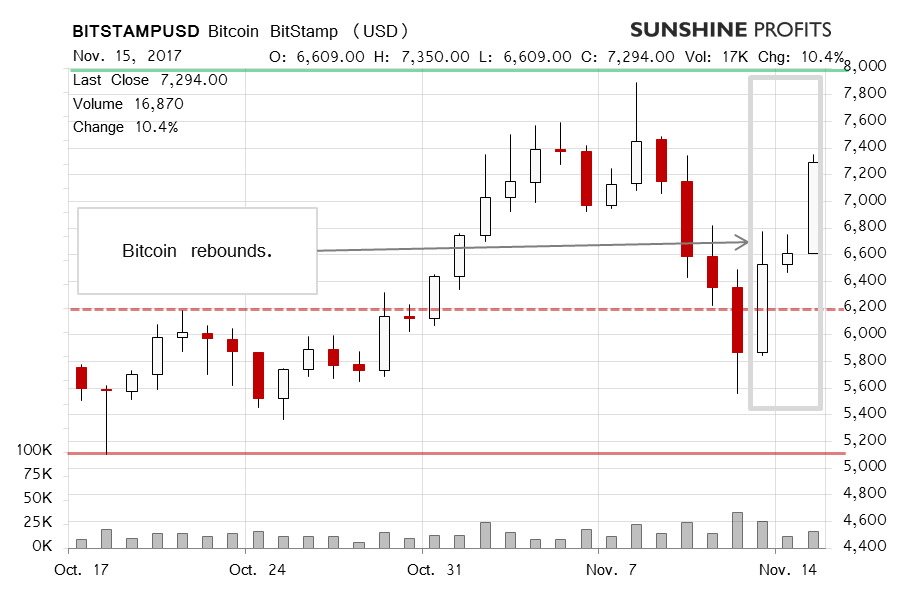
On Bitstamp, we saw very interesting and potentially quite important action as Bitcoin went down hard, and then came back with a vengeance. What might this mean for the Bitcoin market? Recall our recent comments:
The move up was partially reversed with Bitcoin falling steeply to around $5,500 yesterday. Bitcoin went below the 23.6% Fibonacci retracement level ($6,206) before coming back above this level today. This might mean that all the bearish indications have been nullified, particularly since yesterday’s move was completed on significant volume, at least in comparison with what we have seen in the last couple of weeks.
Depending on what move you precisely look at, we can draw several 23.6% Fibonacci retracements. Bitcoin, however, went back above the level we mentioned previously and also above all the 23.6% retracement levels we have considered writing this article. And it did so in a quite visible manner. This means that the situation is now decidedly more bullish than it was only a couple days ago.
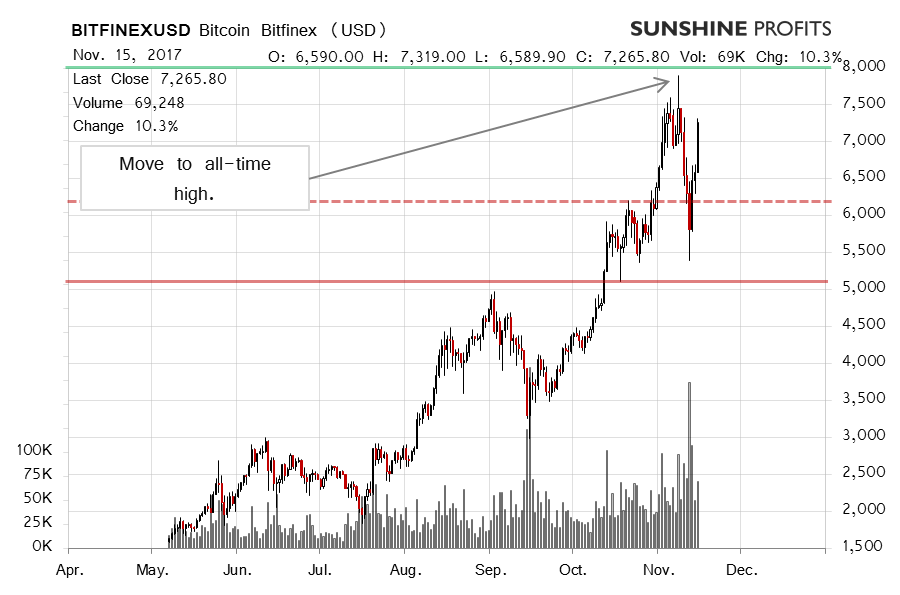
On the long-term Bitfinex chart, we see the recent rebound very clearly. In our previous alert, we wrote:
Right now the situation is very different than what we saw previously. Right now, the situation is one in which we’re right after a very strong move to the downside but with no meaningful breakdowns. In other words, the very recent depreciation is significant in terms of price and volatility but not necessarily when compared to the overall rally back from around $1,000. It seems that a continuation of a move to the upside and a new all-time high might be in the cards. The next day or two might be critical in determining the next possible move.
It turns out that a move up was in the cards and that the recent invalidation of the breakdown below the 23.6% retracement (it almost doesn’t depend on which precise retracement we use). Also, depending on the time horizon, we saw a breakdown below the 38.2% retracement and a rebound. All this is quite important in and of itself. There are at least two additional factors to consider now, both of the bullish. Firstly, Bitcoin is not overbought in terms of the RSI. This might mean that there is still ample room for the currency to go up. Secondly, the recent local bottom was formed on very significant volume, which can be clearly seen on the chart. Combining these facts leaves us with a potentially bullish picture for the short-term, in our opinion.
If you have enjoyed the above analysis and would like to receive free follow-ups, we encourage you to sign up for our daily newsletter – it’s free and if you don’t like it, you can unsubscribe with just 2 clicks. If you sign up today, you’ll also get 7 days of free access to our premium daily Gold & Silver Trading Alerts. Sign up now.
Thank you.
Regards,
Mike McAra
Bitcoin Trading Strategist
Bitcoin Trading Alerts

It’s a good time to take an updated look at oil, because the paradoxes we observed regarding gold and silver, which we looked at in yesterday’s new Gold and Silver Market updates are much more extreme in the case of oil.On the latest 5-year chart for Light Crude we see that oil has in recent weeks succeeding in breaking out of its giant Head-and-Shoulders base pattern at last. We also see that volume has expanded greatly over the past 2 years which is viewed as a sign of a completing bottom. Recent strong upside volume has driven both volume indicators to new highs, despite the price still being way below its 2013 highs – this is viewed as a very bullish sign, and suggests that oil will advance at least to the $80 area.


 1. Interest Rates will Double
by Martin Armstrong
The fall of Byzantium resulting in the financial capital of the world moving to India – not Spain. That is why Columbus set sail trying to get to India, which was the financial capital of the world after Byzantium.
2. RECORDS BEING BROKEN: This Is Exactly The Kind Of Thing The Late, Great Richard Russell Used To Warn His Readers About…
Records Broken At Art & Diamond Auctions! Also MAJOR ALERT: Remarkable Commercial Trading Moves In Silver & Crude Oil!
3. Real Estate: Canada’s 6 Biggest Metros & The Plunge-o-Meter
In October 2017 Toronto metro SFD prices hung on to their recent correction high but after 7 months since the March 2017 spike and peak price, they have lost $206,215 or 17%
Vancouver prices are still defying gravity; FOMO and speculative pricing is still on.
 For the third consecutive year now, I’ve made the trans-continental trek to Martin Armstrong’s World Economic Conference, and each gathering provides new learning on deeper levels. This year’s conference exceeded my expectations for unexpected reasons.
The session content was (in my opinion) deeper and richer and more relevant than the previous two conferences that I had attended…by a longshot. Marty’s instructional sessions were the best I’ve personally witnessed; he was the most focused and calm I’ve seen him, with a real clarity of vision and perspective. I couldn’t do justice to the content even it were mine to share, so I won’t attempt to cover it here, with one exception below. When it becomes available, I recommend buying the video of WEC 2017.
This year’s WEC in Orlando was several levels better in terms of organization, structure and flow. Marty was the keynote speaker that everyone came to see and hear, of course, but there was an expansion of role players who really added depth and texture to both days’ sessions. Mike Campbell tied it all together and kept everything flowing very elegantly by interviewing Marty and moderating a panel discussion. Overall, the sessions were tight and rich.
Over the last couple years, Marty Sr. has gradually added key team players to their organization. Princeton Economics’ CEO Ashley Warren shared more of their corporate vision; Erwin Pletsch shared his insights on interpreting and trading with the Socrates model, and a fine middle-aged fellow (whose name escapes me at this moment) told the story of how he connected with the Armstrong team. He has spearheaded the modernization of the computer source code that Marty risked his life to preserve. Marty Jr. has come into the corporate family…and he seems to complete the executive team.
At every conference there are usually a few bombastic idiots, and the larger the group, usually the higher the number. At this year’s event, I only noticed one such huckster who prognosticated at full volume in the foyer…straight out of a Barnum & Bailey circus movie. He was the exception that proved the rule. Some of the most intelligent and genuine people I’ve ever met are those I’ve met for the first time (or 10th time) at Marty’s conferences. He attracts my favorite kind of people, i.e. kind people. Thanks M and D.
One small piece of Marty’s conference material I feel comfortable sharing is how he emphasized the need to survive our own trading and investment decisions over the next decade. Even with an accurate sense of the big picture, and an uncannily accurate system like Socrates, it’s quite easy to make destructive investment decisions. Time, training & temperament; but the greatest of these is temperament.
The 2016 WEC confirmed for me that we are on the right track in respect of our quest to launch a pooled fund using the Socrates system as the primary information source. In the last year we’ve connected with and engaged experienced young trading specialists who have immersed themselves in the Socrates program, and created a beta-test account which has produced very favorable results. Most importantly, we’ve formed a cohesive team of grounded people – people who genuinely like and care about each other’s well -being, in addition to having complementary skills. We connected with the right people in Orlando, and have followed through on submitting our request. Now we wait.
And while we wait, we continue offering ideas and services that actually help people, like this 30 minute webinar called “The Super RRSP for Private Corporation Shareholders.” Click here for free access…
http://integratedwealthmanagement.ca/super-rrsp-private-corporation-shareholders-archived/
Cheers,
Andrew H. Ruhland, CFP, CIM

 It’s been awhile since I’ve used this terminology. But global markets this week recalled the old “Bubble in Search of a Pin.” It’s too early of course to call an end to the great global financial Bubble. But suddenly, right when everything looked so wonderful, there are indication of “Money” on the Move. And the issues appears to go beyond delays in implementing U.S. corporate tax cuts.
The S&P500 declined only 0.2%, ending eight consecutive weekly gains. But the more dramatic moves were elsewhere. Big European equities rallies reversed abruptly. Germany’s DAX index traded up to an all-time high 13,526 in early Tuesday trading before reversing course and sinking 2.9% to end the week at 13,127. France’s CAC40 index opened Tuesday at the high since January 2008, only to reverse and close the week down 2.5%. Italy’s MIB Index traded as high as 23,133 Tuesday before sinking 2.5% to end the week at 22,561. Similarly, Spain’s IBEX index rose to 10,376 and then dropped 2.7% to close Friday’s session at 10,093.
Having risen better than 20% since early September, Japanese equities have been in speculative blow-off mode. After trading to a 26-year high of 23,382 inter-day on Thursday, Japan’s Nikkei 225 index sank as much as 859 points, or 3.6%, in afternoon trading. The dollar/yen rose to an eight-month high 114.73 Monday and then ended the week lower at 113.53. From Tokyo to New York, banks were hammered this week.
Perhaps the more important developments of the week unfolded in fixed-income.


-
I know Mike is a very solid investor and respect his opinions very much. So if he says pay attention to this or that - I will.
~ Dale G.
-
I've started managing my own investments so view Michael's site as a one-stop shop from which to get information and perspectives.
~ Dave E.
-
Michael offers easy reading, honest, common sense information that anyone can use in a practical manner.
~ der_al.
-
A sane voice in a scrambled investment world.
~ Ed R.
Inside Edge Pro Contributors

Greg Weldon

Josef Schachter

Tyler Bollhorn

Ryan Irvine

Paul Beattie

Martin Straith

Patrick Ceresna

Mark Leibovit

James Thorne

Victor Adair