
Real Estate
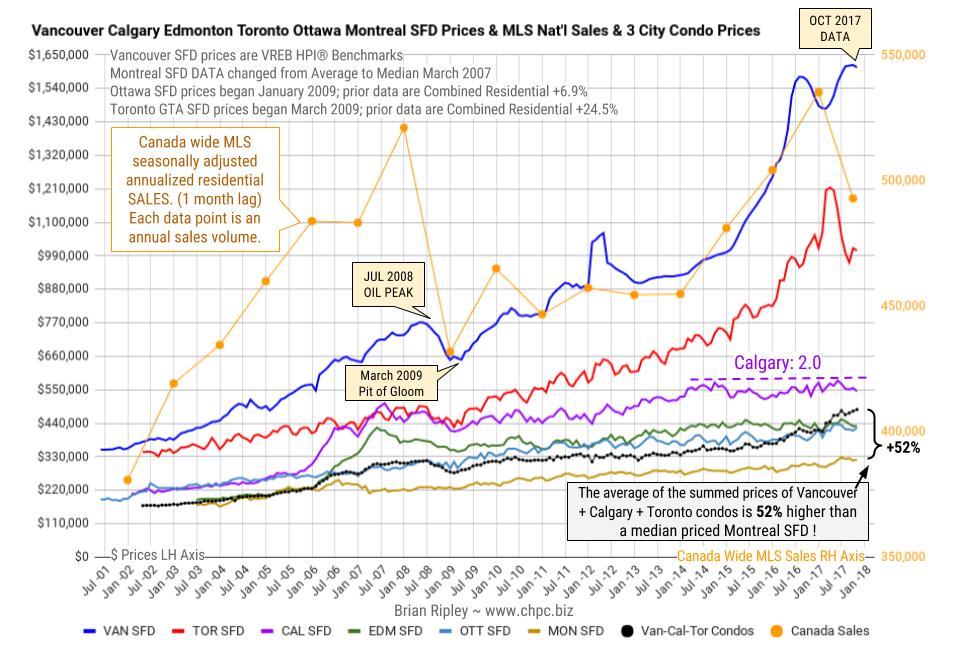
In October 2017 Toronto metro SFD prices hung on to their recent correction high but after 7 months since the March 2017 spike and peak price, they have lost $206,215 or 17%
(Plunge-O-Meter). Vancouver prices are still defying gravity; FOMO and speculative pricing is still on.
Anyone owning a detached house in the scorching hot Vancouver market is sitting on an unredeemed lottery ticket with time running out as buyers hibernate into the seasonal decline. The Bank of Canada interest rate up-moves is thinning the crowd even more.
….read more about Calgary & the CMHC
….also the plunge-0-meter:
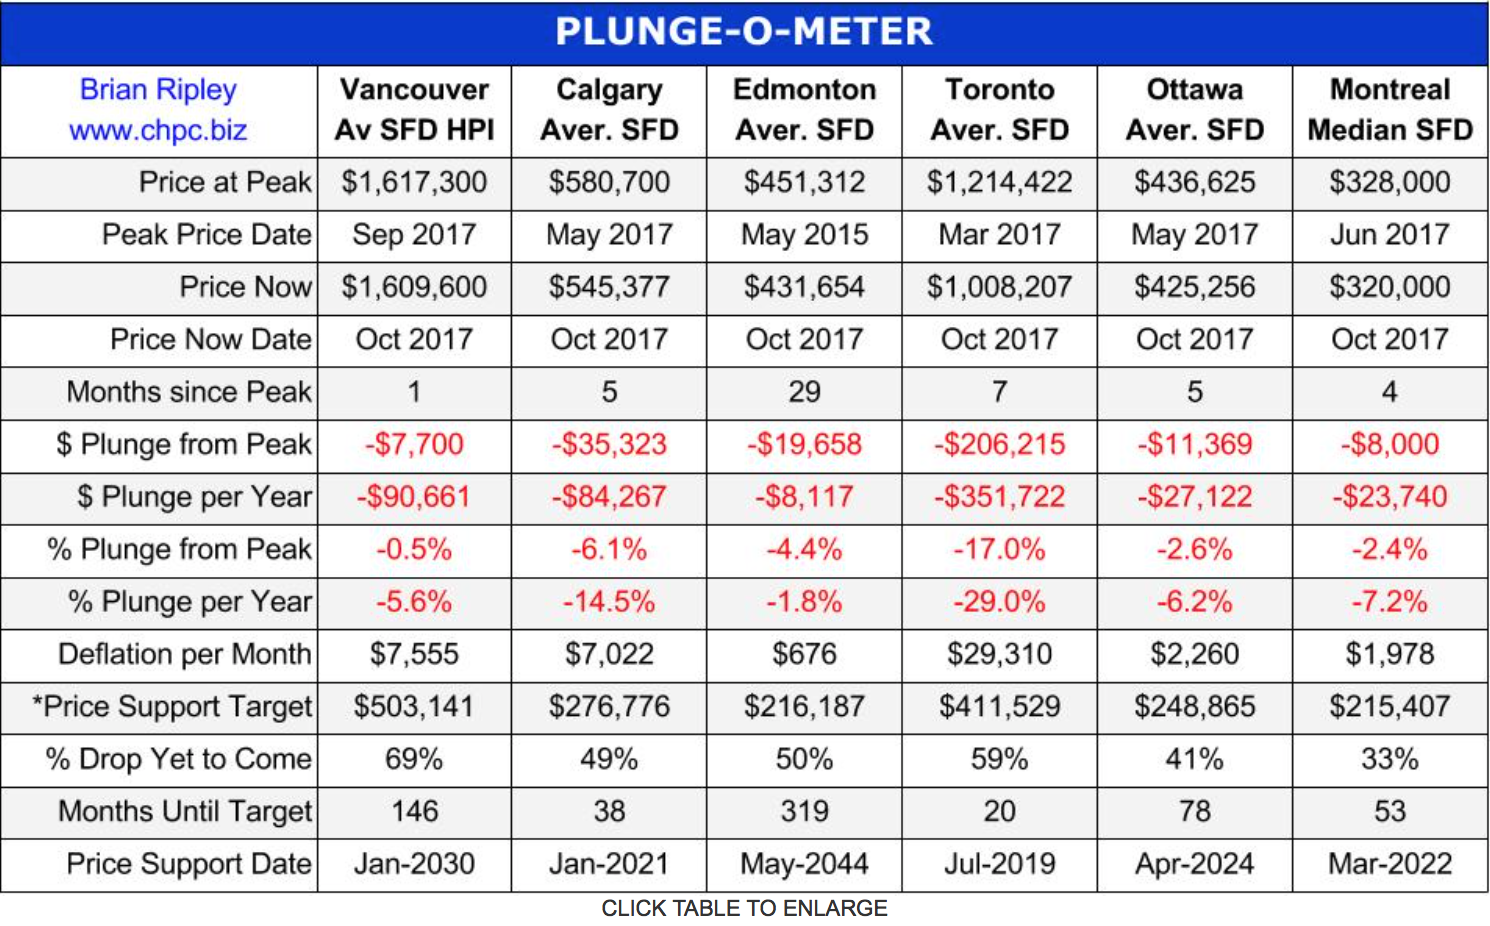
*The Price Support target represents prices at March 2005; the start of a 40 month period of ardent speculation in all commodities; then a full blown crash into the pit of gloom (March 2009); and then another 39 month rocket ship to the moon but then the crowd suddenly thinned out in April 2012. The revival of spirits erupted in 2013 as global money went short cash and long real estate on an inflation bet. Now we have a major sense of doubt about value in Toronto.
Plunge-O-Nomics
The Pit of Gloom
- ’07-’08 Average Vancouver SFD lost $122,900, or 15.9% in 8 months (2%/mo drop)
- ’07-’08 Average Calgary SFD lost $92,499, or 18.3% in 18 months (1%/mo drop)
- ’07-’08 Average Edmonton SFD lost $78,719, or 18.5% in 21 months (0.9%/mo drop)
- ’07-’08 Average Toronto SFD lost $63,867, or 13% in 13 months (1%/mo drop)
- ’07-’08 Average Ottawa Residence lost $25,664, or 8.6% in 6 months (1.4%/mo drop)
- ’07-’08 Median Montreal SFD lost $6,000, down 2.6% in 6 months (0.4%/mo drop)

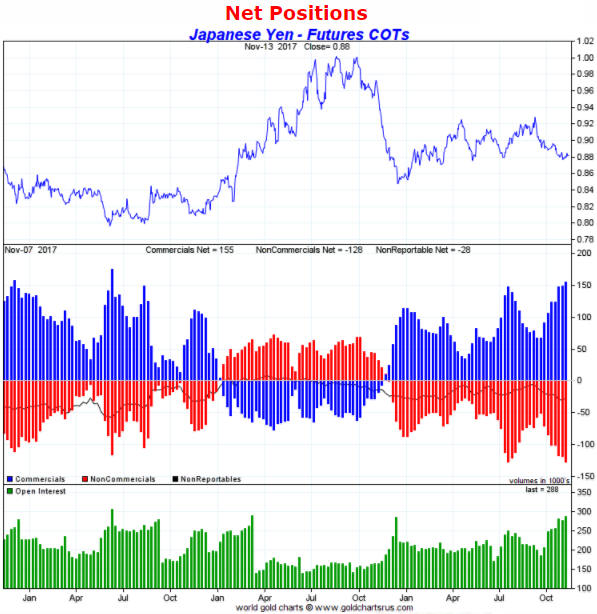
The Commitments of Traders (COT) reports are nothing other than sentiment indicators, but as far as sentiment indicators go they are among the most useful. In fact, for some markets, including gold, silver, copper and the major currencies, the COT reports are by far the best indicators of sentiment. This is because they reflect how the broad category known as speculators is betting. Sentiment surveys, on the other hand, usually focus on a relatively small sample and are, by definition, based on what people say rather than on what they are doing with their money. That’s why for some markets, including the ones mentioned above, I put far more emphasis on the COT data than on sentiment surveys.
In this post I’m going to summarise the COT situations for four markets with the help of charts from an excellent resource called “Gold Charts ‘R’ Us“. I’ll be zooming in on the net positions of speculators in the futures markets, although useful information can also be gleaned from gross positions and the open interest.
Note that what I refer to as the total speculative net position takes into account the net positions of large speculators (non-commercials) and small traders (the ‘non-reportables’) and is the inverse of the commercial net position. The blue bars in the middle sections of the charts that follow indicate the commercial net position, so the inverse of each of these bars is considered to be the total speculative net position.
Let’s begin with the market that most professional traders and investors either love or hate: gold.
The following weekly chart shows that the total speculative net-long position in Comex gold futures hit an all-time high in July of 2016 (the chart only covers the past three years, but I can assure you that it was an all-time high). In July of last year the stage was therefore set for a sizable multi-month price decline, which unfolded in fits and starts over the reminder of the year. More recently, the relatively small size of the speculative net-long position in early-July of this year paved the way for a tradable rebound in the price, but by early-September the speculative net-long position had again risen to a relatively high level. Not as high as it was in July of 2016, but high enough that it was correct to view sentiment as a headwind.
There has been a roughly $100 pullback in the price from its early-September peak, but notice that there has been a relatively minor reduction in the total speculative net-long position. This suggests that speculators have been stubbornly optimistic in the face of a falling price, which is far from the ideal situation for anyone hoping for a gold rally. A good set-up for a rally would stem from the flushing-out of leveraged speculators.
The current COT situation doesn’t preclude a gold rally, but it suggests that a rally that began immediately would be limited in size to $50-$100 and limited in duration to 1-2 months.

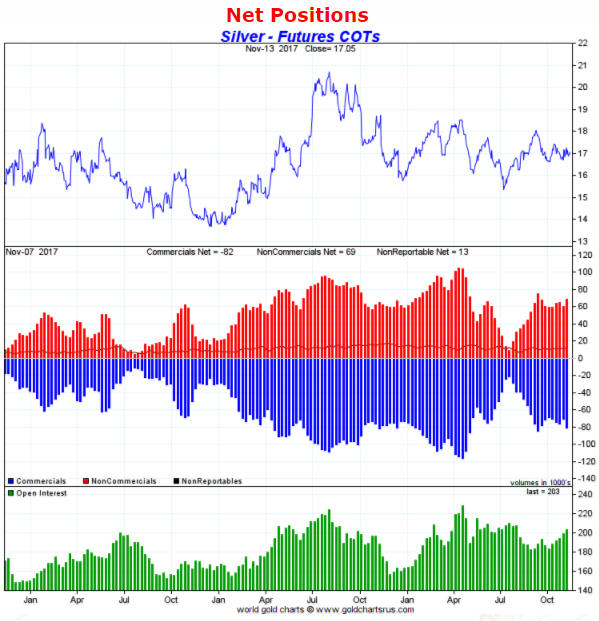
It’s a similar story with silver, in that the price decline of the past two months has been accompanied by almost no reduction in the total speculative net-long position in Comex silver futures. In other words, silver speculators are tenaciously clinging to their bullish positions in the face of price weakness. This suggests a short-term risk/reward that is neutral at best.
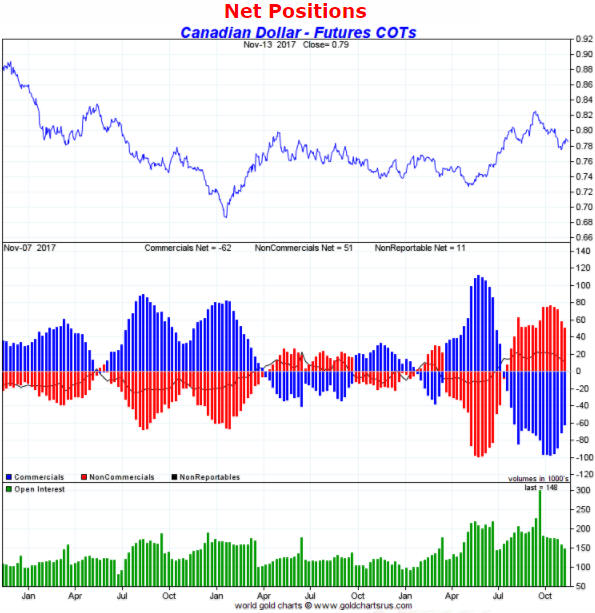
In May of this year the total speculative net-short position in Canadian dollar (C$) futures hit an all-time high, meaning that the C$’s sentiment situation was more bullish than it had ever been. This paved the way for a strong multi-month rally, but by early-September the situation was almost the exact opposite. After having their largest net-short position on record in May, by late-September speculators had built-up their largest net-long position in four years. The scene was therefore set for C$ weakness.
The speculative net-long position in C$ futures has shrunk since its September peak but not by enough to suggest that the C$’s downward correction is complete.
For the Yen, the sentiment backdrop is almost as supportive as it gets. This is because the speculative net-short position in Yen futures is not far from an all-time high. There are reasons outside the sentiment sphere to suspect that the Yen won’t be able to manage anything more than a minor rebound over the coming 1-2 months, but due to the supportive sentiment situation the Yen’s short-term downside potential appears to be small.
Needless to say (but I’ll say it anyway), sentiment is just one piece of a big puzzle.


![]()
In this week’s issue:
Stockscores Free Webinars
What are the Economics of Stock Trading?
Nov 15, 2017 6:00 PM PST
Whether you are a long term investor or a short term active trader, it is essential to understand the economics of trading. How should you measure your returns? What are the risks? How much capital does it take to trade? What are the potential gains? These questions and more will be addressed during this webinar. I will show performance data for my day, swing and position trading over the last few months.
Stockscores Market Minutes – Expect Failure
Whether it is the development of a new trading strategy or just the trades you make day to day, expect to fail often. Trading is simple, but it is not easy. Learn from your mistakes and don’t let failure stop you from achieving success. That plus this week’s Market Analysis and the trade of the week on RLOG.
To get instant updates when I upload a new video, subscribe to the Stockscores YouTube Channel
Trader Training – The Importance of Trading Less
It’s better to miss a good trade than to take a bad one. Missing a good trade doesn’t deplete your capital-it only fails to add to it. A bad trade will not only reduce the size of your trading account, it will eat up emotional capital and your confidence.
A losing trade is not a bad trade. Bad trades are simply taking the trade that doesn’t meet your requirements. Bad trades come from working hard to see something that’s not there, guided by your need to trade rather than the market offering a good opportunity.
I have read very few books about the stock market, but one that I’ve read more than once and that I think is a must-read for every investor is Reminiscences of a Stock Operator by Edwin Lefevre. Here is a wonderful quote from that book that captures the essence of what this chapter is about:
“What beat me was not having brains enough to stick to my own game-that is, to play the market only when I was satisfied that precedents favored my play. There is the plain fool, who does the wrong thing at all times everywhere, but there is also the Wall Street fool, who thinks he must trade all the time. No man can have adequate reasons for buying or selling stocks daily-or sufficient knowledge to make his play an intelligent play.”
-Reminiscences of a Stock Operator
I advise all my students that they will make more money by trading less, at least so long as trading less is the result of having a high standard for what they trade. If you tell yourself you’re limited to only making 20 trades a year, you’re probably going to be very fussy about what trades you take. With less than two trades to be made each month, only the very best opportunities will pass your analysis. All of the “maybes” or “pretty goods” will get thrown out.
We take the pretty good trades because we’re afraid of missing out. It’s painful to watch a stock you considered buying but passed on go up. You remember this pain and the next time you see something that looks pretty good, you take it with little regard for the expected value of trading pretty good opportunities.
Pretty good means the trade will make money some of the time and lose some of the time, and the average over a large number of trades may be close to breaking even. The fact that one pretty good trade did well is reasonable and expected. In the context of expected value, taking those pretty good trades many times will lead to less than stellar results when the losers offset the winners.
You shouldn’t judge your trading success one trade at a time. You must look at your results over a large number of trades. To maximize overall profitability requires you to have a high standard for what trades you make. Maintaining that standard will be easier if you take the trades that stand out as an ideal fit to your strategy, not by taking those that are marginal and require a lot of hard work to uncover.

Ran the Abnormal Breaks Market Scans for the US and Canada today, did not find too much I like but there is one stand out, listed on both the TSX and Nasdaq.

1. APTO
Three months of sideways trading on T.APS and APTO with a break to new highs today on strong volume. Support at $1.60 on the US listing and $2 on the Canadian.

If you wish to unsubscribe from the Stockscores Foundation newsletter or change the format of email you are receiving please login to your Stockscores account. Copyright Stockscores Analytics Corp.
References
- Get the Stockscore on any of over 20,000 North American stocks.
- Background on the theories used by Stockscores.
- Strategies that can help you find new opportunities.
- Scan the market using extensive filter criteria.
- Build a portfolio of stocks and view a slide show of their charts.
- See which sectors are leading the market, and their components.
Disclaimer
This is not an investment advisory, and should not be used to make investment decisions. Information in Stockscores Foundation is often opinionated and should be considered for information purposes only. No stock exchange anywhere has approved or disapproved of the information contained herein. There is no express or implied solicitation to buy or sell securities. The writers and editors of this newsletter may have positions in the stocks discussed above and may trade in the stocks mentioned. Don’t consider buying or selling any stock without conducting your own due diligence.

Some of you reading this might already be familiar with the “Parable of the Talents,” but it’s worth a brief retelling. The story, which appears in the gospels of Matthew and Mark, involves a master who entrusts three servants with some of his “talents,” or gold coins, while he’s away on business. Two of the servants take a risk by putting the money to work and end up doubling their master’s wealth. The third servant, however, buries his share to “keep it safe” and so doesn’t generate any returns. (Indeed it likely loses value because of inflation.)
When the master returns, he’s so pleased at how the first two servants grew his wealth that he puts them in charge of “many things” and invites them to share in his own success.
The third servant, though, he calls “wicked and lazy” and says he might as well have deposited the money in a bank while he was away—at least then he would have received a little interest. The servant is punished by having his share of the talents given to the two who faithfully grew their master’s money, leaving him with nothing.
The lesson here should be plainly obvious, and we can express it in a number of different ways: There can be no reward without risk. You must spend money to make money. You reap what you sow. This should resonate with investors, entrepreneurs and any true believer in the power of capitalism.
Jesus’ parable applies not just to individuals but to corporations as well. Companies must grow to keep up with the rising cost of labor and materials and to stay competitive. To do that, they must put their money to work just as the two servants do.
And just as the two servants were invited to share in their master’s success, corporate growth has a multiplier effect—for the company’s employees and their families, shareholders, the local economy, strategic partners, companies up and down the supply chain and much more.
A Bonanza for Precious Metal Royalty Companies as Exploration Budgets Have Declined
I think the business model that best illustrates the meaning of the “Parable of the Talents” is the one practiced by gold and precious metal royalty companies. As much as I write and talk about royalty companies, I still encounter investors who aren’t aware of how significant a role they play in the mining space.
As a refresher, these firms help finance explorers and producers’ operations by buying royalties or rights to a stream. Because miners have had to slash exploration budgets since the decline in metal prices, the kind of financing royalty companies provide has only grown in demand—as evidenced by the mostly positive earnings reports last week.
Chief among them is Franco-Nevada, which had a very strong third quarter, reporting earnings of $55.3 million, or $0.30 a share, up 3.4 percent from the same three-month period last year. The Toronto-based company, having also recently diversified into the oil royalties space, closed its purchase of an oil royalty for C$92.5 million, bringing the number of its oil and gas assets up to 82. Including precious metals and other minerals, the total number of assets Franco-Nevada had in its diverse portfolio as of the end of the quarter stood at 341.
Here’s the multiplier effect: Not only do the miners benefit from the deals, allowing them to continue exploration and other operations, but shareholders are also rewarded handsomely. Since the company went public nearly 10 years ago, it’s raised its dividend each year and its share price has outperformed both gold and relevant gold equity benchmarks. After its earnings announcement last Monday, Franco-Nevada stock closed up more than 6 percent on the New York Stock Exchange (NYSE), its best one-day performance in nearly a year and a half. Shares hit a fresh all-time high last week.

Other royalty companies’ reports were just as impressive and show the rewards of putting your “talents” to work. Sandstorm Gold, reporting higher operating cash flow of $11.9 million, has acquired as many as 10 separate royalties since the end of September on properties in Peru, Botswana and South Africa that collectively cover more than 2.4 million acres.
Osisko Gold Royalties bought a $1.1 billion portfolio of 74 precious mineral royalties, including a 9.6 percent diamond stream. The company reported record quarterly gold equivalent ounces (GEOs) of 16,664, up 65 percent from the same quarter last year, and record quarterly revenues from royalties and streams of $26.1 million, up 48 percent.
Royal Gold also had a strong quarter, reporting operating cash flow of $72 million, an increase of 30 percent from last year, and returned as much as $16 million to shareholders in dividends.
Wheaton Precious Metals, the world’s largest precious metal streaming company, showed a sizeable decline in profits in the third quarter, but it continued to generate strong cash flow and looks poised to meet its end-of-year production guidance.
Although some investors might not realize how important these companies are to the industry, many other investors are opting to place their bets on royalty names, seeing them as having ample exposure to precious metals without some of the risks associated with producers. In its review of the third quarter, the World Gold Council (WGC) reported that global gold demand fell to an eight-year low as investment in gold ETFs slowed to 18.9 metric tons, down from 144.3 metric tons in last year’s September quarter. This could be a consequence of the media’s continued negative coverage of gold, despite its competitive performance against the S&P 500 Index. Whatever the cause, in this environment, there was no lack of love for royalty names, as you can see in the chart above.
A Changing Financial Landscape
We were one of Wheaton Precious Metals’ seed investors in 2004, when it was then known as Silver Wheaton. Because Franco-Nevada wouldn’t be spun off from Newmont Mining for another three years, Wheaton had first-mover advantage. It was something new, something different. This, coupled with what I recognized as a superior business model, gave me the conviction to allocate capital into the fledgling company, a move that turned out to be highly profitable.
Today I have the same conviction in blockchain technology and digital currencies. As of the end of October, the initial coin offering (ICO) market had raised $3 billion so far this year. That’s more than seven times the amount generated in crowdfunding in all of the previous years before 2017. And Bloomberg just reported that Google searches for “buy bitcoin” recently surpassed searches for “buy gold.”

With bitcoin’s market cap having grown past that of Goldman Sachs and Morgan Stanley, cryptocurrencies can no longer be written off as a curiosity. Major financial institutions have become bullish, having filed approximately 2,700 patents in blockchain technology.
Abigail Johnson, the youthful chairman of Fidelity, was quoted as saying, “Blockchain technology isn’t just a more efficient way to settle securities, it will fundamentally change market structures, and maybe even the architecture of the internet itself.” Johnson allegedly has a crypto-mining computer rig in her office, and Fidelity accountholders are now able to see their bitcoin holdings on the brokerage firm’s online platform. USAA, the massive financial firm used by millions of U.S. military personnel and their families worldwide, provides a similar service.
![]()
This all comes as Coinbase, a leading digital currency broker, saw a record number of people opening new accounts on its platform recently, doubling the number of accounts from the beginning of the year. In one 24-hour period, 100,000 new accounts were opened.
Millennials Driving Interest in Blockchain Technology and Cryptocurrencies
A lot of this growth in demand is thanks to millennials, the largest U.S. generation. Forget the stereotype of the “entitled” millennial in the workplace and the misconception that they’re all wasting their money on $10 avocado toast. Consulting firm Deloitte estimates that by 2020, millennials will make up 50 percent of the workforce and control between $19 trillion and $24 trillion. Many are savvy investors and were found to be more likely to be aware of their brokerage account fees than older generations, according to Charles Schwab’s Modern Wealth index.
In some ways, millennials are reshaping our living habits. Many of them choose to rent instead of own to stay mobile. They’re more likely to get their news from Twitter than from TV. Online dating apps have helped foster today’s hookup culture, but while young people now might have more sex partners than before, they’re having less sex overall than their parents or grandparents might have had at their age.
It’s little surprise, then, that millennials are among the earliest and most enthusiastic adopters of blockchain technology, bitcoin and digital currencies in general—none of which existed even 10 years ago. A poll conducted by Blockchain Capital found that large percentages of millennials would prefer $1,000 in bitcoin to $1,000 in other assets. More than a quarter said they would prefer bitcoin to stocks, while nearly a third preferred it to bonds.
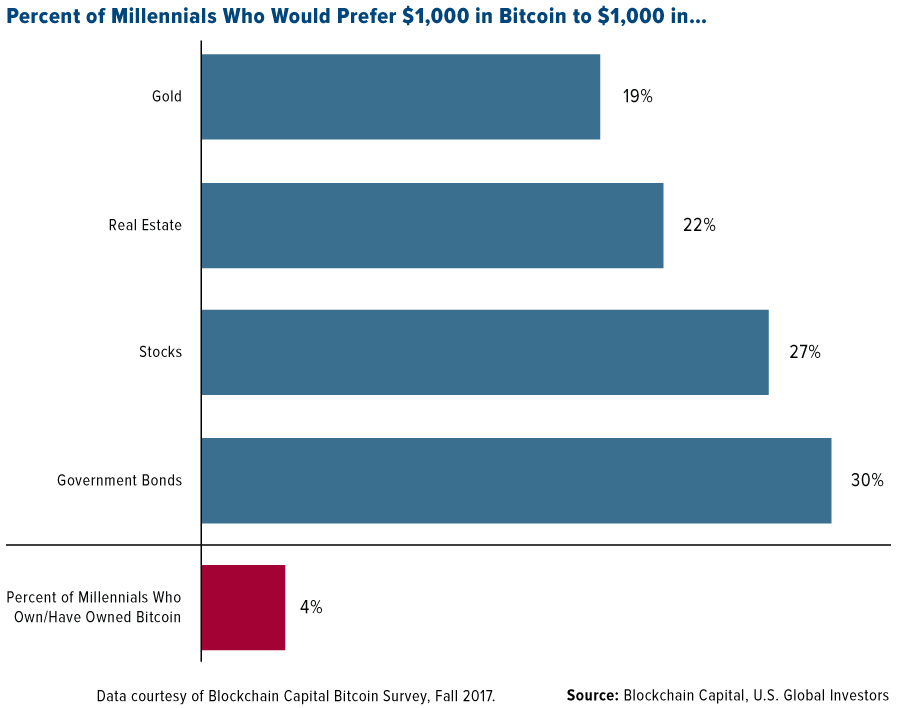
What I find especially encouraging is that only 4 percent of those who took the poll owned or had owned bitcoins. I say encouraging because this suggests there’s quite a lot of upside potential for bitcoin ownership, which in turn could raise prices further. As I shared with you recently, Metcalfe’s law states that the bigger the network of users, the greater that network’s value becomes. Consider Facebook. The social media giant has more than 2 billion active users. That’s 2 billion pairs of eyes Facebook is able to charge top dollar for advertisers to reach, helping it deliver record profits in the third quarter.
We could see the same thing happen across the blockchain and cryptocurrency network as more and more businesses and people embrace this new form of exchange.
Ploughing Capital into Blockchain
It should be clear by now that something is changing in financial markets, and this is what inspired me to make a strategic investment in a company with first-mover advantage in the cryptocurrency space, just as we did with Silver Wheaton years ago. As the “Parable of the Talents” teaches us, no reward can come to you without some risk-taking. Doing nothing is not an option.
That company is HIVE Blockchain Technologies, a blockchain infrastructure company involved in the mining of virgin digital currencies. The first company of its kind to sell shares to the public, HIVE began trading on the TSX Venture Exchange on September 18.
I’m very excited about this new chapter in our company’s history. If you weren’t on today’s earnings call, you can download the slide deck here to learn more about our deal with HIVE and what it means for our investors and shareholders.
All opinions expressed and data provided are subject to change without notice. Some of these opinions may not be appropriate to every investor. By clicking the link(s) above, you will be directed to a third-party website(s). U.S. Global Investors does not endorse all information supplied by this/these website(s) and is not responsible for its/their content.
The NYSE Arca Gold Miners Index is a modified market capitalization weighted index comprised of publicly traded companies involved primarily in the mining for gold and silver. The index benchmark value was 500.0 at the close of trading on December 20, 2002. The S&P 500 Stock Index is a widely recognized capitalization-weighted index of 500 common stock prices in U.S. companies.
The Modern Wealth Index tracks how well Americans across the wealth spectrum are planning, managing and engaging with their wealth. Developed in partnership with Koski Research and the Schwab Center for Financial Research, the Modern Wealth Index is based on Schwab’s Investing Principles and composed of 60 financial behaviors and attitudes, each assigned a varying amount of points depending on their importance.
There is no guarantee that the issuers of any securities will declare dividends in the future or that, if declared, will remain at current levels or increase over time.
Frank Holmes has been appointed non-executive chairman of the Board of Directors of HIVE Blockchain Technologies. Both Mr. Holmes and U.S. Global Investors own shares of HIVE, directly and indirectly.
Holdings may change daily. Holdings are reported as of the most recent quarter-end. The following securities mentioned in the article were held by one or more accounts managed by U.S. Global Investors as of 09/30/2017: Franco-Nevada Corp., Royal Gold Inc., Osisko Gold Royalties Ltd., Sandstorm Gold Ltd., Wheaton Precious Metals Corp., Newmont Mining Corp.
A funny thing happened to commodities in October. They went up. All of ’em. Or nearly all. Enough that the CRB Index busted out like an escaped felon with nothing to lose.
This index tracks a basket of 19 commodities. It’s energy-heavy – 33% by weight. But it is stuffed with everything from cocoa to copper, hogs to gold.
And as a group, these things are headed higher. And higher.

That tells us a lot about the global economy. And if you listen closely, the CRB’s price action will even tell you where to invest. To make handsome profits.
I’m talking about things that do well in global reflation.
What is global reflation, anyway? It’s when economic growth picks up all at the same time. Along with that, we see prices start to climb up.
That price climb is delayed a bit – for now. But economic activity is definitely accelerating.
How do we know that? Well, here in the U.S., GDP is expanding at about 3%. That’s after expanding at 3.1% in the second quarter. That’s better than the listless growth we saw during the Obama years.
And around the world, the IMF is boosting GDP forecasts for almost every advanced economy.
And here’s more proof: The number of countries in recession around the world has fallen to its lowest level ever. Ever!

So, what should you invest in for the global reflation trade? There are a BUNCH of things that do very well. But let me give you one group to buy … and one to SELL!
Buy: Metals
Let’s start with copper. It’s the most industrial metal on Earth. It’s used for everything from buildings to electronics.
And copper is also vital to the electric vehicle megatrend. Copper is NOT in electric-vehicle batteries. But it’s in everything else in an EV. On average, an EV has three to four times the amount of copper wiring that an internal combustion engine car contains.
This means a huge amount of copper is going to be in demand in the future. I talk about copper a lot in this space and in my trading services because its potential is so enormous.
Nickel is another industrial metal I pounded the table about. It’s used to make everything shiny, from silverware to steel. AND nickel is an important part of EV batteries. So, it’s going to ride the EV megatrend, too.
I told you about the industrial metals rally in August. I showed you a chart of …
- The PowerShares DB Base Metals Fund (DBB), which tracks a basket of aluminum, copper and zinc.
- The iPath Bloomberg Copper Subindex Total Return ETN (JJC), which focuses on copper.
- And the iPath Bloomberg Nickel Subindex Total Return ETN (JJN), which targets nickel.
Let’s see how you would have done if you’d bought ANY of my picks then.

Both copper and base metals have outperformed the S&P 500 since that issue ran. The real winner is nickel. A 28% gain. Wow!
I haven’t talked about gold or silver. Yet. Don’t worry, their day is coming. Especially as we start to see prices go higher.
Speaking of inflation, let’s get to my “sell” pick …
Sell: Bonds
There is already inflation in China and other “factory” economies. Stateside, we’re saved from that by technological innovation. But inflation will start to pass through.
Rising inflation tends to mean higher interest rates set by central banks. And that means Treasury yields will trend higher. And as yields go higher, prices go lower. That’s the simple fact.
To dig a bit deeper, negative interest rate policies have reached their limit in Europe and Japan. That means the deflation trade has run its course. The pendulum is going to swing in the other direction.
So, think about selling bonds. You can even short bonds through inverse funds. An example would be buying the ProShares Short 20+ Year Treasury ETF (NYSE: TBF). Speculators could consider buying the Direxion Daily 20-Year Treasury Bear 3X (NYSE: TMV).
The global reflation trade is here. It’s one of those megatrends I plan to keep talking about, because you should be aware of it. You can ride it to potential profits, or ignore it at your peril. Whatever you buy, do your own due diligence.
All the best,
Sean Brodrick


-
I know Mike is a very solid investor and respect his opinions very much. So if he says pay attention to this or that - I will.
~ Dale G.
-
I've started managing my own investments so view Michael's site as a one-stop shop from which to get information and perspectives.
~ Dave E.
-
Michael offers easy reading, honest, common sense information that anyone can use in a practical manner.
~ der_al.
-
A sane voice in a scrambled investment world.
~ Ed R.
Inside Edge Pro Contributors

Greg Weldon

Josef Schachter

Tyler Bollhorn

Ryan Irvine

Paul Beattie

Martin Straith

Patrick Ceresna

Mark Leibovit

James Thorne

Victor Adair