
Real Estate
 Tiho travels the world for investment and real estate opportunities while managing money for high net worth investors. He is simply the best trader and investor I’ve ever met. He covers the Emerging Market Real Estate in Montenegro, a low tax (9%) jurisdiction on the Adriatic coastline:
Jordan: Hello again everyone. Welcome back to episode two of The Atlas Investor podcast with Tiho Brkan. Thank you so much for joining us today. Tiho, my friend. Are you ready for episode two?
Tiho Brkan: I sure am.
Jordan: So Tiho, you are in Montenegro today. Tell us what city you are in and what else we’ll be discussing in episode two.
Tiho Brkan: Well hello to all the listeners. Yes, I’m in a beautiful little country of Montenegro on the Adriatic coastline, adjacent to a neighboring Croatia, Bosnia, Serbia, Albania, and also, across the waterways, Italy. We’ll be discussing a lot about Montenegro real estate and then we’ll get into what I think it will be a very interesting discussion between me and you Jordan, which is foreign stocks, in particular, emerging market stocks.
or listen below:


QUESTION: Mr. Armstrong; Thank you for an excellent conference. I have been attending since 2011. Each time you deliver a different conference and they are always better than the last. I could not help to notice on Zero Hedge they ran a piece about a Harvard University’s visiting scholar at the Bank of England who claims:
“We trace the use of the dominant risk-free asset over time, starting with sovereign rates in the Italian city states in the 14th and 15th centuries, later switching to long-term rates in Spain, followed by the Province of Holland, since 1703 the UK, subsequently Germany, and finally the US.”
Besides claiming to calculate the 700-year average real rate at 4.78% suggesting that rates will rise sharply when your models are 5,000 years, the two ridiculous statements are a 700-year average as if this really means something in the near-term when rates have been below that for nearly 10 years, and second the statement that he traces “the dominant risk-free asset over time.” You have demonstrated that moving averages are not valid in forecasting and that government routinely defaults.
You forecast at the conference that rates would rise very rapidly as we move into the Monetary Crisis Cycle. When I returned home to Greece, the latest news here is that so many people do not even have the money left to pay taxes. Is this part of the first stone in the water that sets off the waves of the Monetary Crisis Cycle?
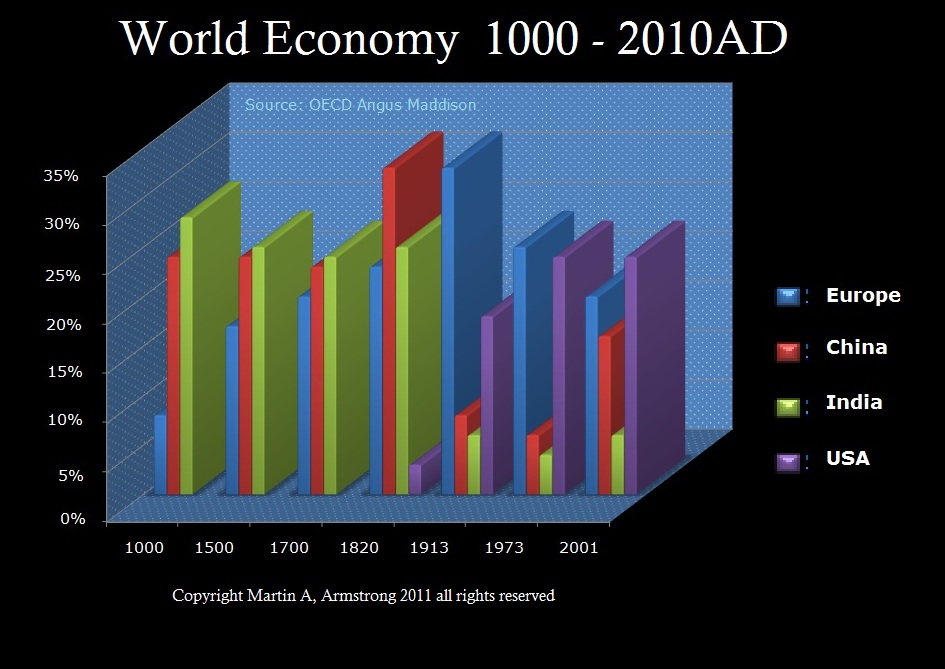
ANSWER: It is very nice to trace 700 years and come up with the average of 4.78% by switching to the dominant economy as the financial capital of the world moved. However, starting the study in the 14th century skips the crazy part. There was the Great Financial Crisis of 1092 in Byzantium. This was really a watermark event that set in motion the decline thereafter. This study of moving from Spain to Holland, UK, Germany, and then the USA, is interesting, but regionally biased.
The fall of Byzantium resulting in the financial capital of the world moving to India – not Spain. That is why Columbus set sail trying to get to India, which was the financial capital of the world after Byzantium.
We hit a 5,000 year low. The Reversals we provided at the conference show we are looking at a near doubling in rates when we cross that number.
….also from Martin:

 When I look at the 3 charts that I follow in the metals complex, they seem to be telling a different story today, at least in their micro structures.
Silver seems to have broken out of its downtrend, and can be viewed as having completed wave i of its (c) wave to the target box above. GLD seems to be stuck in neutral, with the same “potential” structure as silver, but without as much clarity to its micro count as silver has potentially presented.
And, then we are left with the GDX. As long as the GDX remains below the 23.05 level, it still has a smaller degree set up to test the 22 region before a rally may ensue.
So, on Friday (Nov 3), GDX has now dropped down and provided us the lower low I was looking for this past week right into the support region I noted last weekend between 21.95-22.30. Moreover, both gold and silver have now pulled back from their rallies begun this past week, and have still retained a set up to rally in the upcoming week.
Based upon the smaller degree wave counts, it certainly still seems as though the miners and the metals are potentially in different patterns, with the upcoming week set up to provide us further confirmation of this potential.
As I have noted for the last several weeks, silver really seems to be the more telling of the metals charts. I have been following a potential count which suggests that a (c) wave rally within a b-wave of wave ii is taking shape. And, I have noted that as long as we hold over the 16.40-16.50 support region, we can rally back up towards the September highs. This past week, silver broke out of its downtrend channel, and suggested that the (b) wave of the b-wave had completed, and that we also completed wave i of the (c) wave of the b-wave rally. While the micro structure can still support one more small drop before a rally may begin, as long as we hold over 16.65, my expectation is to see us rally back up towards at least the 17.85 region.
However, if silver were to break down below the 16.65 level, it would break its immediate upside set up, and place this pattern into serious question. And, if the market would then continue below the 16.30 level, it certainly opens the door for a much larger decline to be seen in silver. So, please remember that my primary expectation is that any rally we see is likely going to be corrective, which means you must remain quite vigilant, as it is quite possible that the market may not provide us with the larger bounce that I ideally want to see, despite my primary expectation. Along these lines, I have now provided you with the parameters which would suggest the market may be dropping a lot deeper than I had initially expected.
Now, as I have mentioned in the title to the article, I am starting to see a “silver lining” in the market action, and it relates to the miners rather than silver itself. I have warned that GDX could see as much as a 30% decline down to the 17 region once we broke below the upper support in September. And, that was based partly upon my read of the ABX, which is one of the major holdings within the GDX. This past week, ABX has dropped almost to the point where it would complete wave iii of (c), as you can see from the attached chart of the ABX. (Also, please note that I have dropped down our resistance region on the ABX chart). Yet, GDX has not seen a commensurate drop alongside of the ABX. While GDX may certainly catch up in the coming week or two, once ABX begins its wave iv bounce, it will likely pull the GDX up with it. And, should that wave iv begin in the coming week or so, it may suggest that the GDX may not break below the 21 region.
So, while we certainly had a set up to see the GDX drop to much lower levels, the recent relative strength we have seen in the GDX as compared to the ABX may suggest that it may not see as deep a drop for which it had been set up over the last few weeks. And, as I have noted before, the next rally will likely tell the story for the miner’s complex as a whole. As long as we do not see a direct and strong break below the 21.20-21.87 (slightly modified support region), we may see the GDX retain a more immediate bullish stance, which could suggest the yellow count may take shape into the end of the year.
Over the past several months, especially since we broke below the upper support back in September, I have been noting this market has now entered a region of uncertainty. And, I am still of the opinion that we will need to see how the next rally takes shape for us to have a better understanding of which pattern we will need to follow into the end of the year. But, what these patterns have in common is that it still does not look like this market will be ripe for a major rally again until early 2018. And, the probabilities are beginning to increase that the GDX may not see as deep a drop as I had initially expected, and the next few weeks may provide evidence that can make this potential much more likely than not. Stay tuned.
See charts illustrating the wave counts on the GDX, GLD & Silver (YI).
By Avi Gilburt via Elliot Wave Trader
– Diversify, rebalance investments and prepare for interest rate rises
– UK launches inquiry into household finances as £200bn debt pile looms
– Centuries of data forewarn of rapid reversal from ultra low interest rates
– 700-year average real interest rate is 4.78% (must see chart)
– Massive global debt bubble – over $217 trillion (see table)
– Global debt levels are building up to a gigantic tidal wave
– Move to safe haven higher ground from coming tidal wave
Editor: Mark O’Byrne

Source: Bloomberg
Last week, the Bank of England opted to increase interest rates for the first time in a decade. Since then alerts have been coming thick and fast for Britons warning them to prepare for some tough financial times ahead.
The UK government has launched an inquiry into household debt levels amid concerns of the impact of the Bank of England’s decision to raise rates. The tiny 0.25% rise means households on variable interest rate mortgages are expected to face about £1.8bn in additional interest payments whilst £465m more will be owed on the likes of credit cards, car loans and overdrafts.
The 0.25% rise is arguably not much given it comes against backdrop of record low rates and will have virtually no impact on any other rate. However it comes at a time of high domestic debt levels, no real wage growth and a global debt level of over $217 trillion.
From John Rubino: “We’ll Look Back At This And Cringe”
“Millions of people out there still bear the psychic scars of buying gold at $800/oz in 1980 or a tech stock at 1,000 times earnings in 1999 or a Miami condo for $1,000 per square foot in 2006.
Today’s bubble will leave some similar marks. But where those previous bubbles were narrowly focused on a single asset class, this one is so broad-based that the hangover is likely to be epic in both scope and cumulative embarrassment.”

BUBBLE? WHAT BUBBLE?

WARS: CURRENCIES AND NUCLEAR
From Timothy Alexander Guzman: “A Currency War Will Escalate”
One quote that always crosses my mind regarding the decline of the U.S. dollar and the state of geopolitics associated with it, is by Gerald Celente, founder of the Trends Research Institute who said that “When all else fails, they take you to war.”
As the U.S. dollar continues to lose its status as the world’s premiere reserve currency, the reality of a world war seems inevitable, especially when major countries such as China, Russia and Iran are making strategic moves to bypass the U.S. dollar in favor of other currencies such as China’s ‘Petro-Yuan’. China has made the decision to price oil in their own currency the “Yuan” by a new gold-backed futures contract which will change the dynamics of the world’s economy. China is preparing to launch the petro-Yuan later this year that will eventually threaten the U.S. dollar as the world’s reserve currency.”
The Gold Market – 30 Year Log Scale Graph:

From Christopher Aaron: Gold Price Forecast – First Breakout Signal Since 2008
This is interesting analysis from Christopher Aaron!
“In sum, the leading signals of gold rising versus the broad commodity index at a major price low, the downtrend break, and the trend line retest were all sequential indicators of a significant advance in prices setting up for the future.”
REGARDING SILVER:
From James Cook, President of Investment Rarities, Inc. – October 2017 newsletter:
“We’ve been buying back a lot of silver lately which is another sign of a bottom.”
The Silver Market – 30 Year Log Scale Graph:

PRINT – PRINT – PRINT: MORE DIGITAL CURRENCIES
From Robert Gore: A Crash Like We’ve Never Seen Before
“Credit creation, without restraint has papered the globe with the greatest pile of debt mankind has ever amassed.”
“When the debt bubble implodes, a global margin call will prompt forced selling, driving down all asset prices precipitously. Most of what is currently regarded as wealth will vanish.”

The S&P 500 Index – 30 Year Log Scale Graph:
(Or, the stock market goes up forever ………)

From Michael Pento:
“You still have time to extricate yourself from the lemming herd that is about to take its third 50%+ investment cliff dive since 2000.”
FREE GOLD BOOK:
Gold-Eagle has published a FREE gold e-book.

“The Definitive Gold Investing Guide” is available for download at: https://gold-eagle.lpages.co/gold-investing-guide/
The book is free in exchange for your email address.
My book “Buy Gold Save Gold! The $10K Logic” is available at Amazon.

Gary Christenson
The Deviant Investor

-
I know Mike is a very solid investor and respect his opinions very much. So if he says pay attention to this or that - I will.
~ Dale G.
-
I've started managing my own investments so view Michael's site as a one-stop shop from which to get information and perspectives.
~ Dave E.
-
Michael offers easy reading, honest, common sense information that anyone can use in a practical manner.
~ der_al.
-
A sane voice in a scrambled investment world.
~ Ed R.
Inside Edge Pro Contributors

Greg Weldon

Josef Schachter

Tyler Bollhorn

Ryan Irvine

Paul Beattie

Martin Straith

Patrick Ceresna

Mark Leibovit

James Thorne

Victor Adair