
Gold & Precious Metals
Most of technical analysis that one can read about gold and gold stocks is based on these markets alone. This is quite strange given the multitude of intermarket relationships, but still that’s the case. While it is true that looking at the performance of a given market is the most important thing that one can do when estimating the future performance of a given asset, it doesn’t mean that it’s all there is to it. Conversely, looking at the bigger picture and considering the less known factors can give investors and traders extra insight necessary to gain the Holy Grail of trading – the edge. So, we thought that you might appreciate a discussion of factors that are not as popular as the analysis of the precious metals market on its own, but that is still likely to have an important effect on its price.
In today’s free analysis, we discuss three such issues: the non-USD silver price (the average of silver prices in terms of currencies other than the U.S. dollar), the Dow to gold ratio and the long-term USD Index picture. The latter is quite often analyzed, but such analyses are generally conducted based on only the most recent data and thus what we discuss should put such comments in proper perspective. In other words, it should make sure that one doesn’t miss the forest for individual trees. Let’s start with the former (chart courtesy of http://stockcharts.com):
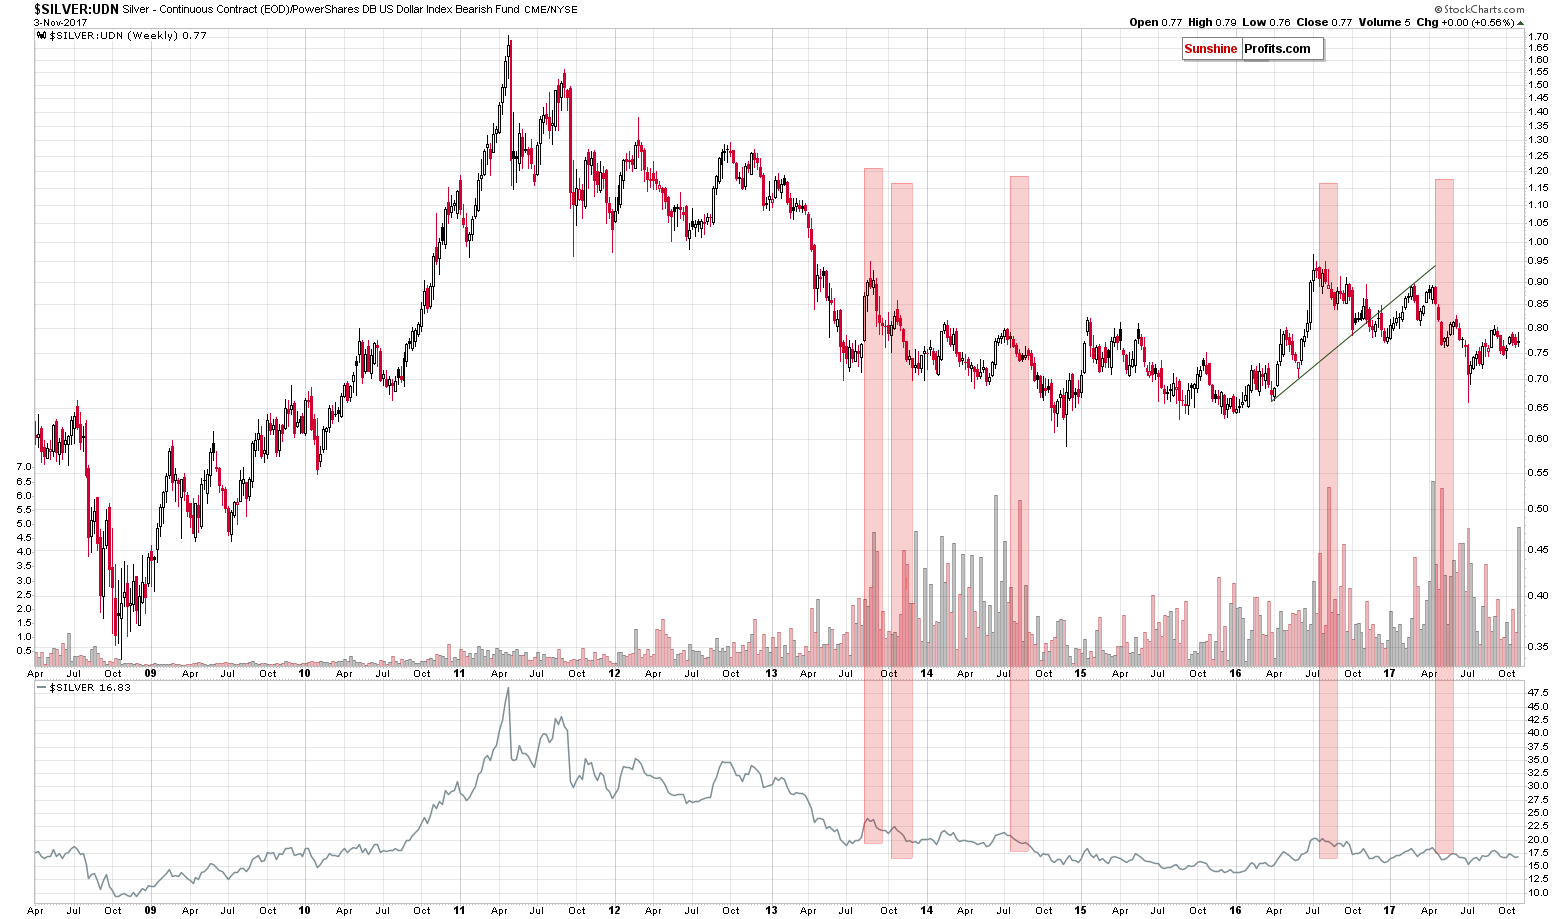
Silver’s non-USD performance is something that should be kept in mind and the same goes for the ratio of weekly volumes between silver and the UDN ETF (as that’s how we obtain the non-USD price). The above should not be ignored because silver is an important part of the precious metals sector (and the one that provided biggest gains in the 70s bull market) and the non-USD perspective should not be neglected because, after all, the USD is only one of the major currencies.
It is not the value of the ratio that is currently extraordinary, but the volume (the ratio of volumes, to be precise). Spikes in this ratio indicate extraordinary interest in the price of the white metal and there were many cases in the past when this served as an indication of much lower prices in the following weeks and months. This signal doesn’t say anything about the short term, but the medium-term implications are bearish.
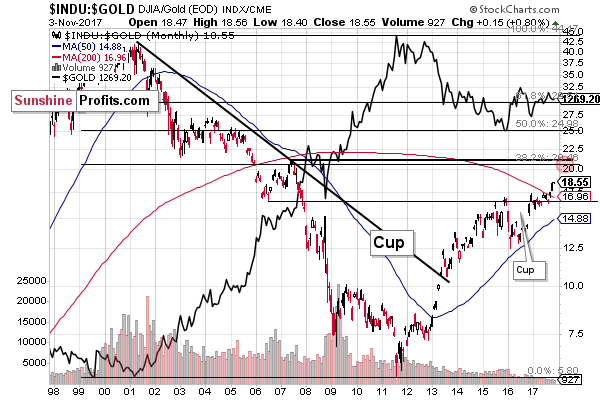
The same kind of implications are provided by the Dow to gold ratio. It moved higher and more than confirmed its breakout above the previous highs. The last time when we saw a major breakout in this ratio was in early 2013 and it meant that gold’s price was about to slide for hundreds of dollars.
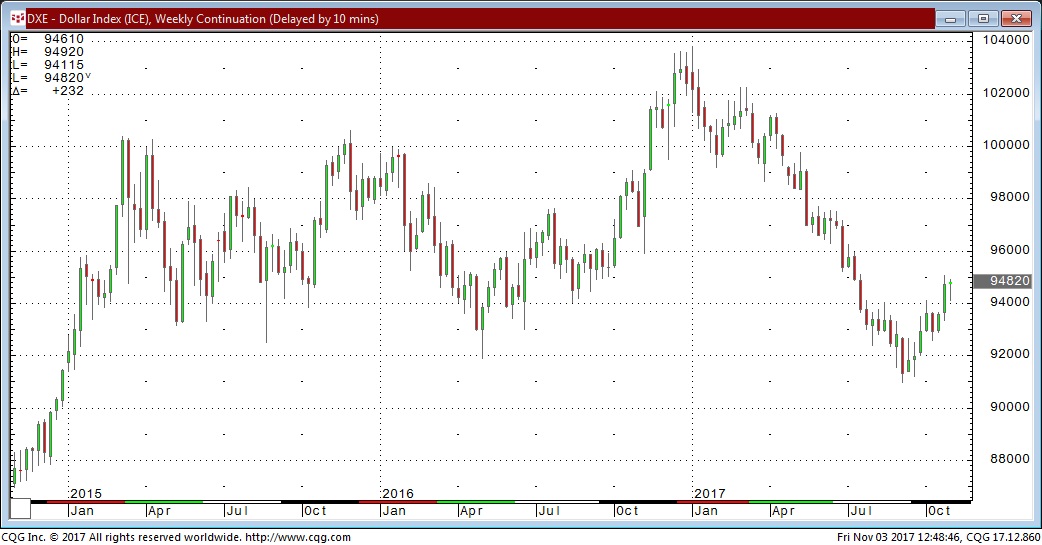
Still as far as the short term is concerned, the USD Index also points to a reversal only after an additional rally.
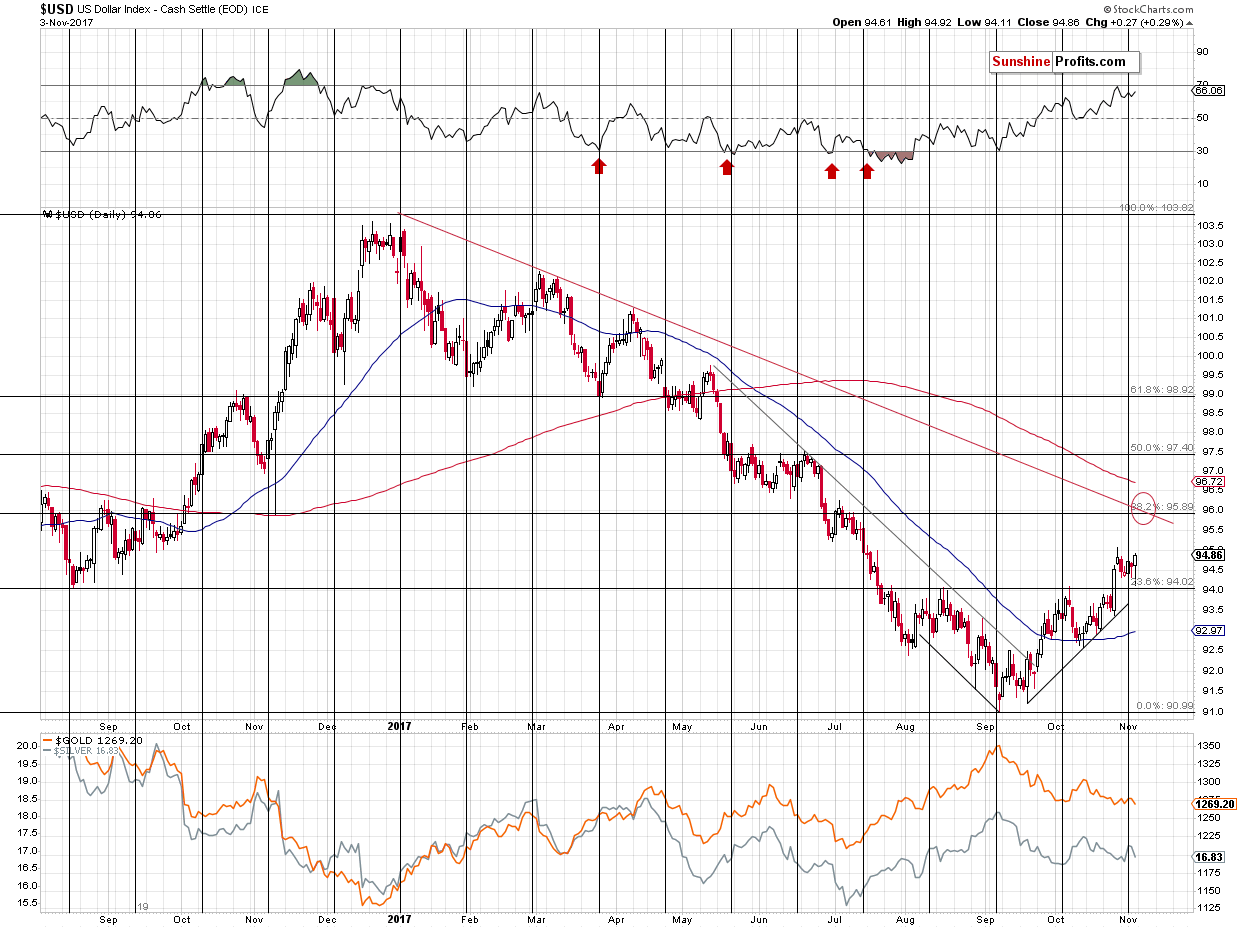
The breakout above the neck level of the reverse head and shoulders pattern is more than confirmed, so another rally appears very likely to be seen this week. The target at about 96 level (precisely 95.89) is supported by the declining red resistance line and the 38.2% Fibonacci resistance level. Both are based on a clearly visible, medium-term move, so they are important.
Now, let’s consider the follow-up action.
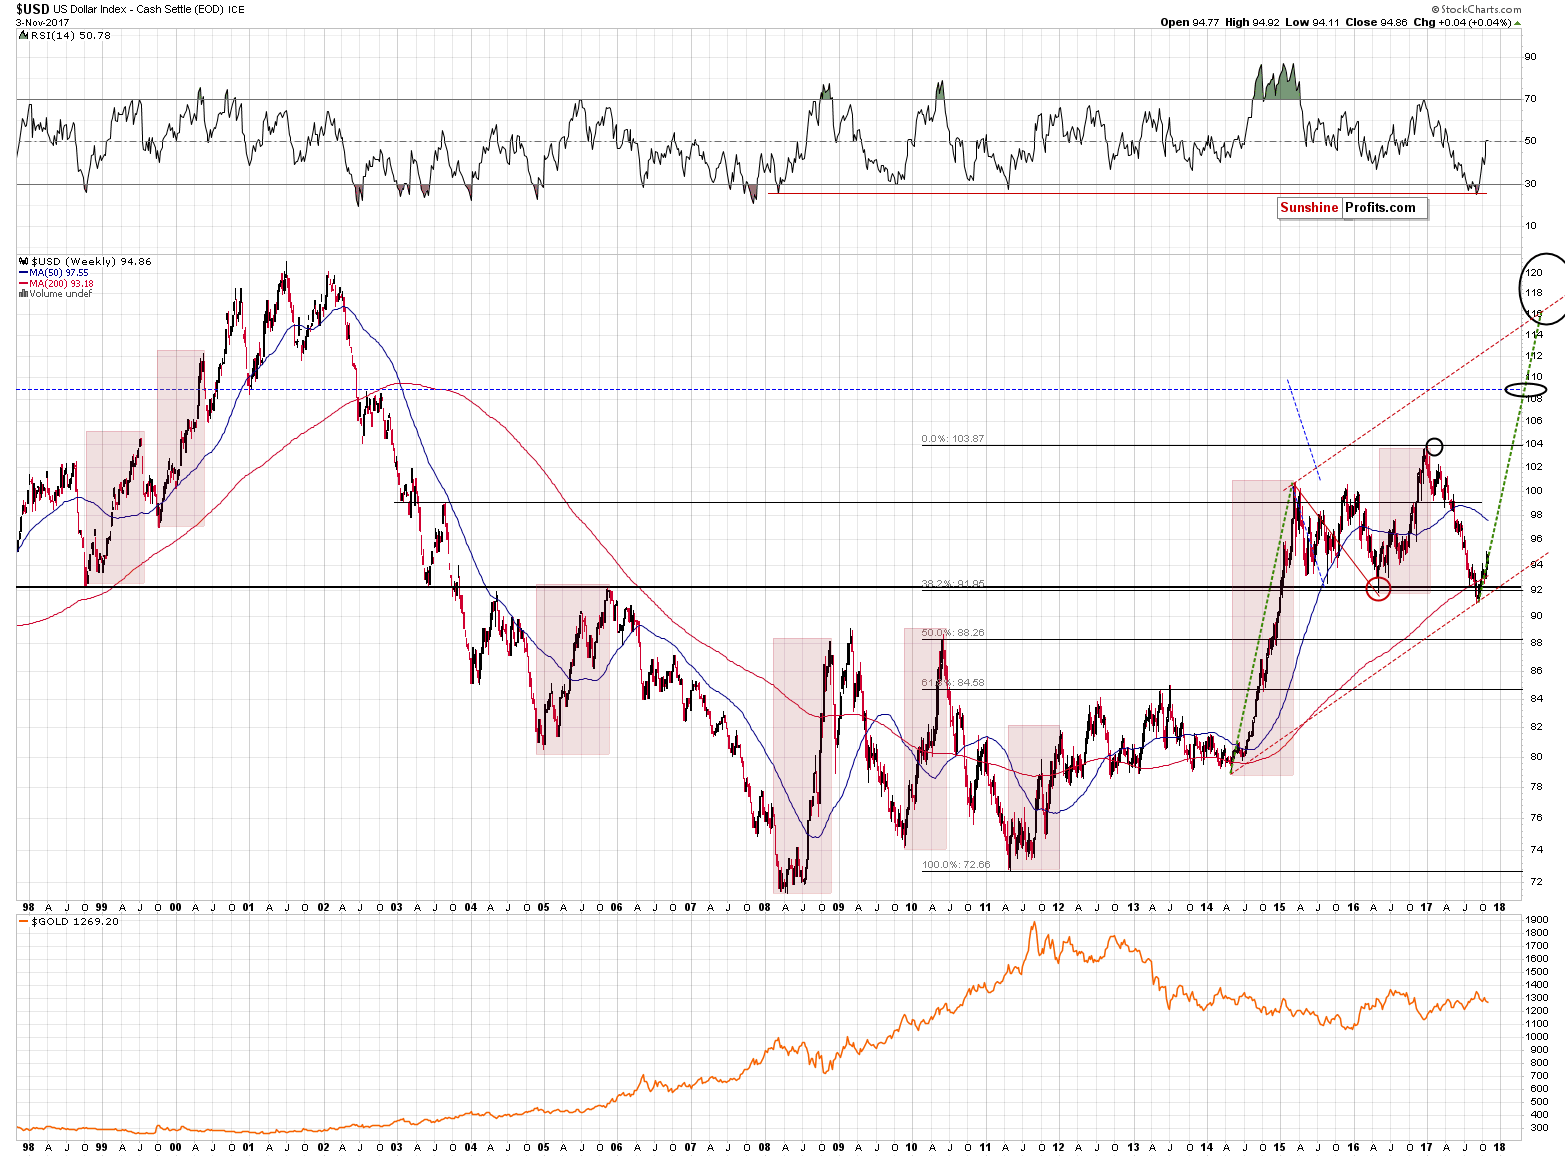
If the USD Index is starting a huge rally, just like it’s likely to based on where we are in the series of interest rate hikes, then it’s a good idea to check how the previous big USD rallies looked like and look for similarities. In this way we could spot trading opportunities (and look for confirmations at particularly important moments / price levels) and even if we don’t, the above should still prepare one for what’s to come and one would not panic in light of an event that would appear a game-changer on a day-to-day basis, but would be normal when looked at from the long-term perspective.
We marked 8 big rallies on the above 20-year chart. They vary in terms of length, size and sharpness, but there are a few similarities between them. The rallies took between (approximately) 30 and 45 weeks, so the current possible rally could end between April and July 2018, but that’s not something that has implications for the nearby days and weeks. However, analyzing the beginnings of the big rallies has such implications.
The first part of 6 out of 8 big rallies was characterized by a rather large pullback. In 1998, 2005, 2008, 2011, 2014 and 2016 the biggest, most stable and bullish part of the rally took place only after an initial correction that erased more than half of the very initial rally.
In the remaining two cases, the correction was still present, but it was not that significant.
So, should we expect the current rally to continue much higher without a bigger correction? No, such a correction would be something rather likely and normal. If the 50% correction is to be the minimum range for the pullback and the USD tops at about 96, then we can expect it to decline to about 93 – 93.5.
That would not be a small move, so adjusting one’s trading positions might be a good idea should it become very likely. The same is the case for the positions in the precious metals market as a bigger correction in the USD would likely translate into a visible correction in metals and miners.
Summing up, even though there are multiple signals pointing to lower precious metals prices in the coming months, it seems likely that after an additional decline from here, the precious metals sector is going to correct to the upside. While we keep the detailed target prices for precious metals and miners for our subscribers, we can say that one of the bigger factors that we will be monitoring for confirmations is the value of the USD Index and it appears likely that the mentioned reversal will take place when the USDX moves close to the 96 level.
We hope you enjoyed today’s analysis, even though it might appear controversial. If you’d like to receive follow-ups, we invite you to subscribe to our Gold & Silver Trading Alerts.
Thank you.
Sincerely,
Przemyslaw Radomski, CFA
….also from Sunshine Profits:
Saudi Purge and Gold

Tuesday November 7, 2017 – Available Mon- Friday after 3:00pm PST.
DOW + 9 on 465 net declines
NASDAQ COMP – 19 on 1264 net declines
SHORT TERM TREND Bullish
INTERMEDIATE TERM Bullish
STOCKS: The market mostly slipped on Tuesday. Earnings were the main culprit and interestingly enough, dropping interest rates were cited. The latter because supposedly lower rates pressure banks. I think this is nonsense. Stocks rallied from ’09 through much of 2016 precisely because rates were near zero. But, we have to admit that the XLF or the financial ETF was down over 1% today.
Part of the problem was an overbought RSI on many indices. That can be ignored for a while, but at some point it tends to be a deterrent.
GOLD: Gold was fell back $5. The yellow metal is just waffling around right now.
CHART: The CBOE put call ratio closed above 1.0 today. When that happens, the S&P has a tendency to move higher over the next day or three.

BOTTOM LINE: (Trading)
Our intermediate term system is on a buy.
System 7 We bought the SSO at 102.50. Let’s stay with it through Wednesday.
System 8 We are in cash. Stay there for now.
System 9 We are in cash.
NEWS AND FUNDAMENTALS: Job openings (JOLTS) were 6.093 million, more than the expected 6.082 million. On Wednesday we get oil inventories.
INTERESTING STUFF: “Why don’t they pass a constitutional amendment prohibiting anybody from learning anything? If it works as well as prohibition did, in five years we will have the smartest people on earth.” —-Will Rogers
TORONTO EXCHANGE: Toronto added another 40.
BONDS: The bond market moved still higher.
THE REST: The dollar moved slightly higher. Crude oil hesitated today after a big run.
Bonds –Bullish as of October 27.
U.S. dollar – Bullish as of October 20.
Euro — Bullish as of October 10.
Gold —-Bullish as of November 1.
Silver—- Bullish as of November 1.
Crude oil —-Bullish as of October 10.
Toronto Stock Exchange—- Bullish as of September 20, 2017.
We are on a long term buy signal for the markets of the U.S., Canada, Britain, Germany and France.

Monetary conditions (+2 means the Fed is actively dropping rates; +1 means a bias toward easing. 0 means neutral, -1 means a bias toward tightening, -2 means actively raising rates). RSI (30 or below is oversold, 80 or above is overbought). McClellan Oscillator ( minus 100 is oversold. Plus 100 is overbought). Composite Gauge (5 or below is negative, 13 or above is positive). Composite Gauge five day m.a. (8.0 or below is overbought. 13.0 or above is oversold). CBOE Put Call Ratio ( .80 or below is a negative. 1.00 or above is a positive). Volatility Index, VIX (low teens bearish, high twenties bullish), VIX % single day change. + 5 or greater bullish. -5 or less, bearish. VIX % change 5 day m.a. +3.0 or above bullish, -3.0 or below, bearish. Advances minus declines three day m.a.( +500 is bearish. – 500 is bullish). Supply Demand 5 day m.a. (.45 or below is a positive. .80 or above is a negative). Trading Index (TRIN) 1.40 or above bullish. No level for bearish.
No guarantees are made. Traders can and do lose money. The publisher may take positions in recommended securities.

Last weekend it was easy to imagine that markets would be volatile this week: President Trump was set to nominate a new Fed Chairman, tax reform plans were to be unveiled, the Fed and the BOE were meeting, the post-hurricane employment reports were due, stock markets had raced to new All Time Highs…what could possibly go wrong?
Not much, apparently, as implied volatility fell back this week to near All Time Lows across asset classes…currency markets muddled mostly sideways with the US Dollar Index inching to its strongest weekly close since July…bond yields fell as the market reversed from pricing in a possibly tighter Fed…and stocks ambled to new All Time Highs!
Fed Chair: The President nominated Powell to replace Yellen when her term expires in February and the Senate is expected to approve his nomination. He provides continuity with recent Fed policies (better the devil you know…) but also showcases that Trump remains intent on “shaking things up.”
Tax Reform: There was very little reaction to the tax reform details across major stock indices, currencies and interest rates. There was, of course, a tsunami of politically motivated commentary about how bad or how good the proposals were, and whether or not the proposals will ever become law.
The Fed meeting: wasn’t expected to provide any fireworks, and didn’t. They see “solid” US economic growth and markets are now pricing a 90% chance that the Fed will raise short term interest rates by ¼ in December…and with financial conditions the “easiest” in over 2 decades the Fed may be tightening more in 2018 than the market is currently pricing…which would be USD bullish.
The employment report: was expected to show a big, possibly huge, post-hurricane employment rebound…but the net market effect of the report was subdued. Jobless claims fell to a 44 year low.
Consumer confidence: reports this week showed that American consumer confidence is at a 15 year high due to gains in the stock market, housing prices and wages(?) Consumers are now 70% of US GDP so their high confidence level may have a positive feedback effect on the stock market and housing prices…although I have to wonder if this isn’t a classic “end of cycle” picture especially with consumers running down their savings and going deeper into debt so that they can keep buying things! Another cautionary sign is that the growth rate for national wages is about half the growth rate for national housing prices.
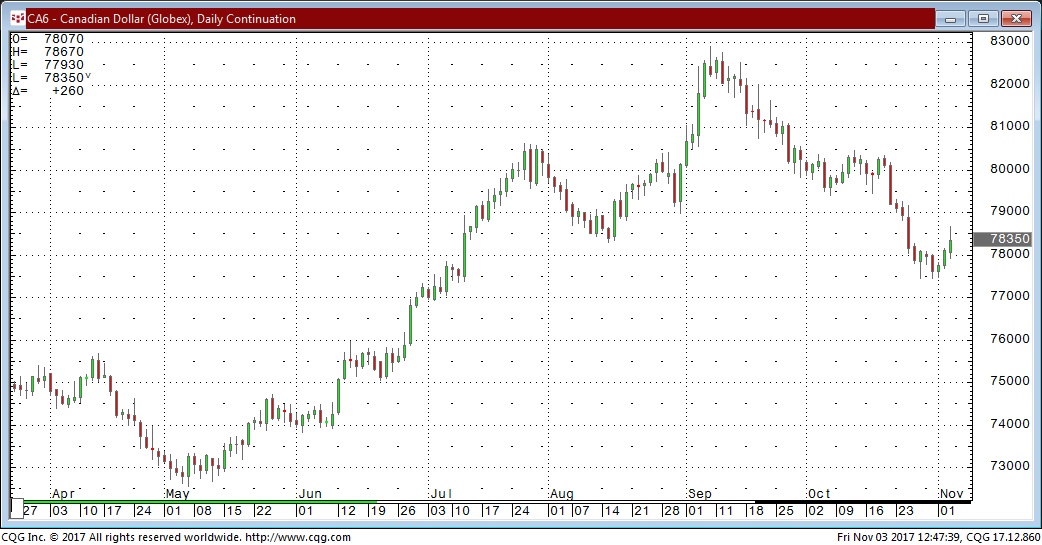
The Canadian Dollar: One of the primary drivers of CAD-USD since May has been the 2 year interest rate spread. At the May CAD lows the spread was 65 points in favor of the USD, at the Sept 8 Key Turn Date the spread was 25 points in favor of CAD. Since early September the spread has gradually gone in favor of the USD and for the past week or so has hovered around 20 points premium USD. The 180 degree pivot by the Bank of Canada in early June, and the subsequent “backing away” by the BOC in September obviously influenced the interest rate spread and thus the FX rate. BOC Governor Poloz spoke before Parliament this week and maintained a “worried” tone. The correlation between CAD and WTI, which has been important for much of the past couple of years has been practically non-existent the past few months.
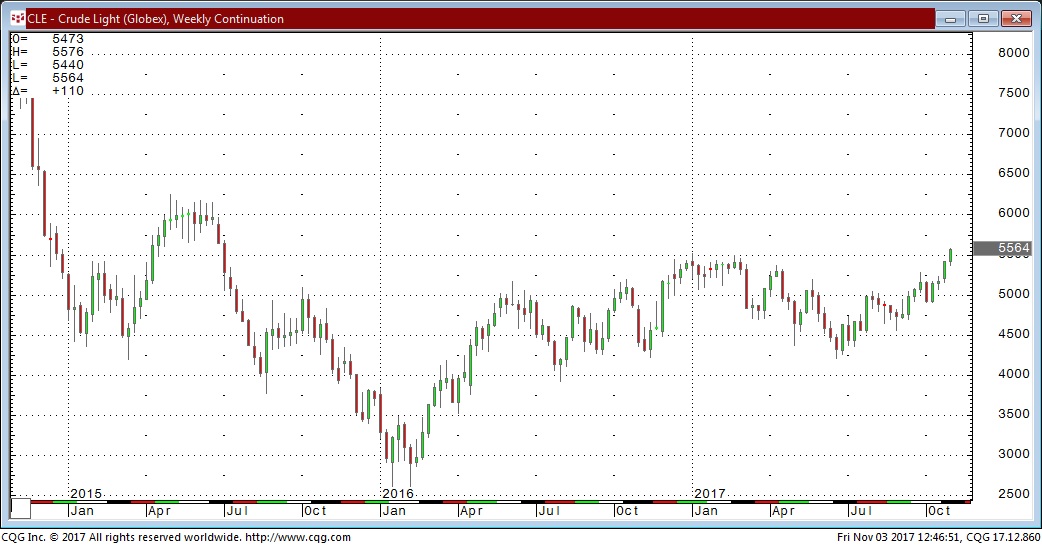
WTI: following the OPEC production cutback agreements in November 2016 and the OPEC/Non-OPEC agreements in December 2016, front month WTI topped out around $55 in January and February 2017 (I wrote that the crude oil bullish news had reached “As Good As it Gets” back then) and WTI began a stair-step decline to $42 in June. Since that June low market sentiment swung to believing that the cutback agreements have indeed reduced global supply below global demand, thus shrinking the inventory overhang, and prices have risen…with WTI closing above $55 this week for the first time in over 2 years. Rumors that the agreements will be extended when OPEC meets on November 30 have helped fuel the rally. It’s interesting that crude oil has rallied over 15% since early September even as the USD has risen against nearly all currencies. Crude oil, in other words, is rallying in terms of all currencies…a hallmark of a strong bull market.
My short term trading: My current core trading idea is that the USD made an important turn higher on September 8 after falling about 12% from a 14 year high in January. All of my trading since early September has been based on this core idea. CAD: I got short the week following September 8 and essentially stayed short until last week when I went flat. CAD had dropped over 5 cents and I felt it was due for a bounce. I re-established an initial short position when CAD rallied on Friday’s stronger-than-expected Canadian employment report. Euro: I had established short Euro positions in mid-October on the expectation that it would fall through the neckline of the head-and-shoulders pattern that had begun in late July. I covered some of that trade last week and the balance this past Monday. I bought the US Dollar index this morning following the employment report. WTI: I have traded WTI almost exclusively from the short side for the past 3 years but have been on the sidelines for the past couple of months.
PI Financial Corp. is a Member of the Canadian Investor Protection Fund. The risk of loss in trading commodity interests can be substantial. You should therefore carefully consider whether such trading is suitable for you in light of your financial condition. In considering whether to trade or the authorize someone else to trade for you, you should be aware of the following. If you purchase a commodity option you may sustain a total loss of the premium and of all transaction costs. If you purchase or sell a commodity futures contract or sell a commodity option or engage in off-exchange foreign currency trading you may sustain a total loss of the initial margin funds or security deposit and any additional fund that you deposit with your broker to establish or maintain your position. You may be called upon by your broker to deposit a substantial amount of additional margin funds, on short notice, in order to maintain your position. If you do not provide the requested funds within the prescribe time, your position may be liquidated at a loss, and you will be liable for any resulting deficit in your account. Under certain market conditions, you may find it difficult to impossible to liquidate a position. This is intended for distribution in those jurisdictions where PI Financial Corp. is registered as an advisor or a dealer in securities and/or futures and options. Any distribution or dissemination of this in any other jurisdiction is strictly prohibited. Past performance is not necessarily indicative of future results.

Very Definition of a Bubble
On November 2, Credit Suisse CEO, Tidjane Thiam jumped on the bubble bandwagon with this statement: Bitcoin Is the ‘Very Definition’ of a Bubble.
“From what we can identify, the only reason today to buy or sell bitcoin is to make money, which is the very definition of speculation and the very definition of a bubble,” he said at a news conference in Zurich Thursday. He added that in the history of finance, such speculation has “rarely led to a happy end.”
That’s a rather curious definition of bubble. Using the same rationale, every financial instrument meets the requirement. The only reason to buy any stock or bond is to make money.
Realistic Bubble Definition
Wikipedia Definition: “An economic bubble or asset bubble (sometimes also referred to as a speculative bubble, a market bubble, a price bubble, a financial bubble, a speculative mania, or a balloon) is trade in an asset at a price or price range that strongly exceeds the asset’s intrinsic value. It could also be described as a situation in which asset prices appear to be based on implausible or inconsistent views about the future. Asset bubbles date back as far as the 1600s and are now widely regarded as a recurrent feature of modern economic history Historically, the Dutch Golden Age’s Tulipmania (in the mid-1630s) is often considered the first recorded economic bubble.”
It Cannot Be a Bubble
On August 15, John McAffee on Business Insider wrote: Here’s why you can’t call bitcoin a ‘bubble’.
Curiously, McAffee provided no reason. He did offer a preposterous belief: “I believe that the blockchain is, even now, ushering in a new economic and social paradigm that will rival, if not exceed, the impact that agriculture had in human society.”
The claim blockchain will exceed the importance of agriculture is ridiculous. Even if I am wrong, let’s not confuse the technology with the coin.
Railroads, cars, television all brought tremendous change. History shows bubbles formed around those activities as well.
Four Reasons
The Economic Edge provides 4 Reasons Why Bitcoin Is Not In A Bubble.
- It is decentralized. This is huge! It means that it is not under the control of central banks, and thus cannot be manipulated directly by them. This is THE MOST IMPORTANT aspect, it is a game changer as it changes the WHO is behind it – something that gold and silver do not do because central banks have printed “money” to buy the majority of it.
- Unlike tulips, dollars, or even precious metals, Bitcoin is strictly limited in its supply. This is where the math comes in. Bitcoin was founded in 2008 and there will ultimately be only 21 million Bitcoin ever mined. Today we are approaching the 80% mark, the remaining 20% will take years to mine, and the “mining” gets more difficult and slow as we go.
- Bitcoin is a better store of value because it is secure. Decentralization and encryption make it secure. It can be stored in electronic cyber “vaults” where you keep a hard copy of the encryption cypher. This means that your exchange can be hacked, your computer hacked, but your bitcoin don’t actually reside in either! They reside on someone else’s computer somewhere – and only you have the code to get to it. Thus they cannot be confiscated by a government, a banker, or a hacker.
- Bitcoin transactions are stored on a public ledger, all confirmed transactions are included in the blockchain. Again, decentralized bookkeeping is less vulnerable and more secure than centralized legers. This is where Ethereum, another blockchain currency, shines. Ethereum is built upon an encrypted ledger and can be used for many purposes, not just as a currency.
Once again, the writer confuses the technology with the coin. The encrypted, distributed ledger has many uses for sure. That does not imply bubbles are impossible.
Bitcoin’s history as a “store of value” is less than a decade. Gold’s store of value history dates back centuries.
When gold has been available, it has always been the preferred currency.
Five Reasons
iAngels writer Shelly Hod Moyal provides Five Reasons Why Bitcoin is Not a Bubble.
Three of the five iAngels reasons are similar to what’s discussed above, so let’s take a look at the other two.
Reason 1: The single most important feature for money to be real is for people to believe in it and to want it. There is a real utility here as people are actively using it to store value and use it to pay for goods. Just look at Japan’s massive adoption of Bitcoin and the suggestions that several major Japanese banks will start trading Bitcoin as a currency like the yen, dollar and euro. Moreover, in the long run, the complexity of Bitcoin will not have a negative impact on adoption. Only rarely, do users understand the underlying technology of the products and services they use (e.g. the internet).
Reason 5: When modelled using “the quantity theory of money” the value price of Bitcoin is justified. In our calculations, we do not include 1) lost coins due to loss of private keys or willful destruction and 2) coins that are HODLed. We do this, because in any given year these coins are not in circulation and therefore not available to the crypto-community. According to a study conducted by ARK Investment Management LLC & Coinbase, between 2012 and 2016, on average 54% of Coinbase users only purchased or held Bitcoin during the year and approached the cryptocurrency strictly as an investment. In addition, back in 2014, John W. Ratcliff concluded that around 30% of existing Bitcoins are lost, equating to 25% of existing coins today. Adding these figures together, we conclude that around 80% of outstanding Bitcoins are inactive. Given the average daily transaction volume of around $1 billion, the price of a Bitcoin today can be justified even when excluding discounted future expectations.
Moyal notes “Most coins, are held by a few individuals, the so called “Bitcoin Whales” (around 3% of existing Bitcoin addresses hold approx. 97% of all Bitcoins in circulation). Therefore, as an investor, you need to be aware that the market could be manipulated by just a few. This can result in an event called “Slaying of the Bearwhale” in the Bitcoin scene. For example, on October 6th, 2014, somebody sent 26,000 Bitcoins to Bitstamp in order to sell.”
Theory of Money
The theory of money thesis implies that everyone will want to own bitcoins. At best, that’s quite a leap of faith.
I heard the same argument regarding gold countless times. The argument is on the lines of “If people just put 2% of their assets in gold, it will hit $10,000.”
Bitcoin supposedly will hit $1,000,000 when everyone gets in.
Market Bipolarity
Daniel Mark Harrison says “It’s Impossible for Bitcoin to be a Bubble“.
His reason, bipolar market theory, is the most convoluted reason to date.
Harrison’s bipolar market theory is based on:
1) George Soros Theory of Reflexivity
2) His own observations of how different thinking participants act in capital market cycles;
Got that? It’s impossible for Bitcoin to be a bubble based on the writer’s observations and interpretations of a theory attributed to George Soros.
Harrison concludes:
- Concepts we used to think of as fundamental economically speaking no longer apply.
- Equilibrium in digital currency markets is nothing but a theoretical fantasy as it cannot exist unless there is uni-polarity (which there isn’t).
- As a result of equilibrium being non-existent, “reversion to the mean” cannot be attained as there is no “mean” (merely bipolarity, with at best two kinds of “mean”, one being natural and one being artificial).
- As a consequence of no “mean” pricing structure there is no “bubble” therefore nor is there over- or under-valuation of asset prices – since if there is no equilibrium, no mean, and no reversion but rather pure reflexivity only, there is never a bubble in asset prices as the variable required to validate its existence is absent (a bubble, remember, can only be so when referred back to equilibrium).
Supposedly, economic fundamentals and concepts no longer matter, so there can never be a bubble. Yeah, right.
One More Reason – Commodity Theory
Tom Loungo provides one final reason Bitcoin cannot be a bubble in his report Ethereum, Mises and Why Cryptos are not a Bubble.
“Ludwig Von Mises spent a lot of time trying to figure out what money actually is. In the end he developed his Regression Theorem. In short, a thing can only rise to be money if it had value as a commodity before it became money,” says Loungo.
He links to the Mises Daily article Cryptocurrencies and a Wider Regression Theorem.
OK. So what?
Is Bitcoin a commodity? The answer is yes. It has value if for no other reason that people attribute a value to it.
Is Bitcoin money or function as money?
Bitcoin Myth
Austrian economist Frank Shostak tackles the Bitcoin Money Myth in an article also on Mises.
Observe that a bitcoin is not a thing; it is a unit of a non-material virtual currency. A bitcoin has no material shape; hence from this perspective, the notion that it could somehow replace fiat money is not defendable.
Bitcoin can function only as long as individuals know that they can convert it into fiat money, i.e. cash on demand (see, e.g., Lawrence H. White “The Technology Revolution And Monetary Evolution,” Cato Institute’s 14th annual monetary conference, May 23, 1996).
Bitcoin is not a new form of money that replaces previous forms, but rather a new way of employing existent money in transactions. Because Bitcoin is not real money but merely a different way of employing existent fiat money, obviously it cannot replace it.
The fact that the price of bitcoins has jumped massively lately implies that people assign a high value to the services it offers in employing existent money. This is no different from the case when in a country which imposes restrictions on taking money out people will agree to pay a high price for various means to secure their money.
It’s fair to point out that Shostak wrote that assessment in 2013. One could have made millions investing in bitcoins at the time.
The true believers think millions more will be made.
Is Bitcoin Money?
Shostak makes a convincing case that Bitcoin is not really money. Nonetheless, let’s assume otherwise and return to Loungo argument of commodity usage.
In What Has Government Done to Our Money, a free download on Mises.Org, Murray Rothbard writes …
“Money is a commodity. Learning this simple lesson is one of the world’s most important tasks. So often have people talked about money as something much more or less than this. Money is not an abstract unit of account, divorceable from a concrete good; it is not a useless token only good for exchanging; it is not a “claim on society”; it is not a guarantee of a fixed price level. It is simply a commodity. It differs from other commodities in being demanded mainly as a medium of exchange. But aside from this, it is a commodity—and, like all commodities, it has an existing stock, it faces demands by people to buy and hold it, etc. Like all commodities, its “price”—in terms of other goods—is determined by the interaction of its total supply, or stock, and the total demand by people to buy and hold it. (People “buy” money by selling their goods and services for it, just as they “sell” money when they buy goods and services.)”
When gold and silver have not been available other commodities have functioned as money. Beaver pelts, salt, copper, cigarettes have all served as money.
Tulip Mania
Commodities sometimes reach speculative heights. Try using beaver pelts as money today.
Also, consider tulip bulbs. At the height of Tulip Mania, there were huge numbers of derivative contracts on tulips.
The details surrounding tulip mania are quite interesting. If you are a student of history or even if you aren’t you will enjoy Tulip Mania and Social Security Reform.
The article describes how the Dutch burgomasters revived tulip speculation by converting tulip-bulb futures contracts into tulip-bulb options.
Here is a portion of the conclusion:
The demand for rare tulips increased so much that regular marts for their sale were established on the Stock Exchange of Amsterdam, in Rotterdam, Harlaem, Leyden, Alkmar, Hoorn, and other towns. Symptoms of gambling became obviously apparent. The stock-jobbers, ever on the alert for a new speculation, dealt largely in tulips, making use of all the means they so well knew how to employ to cause fluctuations in prices. At first, as in all these gambling mania, confidence was high and everybody gained. The tulip-jobbers speculated in the rise and fall of the tulip stocks, and made large profits by buying when prices fell, and selling out when they rose. Many individuals grew suddenly rich.
At last, however, the more prudent began to see that this folly could not last forever. Rich people no longer bought the flowers to keep them in their gardens, but to sell them again at cent per cent profit.
Signs of Speculative Bubble
The above paragraphs apply at every bubble peak.
What also happens at every bubble peak is the true believers come out with a cornucopia of reasons why things are not a bubble.
So please don’t tell me that Bitcoin cannot be a bubble simply because it has commodity value or because convoluted interpretations of a theory by George Soros say so.
The main uses of Bitcoin are undoubtedly speculation, capital flight out of China, and money laundering.
I recall the dotcom bubble when speculators were clamoring for leap options on a company called JDSU. The day those options became available marked the top.
That bitcoin futures and ETFs are in the works are more signs of a speculative mania.
Art of Investing in Bubbles
ZeroHedge via the Speculative Investor has a nice article on Investing in Bubbles.
The worst-case scenario is to be a non-believer and non-participant in a bubble, but to eventually get persuaded by the relentless rise in price that special circumstances/fundamentals justify the valuation and that a large commitment is warranted.
But hey, don’t, worry about Bitcoin. Just accept it on faith that economic fundamentals and concepts no longer matter.
Totally New Paradigm
Those who “don’t get it” are branded as heretics, just as bubble views were in the housing bubble and the 2000 dotcom bubble.
It’s a totally new paradigm. It always is at every bubble peak.
But hey, we may not yet be close to the top. Seriously.
Perhaps things will things get as crazy as people standing in line overnight to participate in a lottery for the right to buy Florida condos in 2006. Then again, perhaps we are already at a similar junction.
One can never accurately predict when bubbles break.
Good Luck!
By Mike Shedlock


Our rendition of an Elliott Wave chart shown on the next page says it’s time to sell gold; i.e. once minor corrective rally Wave ii completes—that may be today). Targets lower are 1,210; then 1180-level. And if the US dollar catches a major bid, there is scope to test the swing low of 1,123 from mid-December 2016 (gold vs. dollar weekly chart page 3). Note: The 55-week gold to US dollar index correlation is a whopping -84.3%; i.e. as gold goes up, the dollar goes down, and vice versa.
Gold Futures Daily Wave Chart

Gold Futures vs.. US Dollar Index Weekly Chart

We should find out soon whether Mr.. Elliott is correct..
Regards,,
Jack Crooks, President, Black Swan Capital
jcrooks@blackswantrading.com
www.blackswantrading.com
772 – 349 – 6883 / Twitter: bswancap


-
I know Mike is a very solid investor and respect his opinions very much. So if he says pay attention to this or that - I will.
~ Dale G.
-
I've started managing my own investments so view Michael's site as a one-stop shop from which to get information and perspectives.
~ Dave E.
-
Michael offers easy reading, honest, common sense information that anyone can use in a practical manner.
~ der_al.
-
A sane voice in a scrambled investment world.
~ Ed R.
Inside Edge Pro Contributors

Greg Weldon

Josef Schachter

Tyler Bollhorn

Ryan Irvine

Paul Beattie

Martin Straith

Patrick Ceresna

Mark Leibovit

James Thorne

Victor Adair