
Energy & Commodities
Investors need to be concerned that the U.S. Stock Market is well beyond bubble territory as it has now entered into the final stage of a Super-Charged Tulip Mania. Not only are stock prices inflated well above anything we have ever seen before, but valuations are also reaching heights that are totally unsustainable. Unfortunately, these highly inflated share prices and insane valuations seem normal to investors who are suffering from brain damage as years of mainstream propaganda have turned the soft tissue in their skulls to mush.
Also, we are way beyond “Boiling Frogs” now. Yes, we passed that stage a while back. Today, the typical U.S. investor has been fried to death. Investors now resemble a super-crisp chicken-wing with very little meat on it but at least will offer, one hell of a crunch. Please realize I don’t mean to be harsh about my fellow investor. However, when I look around and see what 99% of the market is doing, it reminds me of a famous line from the movie Aliens. The star of the movie, after being found lost in deep space for many years, said the following in a meeting, “Did IQ’s drop sharply while I was away?”
We find out in the rest of the movie that the so-called Mainstream experts were totally wrong about their assessment of the situation. However, billions of dollars were still spent and many lives lost because high-level individuals infected with stupidity (in the Aliens Movie) still controlled the shots. No different than today.
Regardless, the U.S. Stock Market has entered into the last stage, which I call the Super-Charged Tulip Mania. In this stage, it wouldn’t matter if the North Koreans launched a nuclear missile and declared war on the rest of the world, the universe and all Aliens floating around in space. By God, the Dow Jones Index would look at these as a catalyst to reach the next important psychological level of 25,000 points. Reaching that new level wouldn’t really be that hard as the Fed would just need to hire a few dozen more trading geeks and provide them with an endless supply of Hot Pockets and Starbucks. Easy-peasy.
Okay… it’s time to get serious. Here are a group of charts that show just how insane the markets and valuations have become today.
JP MORGAN & CATERPILLAR: Exponential Share Price Increase & Insane Valuation
Let’s take a look at two of the companies listed in the Dow Jones Index. JP Morgan Chase has benefited immensely from the U.S. Government bailout of the garbage assets such as Mortgaged Back Securities after the housing and banking collapse in 2008. JP Morgan has seen its share price surge four times from $25 in 2012 to over $100 currently:
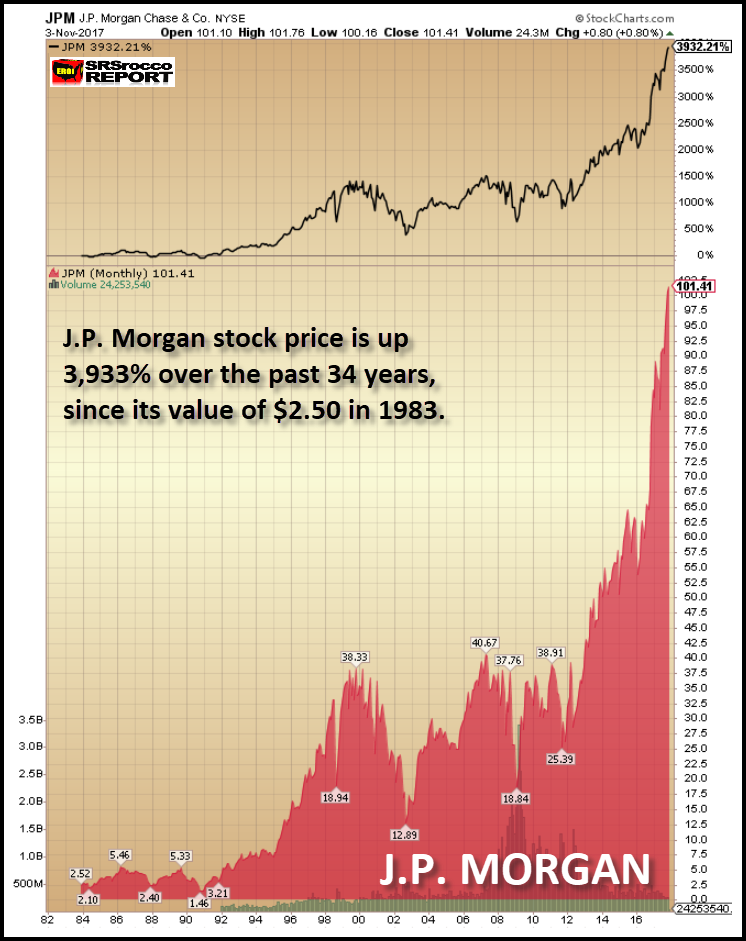
Furthermore, if an investor was lucky enough to buy a bunch of JP Morgan stock back in 1983 at $2.50 a share, he or she wouldn’t be complaining a bit today. JP Morgan’s stock price is up a stunning 3,933% over the past 34 years. If we look this chart, we can see that the share price is now moving up in an exponential trend. Sadly for JP, all exponential trends never last. While they may continue higher a bit longer, all will collapse sooner or later.
Another stock that has moved into the exponential territory, is Caterpillar. After years of falling sales, Caterpillar has emerged out of the ashes to increased sales, profits and with it… a skyrocketing share price:

Not only is Caterpillar’s share price up more than double to $137 since the beginning of 2016, but its current PE Ratio (Price to Earnings) is also at a staggering 95. Let me tell you, Caterpillar’s PE Ratio of 95 is nearly six times higher than its median PE Ratio over the past 13 years. Moreover, Caterpillar’s net income Q1-Q3 2007 was higher ($2.5 billion) than Q1-Q3 2017 ($2 billion), but its stock price was only $55 in 2007 versus the $137 today. So, what gives?
Again… these stock prices may continue higher for a while, but nothing heads up in a straight line for long.
APPLE STOCK: From Nose-Bleed To Outer-Space Brain Crushing Levels
It’s no surprise that Apple’s share price has reached a level that would make any Las Vegas bookie extremely jealous. And why shouldn’t it? What other company has actually brainwashed people into believing that they need to stand in line overnight to purchase the newest I-phone model at $1,000 a pop? Even though Caterpillar’s share price is up almost 3,000 percent over the past 36 years, who stands in line for a new Caterpillar Earth Moving machine? Or how about the latest Nike sneaker?
Amazingly, Apple’s stock price is up an earth-shattering 46,648% since it starting trading at $0.40 in 1984:

It is also quite astonishing to see Apple’s stock up more than 15 times at $172 compared to its low set in 2009 at $11. We must remember what was going on in the first quarter of 2009. The Dow Jones Index was falling to a gut-wrenching low of $6,600 as CNBC’s Mad Money, Jim Cramer was telling everyone that “There’s no end in sight to how far the market would fall.” Ole Jim was finally throwing in the towel. Back then, I also wondered how the hell did the CNBC talking heads could continue to get out of bed, get in front of the camera, and deal with what looked like the end of the world. What a difference in eight years… ah?
Today at CNBC land, there’s nothing but BIG SMILES and BACK SLAPS. Everyone is wondering when the Dow Jones will finally reach the 25,000 level. I gather all it would take to get us there would be the following three incidents; 1) A war with North Korean Nuclear, 2) A Saudi Arabia Royal Government Coup and, 3) A tidal wave that floods New York City.
THE DOW JONES & EXXONMOBIL: Watch Out Below!!
The Dow Jones and ExxonMobil are two of my favorite indicators which show that something is seriously wrong in the market. First, let’s look at ExxonMobil. While ExxonMobil’s stock isn’t moving up exponentially, as is Caterpillar, JP Morgan, and Apple, its share price is still well above its ratio to the oil price. If we go back to 2005, when the oil price was trading the same as today, ExxonMobil’s share price was only $35. However, ExxonMobil’s share price is over $83. You can see the oil price (BLACK line) versus ExxonMobil’s share price (PURPLE area):

While it’s true that ExxonMobil’s share price has increased as a result of its massive stock-repurchasing program over the past decade, the company also spent over $220 billion in profits to reduce its outstanding shares from 6.3 billion in 2005 to 4.2 billion currently. Thus, the company management thought it was a better decision to spend nearly a quarter of a Trillion Dollars to buy back its stock, rather than to use it for exploring, developing and producing more oil.
For ExxonMobil to finally be able to enjoy a tiny bit of free cash flow this year after it paid its shareholder dividends, it had to gut its capital expenditures by nearly two-thirds since 2012. By cutting its capital expenditures by $22+ billion, how does it expect to replace its oil reserves going forward? Good question. However, there isn’t a good answer as the low oil price has put the U.S. oil industry into a severe predicament with no real solution.
If Americans understood how dire the situation has become in the domestic oil industry, they wouldn’t be pushing up the value of the Dow Jones to new record highs. Why? Without energy, there is no economy or financial assets. Sure, if we went back to using human and animal labor, there would be some small valuations. Maybe the Dow Jones Index would be trading at say 100-200 points, but nowhere near the 23,500 level today.
The Dow Jones Index chart below shows how one index can become a Super-Charged Tulip Mania while the other index can be driven down to bottom-basement cesspool levels:

First, can you imagine owning the Dow Jones Index trading at a measly 850 points in 1981? It took the Dow nearly a century to reach 850 points in 1981, but it was able to increase 850 points in the past two months. Amazing things can happen to market prices and valuations when we have massive Central Bank money printing, Mainstream propaganda and societal brain damage.
Second, as the Dow Jones Index reached 23,500 points, the VIX Index (volatility) fell to a new record low of 9.14 (shown at the bottom right-hand side of chart). Think of these two indexes as an oversized stretched rubber band. At some point, the rubber band will snap back, and the fun will begin.
THE UNLOVED METALS: No Bubble Here… Just A Lot Of Frustration
While the first group of charts provided clear evidence of bubbles and tulip manias, this last group reveals quite the opposite. And out of the three following metal charts, silver is by far, the most unloved. Yes, that’s correct. A metal that has been money for more than 2,000 years has performed the worst when we compare it to copper and gold. Let’s take a look at copper first.
Even though the copper price had fallen from its high back in 2011, it has surged over 50% in the past two years. However, if we go back to 1981, the copper price is only up 312% over the 36-year period:

In 1981, the copper price was trading at $0.75, but today with all the massive money printing, the king base metal is only trading at $3. Now compare the 312% increase in the copper price since 1981 versus the Dow Jones Index at 2,548% and Caterpillar at 2,990%. Thus, it paid much more handsomely to invest in industrial stocks than in copper over this 36-year period.
Now, if you think copper under-performed the stock market, wait until you see gold. The gold price today is only up 217% since it was traded for $400 in 1981:

I would imagine some precious metals investors would claim that taking the $400 figure (1981) as a baseline would be disingenuous as gold was coming off its high in 1980. Okay, I will give you that. But, even if we used the low of $275 set in 2001, the increase would still only be 350% during that 16-year period. Thus, gold’s 350% increase from its low in 2001 is still anemic compared to gains made by the Dow Jones Index or the other stocks mentioned above.
Either way, both copper, and gold have severely underperformed the gains experienced in the broader markets. Sadly, it’s even worse when we look at the last metal in this group. While copper and gold at least enjoyed triple-digit percentage gains over the past 36 years, the current silver didn’t hasn’t even surpassed double-digit gains. As of the end of trading last week, the silver price had only gained a paltry 99% from its trading level of $8 in 1981:

This chart reveals the frustration felt by many silver investors. However, there is a good side to this story. And that is… BUBBLES POP while DEPRESSED ASSETS SURGE. You have to think about the metals in this fashion. Gold and silver are behaving like the VIX. The more the VIX index goes down, the more the stock market rises. But, when the bubble markets finally pop, then the VIX will shoot back higher (as seen in the RED SPIKES in the DOW chart above), taking the precious metals prices up with it.
This next market crash will not resemble anything similar to what took place during the 2008-2009 U.S. banking and housing market collapse. When the markets cracked in 2008, EVERYTHING went down together. Instead this time around, as the markets tank the precious metals will surge to new highs. We must remember, there really isn’t much in the way of safe assets to move into during the next market crash. So, as investors flee from bloated STOCKS, BONDS, and REAL ESTATE, to the tiny gold and silver market, fundamentals won’t matter either… LOL. Yeah… we could see some ridiculous high gold and silver prices as investors finally receive precious metals religion.
Check back for new articles and updates at the SRSrocco Report.

 This past week, we experienced yet another horrendous terrorist attack in New York City. And, amazingly, just like what occurred after several other terrorist attacks that have been experienced over the last year, the market rallied right after the attack.
It has almost gotten to the point that people now expect the stock market to rally after a terrorist attack. Have we really become this warped in our thinking? Must we hold fast to ridiculous notions that news is what drives the stock market to the point that we have to resign ourselves to believing that the market will rally “because” of a terrorist attack? Do you not see how ridiculous these perspectives really are?
Yet, if the market dropped after a terrorist attack, there is no question in my mind that every analyst and their mother would be absolutely certain that the market dropped specifically due to the terrorist attack. Every article the next day would have been pointing to the attack being the definitive “cause” of the market drop. And, if I then challenged this false exogenous causation theory, the response I would receive is “don’t you believe your eyes?” Yet, not a single analyst dares to suggest that the markets are rallying because of news of terrorist attacks despite seeing many instances of this occurring over the last two years. Do, they not believe their eyes?
Are you starting to see my point yet? Do you see through the intellectual dishonesty of maintaining these old perspectives of what moves the market?
I cite this study often, but I think the recent rally after the New York attack should drive this point home even further. In August 1998, the Atlanta Journal-Constitution published an article by Tom Walker, who conducted his own study of 42 years’ worth of “surprise” news events and the stock market’s corresponding reactions. His conclusion, which will be surprising to most, was that it was exceptionally difficult to identify a connection between market trading and dramatic surprise news. Based upon Walker’s study and conclusions, even if you had the news beforehand, you would still not be able to determine the direction of the market only based upon such news.
And, this past week’s stock market action further supports Mr. Walker’s conclusion. But, we have to begin to look at markets in a more intellectually honest manner in order to be able to see it. However, I am quite certain that the next time a news event coincides with a market move, all the usual suspects will be out front screaming how the news event was the certain cause of the market movement. And, therein lies the intellectual dishonesty inherent in most financial reporting and analysis today.
Price pattern sentiment indications and upcoming expectations
Before I begin this week’s expectation, I want to make a point about last week’s analysis. I noted that if the 2572SPX level broke early in the week, it opened the door to a drop down to lower support in the 2520-50SPX region. Many seemed to read that as suggesting that a break of 2572SPX would certainly drop us to the lower support region. But, that is not how Elliott Wave analysis works, nor is it how we use it to set up trades. Allow me to explain.
You see, a standard impulsive wave structure targeting the 2611 region directly had that 2572/74SPX region as support which would have taken us directly to the 2611SPX region this past week. However, the break down below 2572 added more complexity to the pattern.
In order for the break down below 2572SPX to point us down to the lower support, we would have had to see a 5-wave impulsive structure break below 2572SPX, which would then suggest we are heading down to our lower support region. However, the drop below 2572SPX only provided us with a 3-wave drop, which is most often viewed as a corrective drop. But, it also meant that we had to prepare for much more volatility and whipsaw because the upside structure then morphed into what we call an ending diagonal. That structure provides for the volatility and whipsaw for which we had to prepare, and which the market provided us for the rest of the week.
So, as I presented in a blog write up a few weeks ago, Elliott Wave analysis is to be used in logical progression, which is why we always provide our analysis within an if/then context. And, while we broke below 2572SPX, and it “opened the door” to drop down to the 2520-50SPX region below, the market never provided the requisite set up pointing down there after we broke 2572SPX, which caused us to continue to look higher within our primary structure.
But, based upon earlier break of 2572SPX, and the further overlapping nature of the market structure, there is much more complexity in this structure, which can provide us with further whipsaw before a top is struck. If the market should break 2570SPX in the coming week, it makes it much more likely that this break will have us target at least the 2555SPX region, with potential to drop as deeply as the 2520SPX region. But, that will still set us up for a rally back up towards the 2600+ region. However, as long as the market maintains over 2570SPX, I still see us heading to the 2600+ region before this wave (3) rally off the February 2016 lows can even be considered completed.
So, I would complete the title of this article by saying that nothing can bring down this market except when we finally complete this structure for wave (3).
By Avi Gilburt, ElliottWaveTrader.net

 Well, we knew this was coming. Somewhat. After a lot of deliberation over the spring and summer, the Office of the Superintendant of Financial Institutions has come out with new regulations that will make it harder to qualify for mortgages once again. There are a few changes, most which are minor, but one major change that will impact about a large number of borrowers in Canada. These changes will be coming into effect Jan 1, 2018.
- For conventional mortgages (20% or more down payment or equity) the qualification rate for all terms is now either the Mortgage Qualifying Rate (MQR, currently 4.99%) or 2% higher than the rate, whichever is higher.
- Lenders are to enhance their Loan-to-Value ratios (the percentage of the home value you can obtain financing for) so they are reflective of the local housing market. For example, smaller communities may find they have more limited options as these are considered higher risk.
- Lenders will be restricted from offering combination mortgages (1st and 2nd combinations) to circumvent guidelines. Some lenders for instance would offer a 1st mortgage to 75% or 80% and a 2nd to 85% which allows them to qualify the 1st mortgage using their own looser guidelines instead of tighter insurer guidelines.
How do these rules affect you?
The most important of these is of course the reduction in borrowing power with 20%+ down. With the new rules, buyers will find their borrowing power stripped by about 20%. In Vancouver, where home values often exceed $1mil, this could reduce borrowing power by $200,000 or more! Although there has yet to be official word on whether contracts written prior to Jan 1, 2018 will be grandathered under the old rules, we expect they will follow previous protocol and those with existing contracts will still be able to qualify under the old rules.
Also, interestingly, Credit Unions are provincially regulated and are not affected by these changes. We have been doing a lot of business with Credit Unions since 2012, when the mortgage changes really started coming fast and furious. As of right now, the Credit Unions will still be able to qualify you after Jan 1st under current guidelines. But it is important to note that once the Credit Unions get flooded with a ton of business that the banks can’t do anymore, they are likely to scale things back to balance their books like they have in the past. They may do this by either changing/reducing policy or by surcharging certain products (like 35 year amortizations for instance).
What do you need to do NOW?
- If you have a pre-sale that completes later than Dec 31,2017, we NEED TO TALK! We want to make sure you are grandfathered as you may not be if you do not have an application in before the new rules come into effect. We may also be able to secure a long term rate hold for you.
- If you need to access your home equity for any reason in the next few years, you should consider refinancing now. You may want cash for a number of reasons:
- Renovations
- Access to capital for future investing in real estate or other investments
- Early inheritance for your children to purchase their own residence
- Self employed borrowers looking to increase liquidity
- If your renewal is coming up soon
- If you are planning on purchasing something soon with 20%+ down. You should get pre-approved now and start shopping unless you have a lot of breathing room between what you qualify for and what you plan on buying.
Summary
Well, the government is at it again. But what they are trying to do is slow the housing marketing without having to use interest rates as a tool, as raising rates would negatively impact many other things, particularly commodity exports.
The key to remember here is that although it is making it harder to OBTAIN the asset, these rules are being put in place to PROTECT your asset value from a meltdown like what happened down in the US. The more qualified buyers are, the lower the chances of a real estate crash.
Call us today to learn more about how these rules affect you and create a plan of action. Time is low, so it’s important you take action today. 604-229-5515, Kyle@GreenMortgageTeam.ca.
Financial bubbles are the office Christmas parties of the investment world. They start slowly, with a certain amount of anxiety. But they end wildly, with acts and decisions that in retrospect seem really, really stupid.
Millions of people out there still bear the psychic scars of buying gold at $800/oz in 1980 or a tech stock at 1,000 times earnings in 1999 or a Miami condo for $1,000 per square foot in 2006.
Today’s bubble will leave some similar marks. But where those previous bubbles were narrowly focused on a single asset class, this one is so broad-based that the hangover is likely to be epic in both scope and cumulative embarrassment.
This series will create a paper trail for the morning after, starting with a truly amazing anomaly: European junk bonds now yield less than US Treasury bonds.
European junk bonds offer just 2 per cent
(Financial Times) – High-yield debt belies its name as loose central bank policy skews credit markets The European high-yield market has seen €82bn of new issuance so far this year
A widely tracked index of European junk bonds is on the verge of breaking below the 2 per cent yield barrier for the first time, the latest indication that loose central bank policy has skewed credit markets.
The so-called “yield-to-worst” on ICE Bank of America Merrill Lynch’s euro high-yield index slipped to just 2.002 per cent on Thursday, an all-time low for what is the most commonly used benchmark in the European junk bond market.

The index is comprised of debt sold by companies whose credit ratings are on average below the investment grade threshold. The yield on the index was as high as 6.4 per cent as recently as January 2016, when a global sell-off in riskier assets severely knocked demand for European high-yield bonds.
Shortly after that, in March 2016, the European Central Bank announced it would buy investment grade rated corporate bonds under its quantitative easing programme for first time, kick-starting a strong rally in European credit.
The central bank has since purchased over €100bn of corporate bonds, which investors say has pushed investment grade bond fund managers to increasingly buy double-B rated bonds — the highest-rated category of junk bond. These double-B bonds make up around three-quarters of the European high-yield index.
“It’s really the double-Bs that are skewing the index, particularly after the latest ECB meeting,” said David Newman, head of global high yield at Allianz Global Investors. While the index’s yield is the lowest its ever been, the spread over government bonds is still higher than at the peak of the last credit boom. The index offers 240 basis points over government bonds at present, compared with just 178 basis points in mid-2007.
ICE BoAML’s euro double-B index offers a spread over government bonds of just 197 basis points, however. Mr Newman said analysis from Allianz shows the so-called “illiquidity premium” that investors usually demand to hold riskier high-yield paper has been closer to 300bp historically. “So at current double-B spreads you’re not being compensated for the illiquidity premium, let alone any defaults,” Mr Newman said. “There’s no margin for error basically.”
The collapse in yields has spurred record issuance of European high-yield bonds with Italian telecommunications group Wind Tre last week selling the largest euro junk bond on record.
The European high-yield market has seen €82bn of new issuance so far this year, according to JPMorgan credit analysts, which they note is “within touching distance” of the previous full-year record of €84bn set in 2014. The analysts add that the net supply figure is “still subdued”, however, particularly as a red hot market for leveraged loans has seen many companies replaced their bonds with loans instead.
Many investors are worried that this squeeze on net supply is spurring excessive risk taking, with a string of formerly distressed companies in the volatile retail sector recently raising new bonds, for example. “We’re going to break through 2 per cent on the index any day now,” said a credit analyst at an asset manager. “It’s difficult to be bearish in this market and unfortunately people are getting rewarded for being long the riskiest credits.”
There are so many terrifying factoids and data points in this article that it’s hard to know where to begin.
But the overriding theme is financial excess, beginning with governments that have overborrowed to the point that they can only function in a world where money is free.
This requires them to force down all interest rates by flooding the system with newly created currency, which then has to go somewhere. Everyone from money managers required to beat a target rate of return to retirees who need something on which to live are thus forced to lend money to crappy, high-risk companies.
This leads those companies — no fools despite their ugly balance sheets and/or anemic cash flows — to give the suckers what they want in the form of unlimited new borrowing.
The net result: A society that becomes more highly-leveraged by the day, in a classic Austrian School of Economics Ponzi finance orgy.
Or, to return to the opening metaphor, the final hour of a party with an open bar.

In deference to Mark Twain, I will review the USD, general stock market, precious metals, the electric metals and various other topics. In the past two weeks Rambus has been so prolific with such high impact charts that I find it a challenge to offer value added material so I offer charts with some different perspectives.
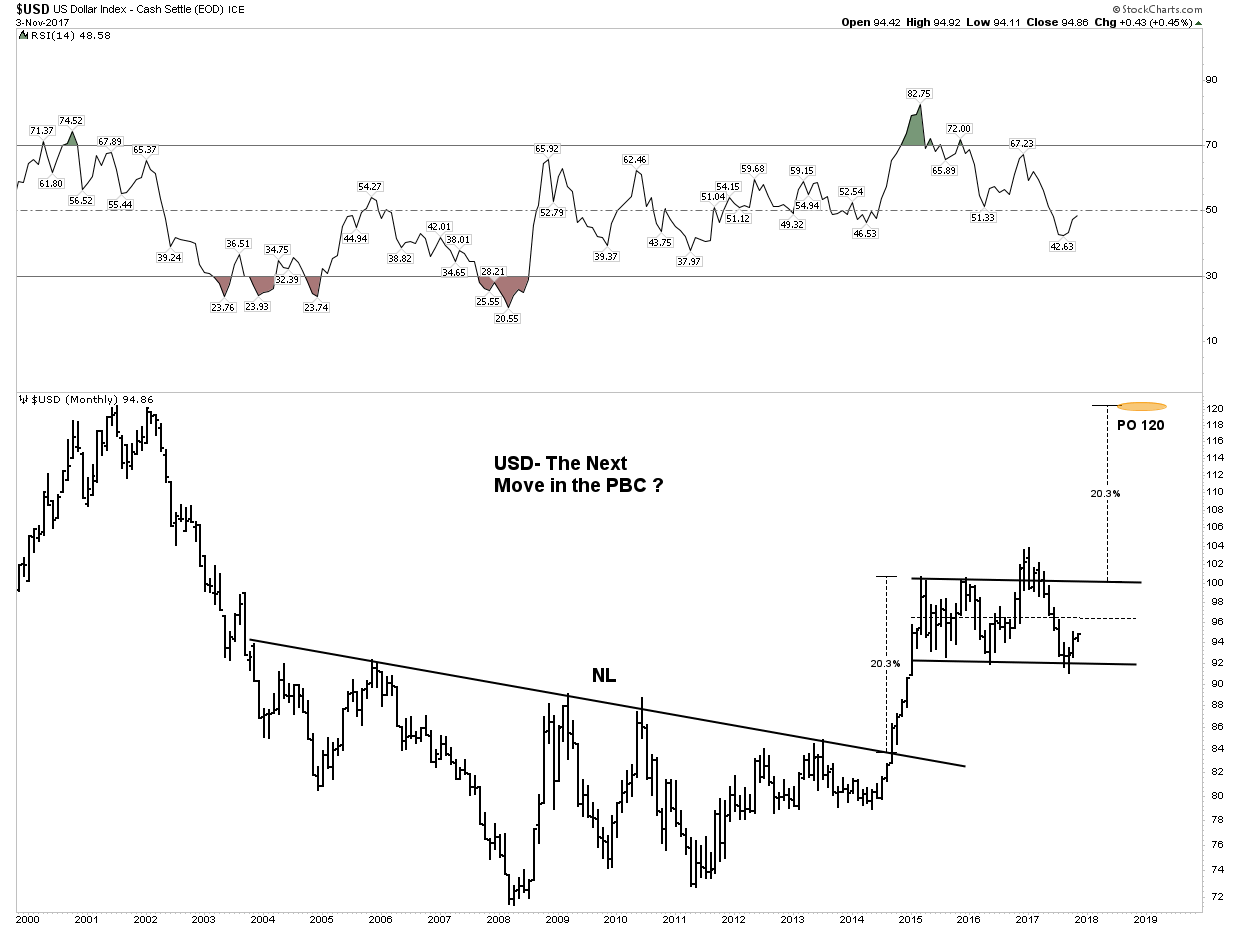
USD-No I Am NOT Dead Yet!
Currencies tend to be a very emotional subject. I try to be objective when analyzing them, sticking to the language of the market and it’s message. It is always important to guard against the gold bug narrative, it can even influence our views of currencies. Demanding posts insisting the USD is toast and immediately headed towards history’s ash heap seem closely related to this gold bug narrative. The USD has spent the first 8 months of 2017 in a well defined downtrend, however it does not appear to be in a death spiral. Actually the shouting and insistence that it must continue down has been a fairly predictable sign that its move downward was reaching its limit. The dollar may have now completed a base and is set to continue its move higher. This is not dogma as it could reverse downward, but for now it’s making all the right moves if the trend is higher.
Please review Rambus’ October 25 post on the USD as there is no other finer analysis anywhere:
I have often made the point that we are in a post bubble contraction. It began with the financial crisis in 2007, however the central banks of the world and their interventions have truncated the natural corrective process and re-inflated the bubble due to financial engineering. Ultimately, if robust growth is to ever return to the world’s economies the PBC must be allowed to do its work in de-levering balance sheets. Historically in the previous 5 episodes over the past 340 years, PBCs have taken 15-20 years to accomplish this. So this is a slow process and the 8 month downtrend of the USD in 2017 could just be a little wiggle that turns out to be just a correction in an ongoing up-trend. Time will tell of course. In a PBC, the senior currency becomes chronically strong and acts as a magnet attracting capital flows from around the world. Over the past year this economic principle has been very hard to accept, however it may be getting ready to reassert itself. I personally don’t trade currencies, however I watch them since they drive asset classes and knowing their trend gives us a clue of where these assets will themselves trend.
It appears we are at a crucial point in currency markets as the USD is beginning to reassert itself. Lets look at the various currency charts vs the USD:
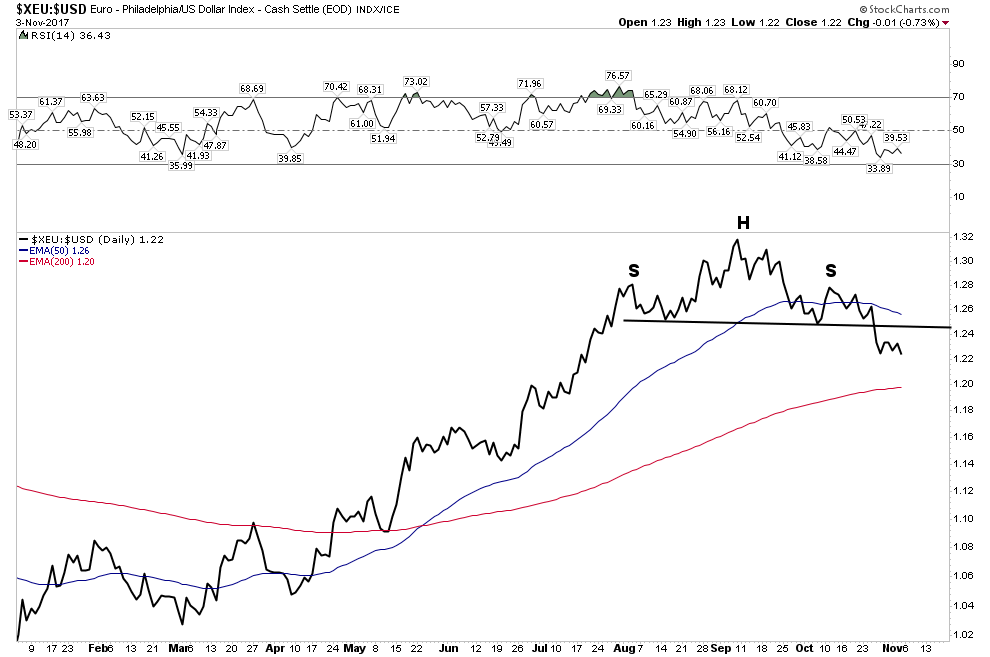
Euro- H&S neckline now broken:
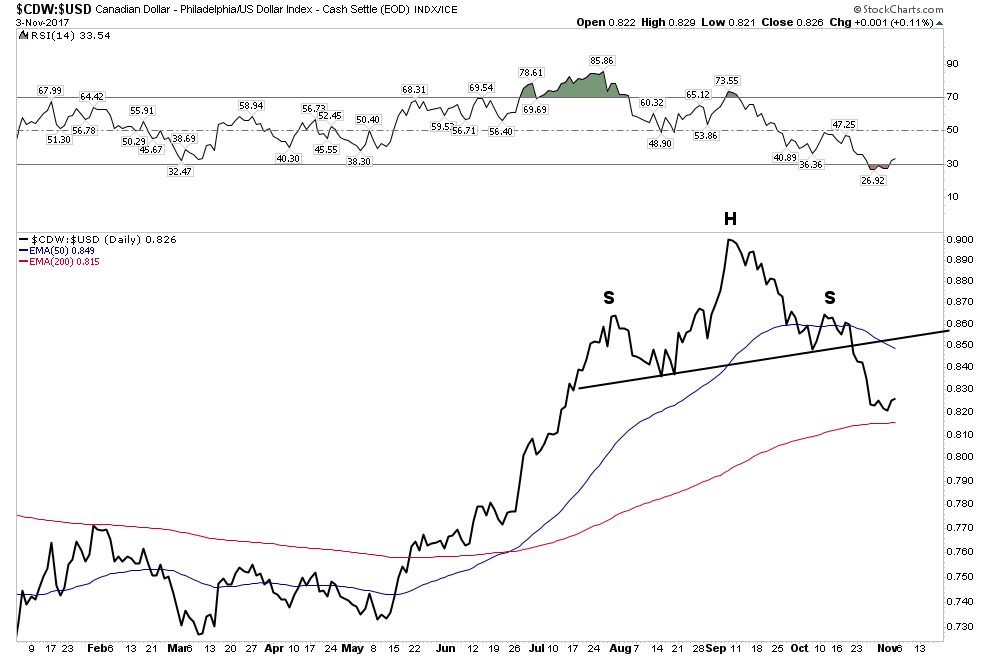
Canadian Dollar– The ultimate resource currency
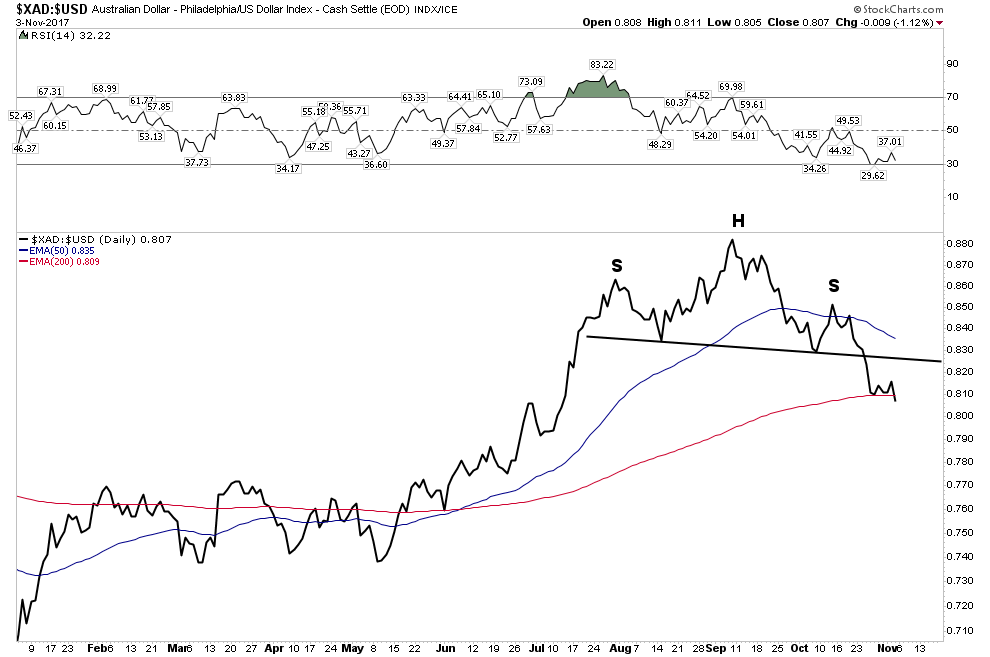
Aussie Dollar– H&S break with price now violating the 200 EMA
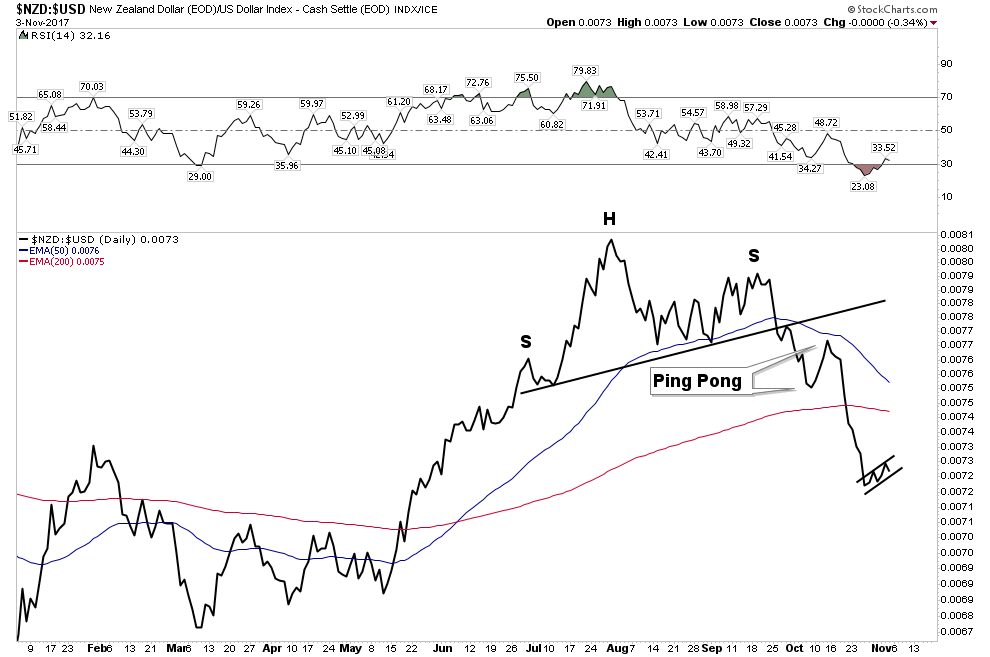
NZD– The first to show its hand
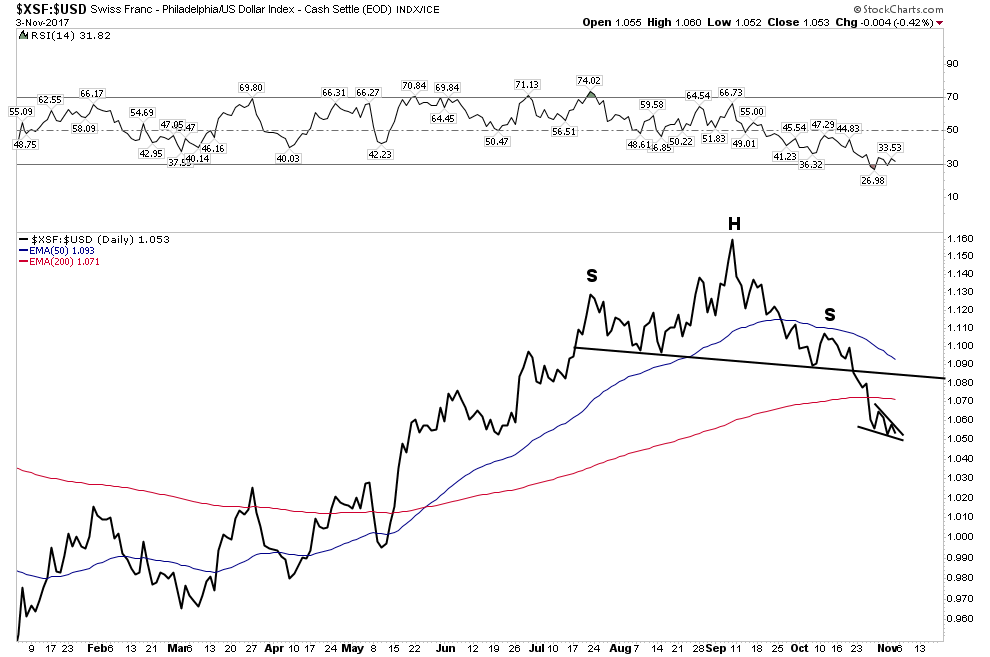
The Swissie: Et tu? Even the ultimate haven currency… 200 EMA violation.
South Africa Rand:
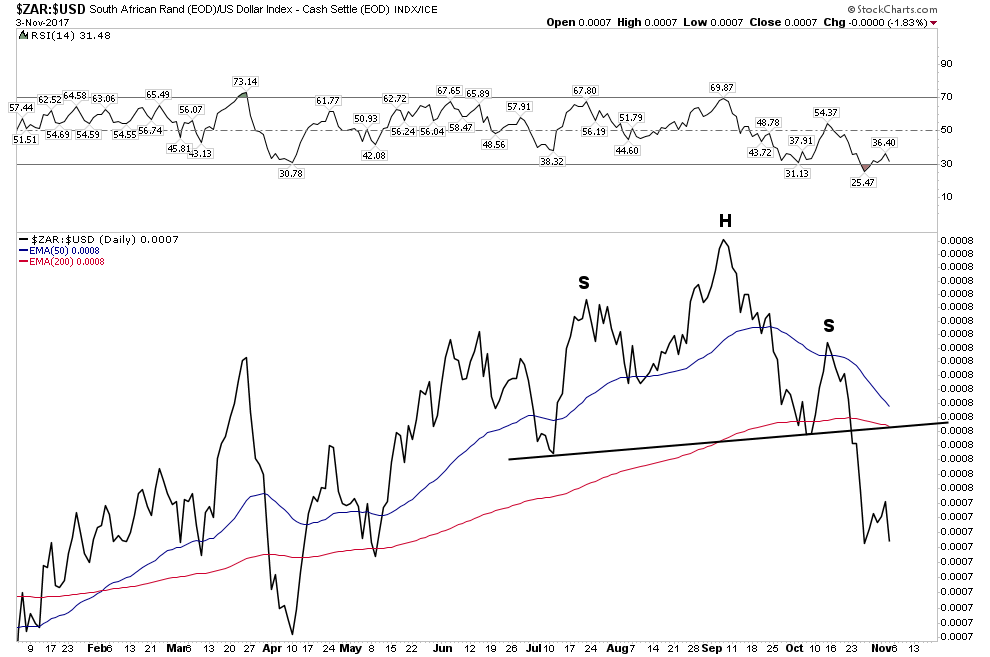
So one can see all of these currencies are now in a broad based breakdown vs the USD. The USD took some time to gain traction and it’s NOT out of the woods yet, but these charts show that it would take some work to reverse this initial trend reversal.
In the chart below we see how the USD has broken above its lower horizontal channel line and is now attempting to overcome the resistance of the 30 W EMA. Stochastics are indicating that it has the momentum to continue its move higher.
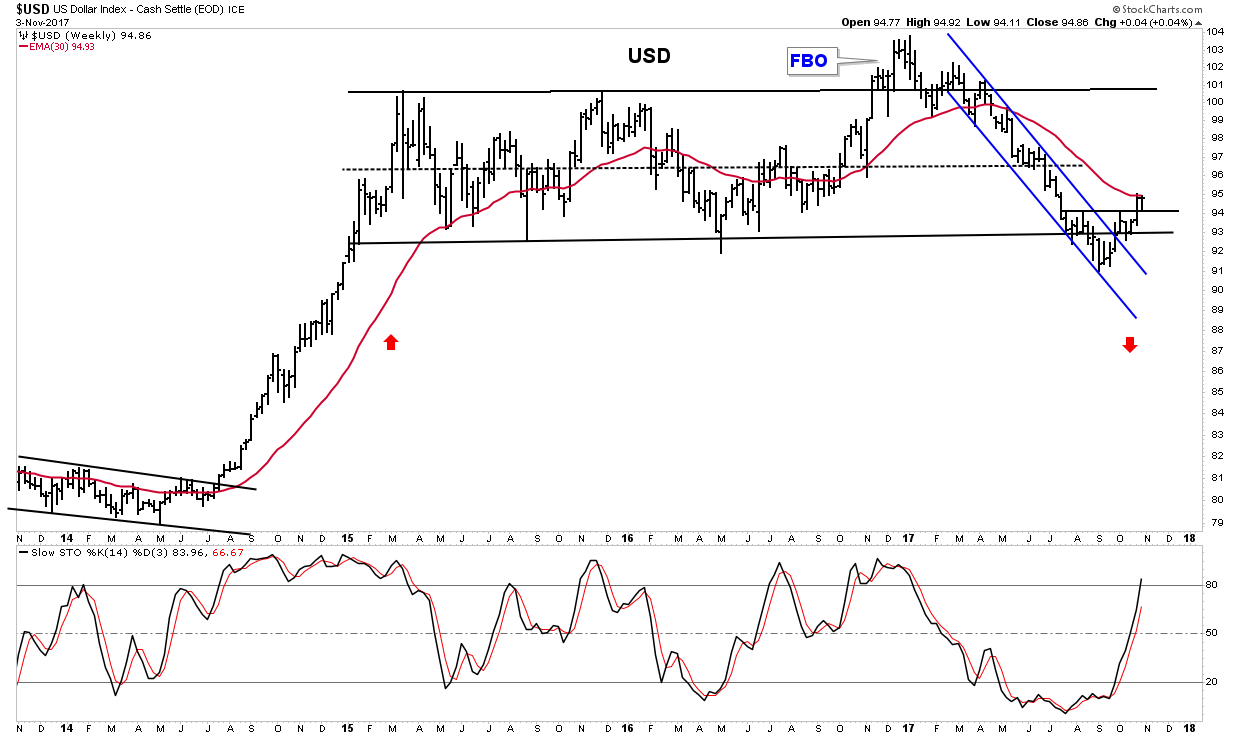
Below is the chart that has been subject to ridicule and derision, however it depicts what could occur when the PBC reasserts itself. It is certainly not a guarantee, however it shows what may lie in store.
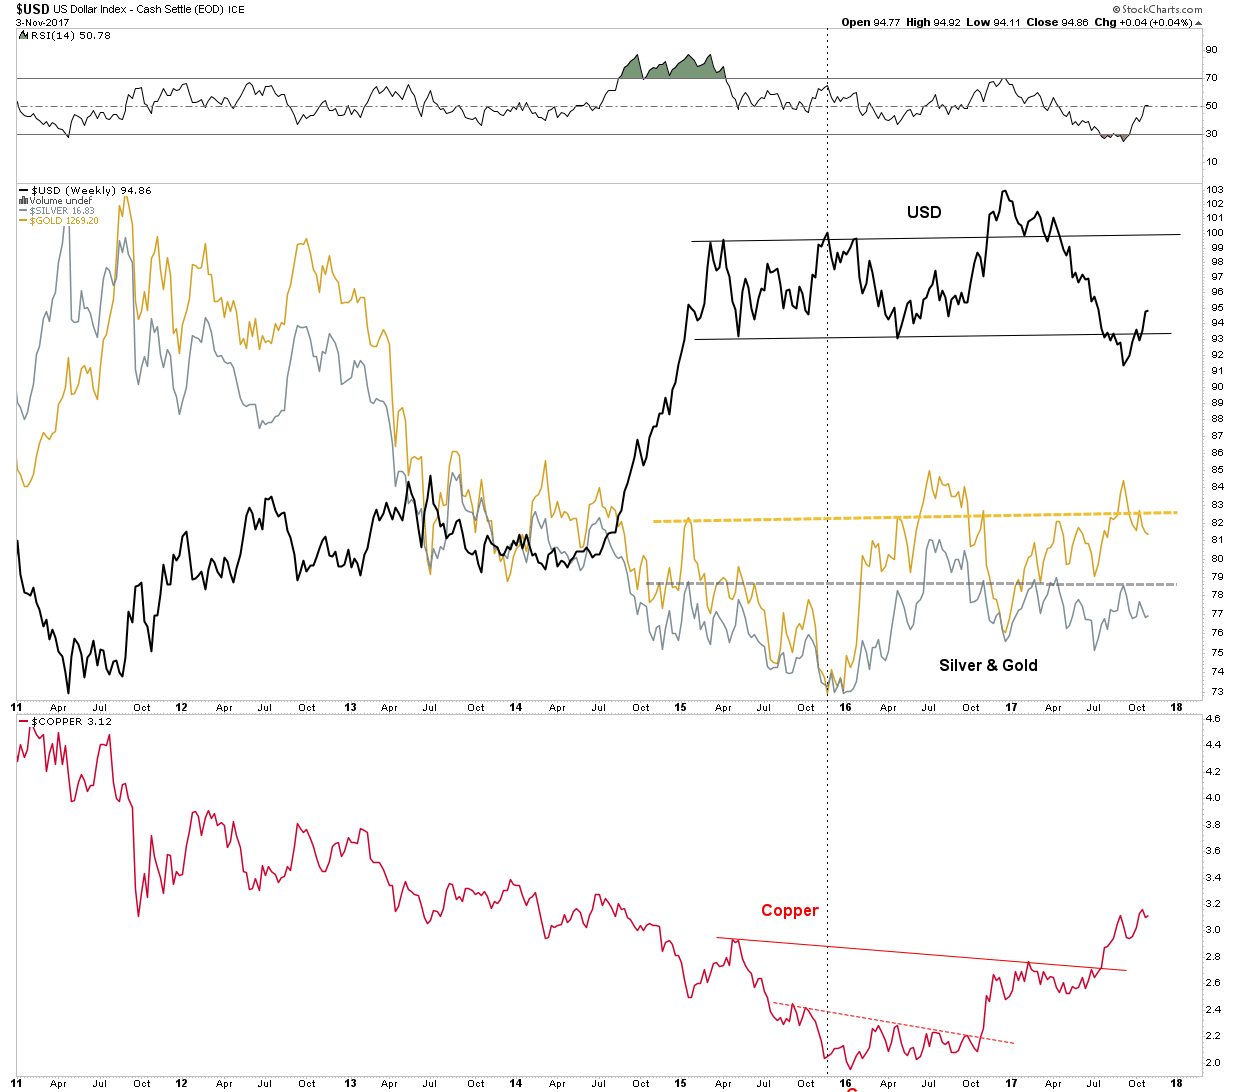
This next chart shows the relationship between the USD and the three metals: gold, silver and copper. It is hinting that if the USD continues to rally it could make it difficult for these three metals to advance much further:
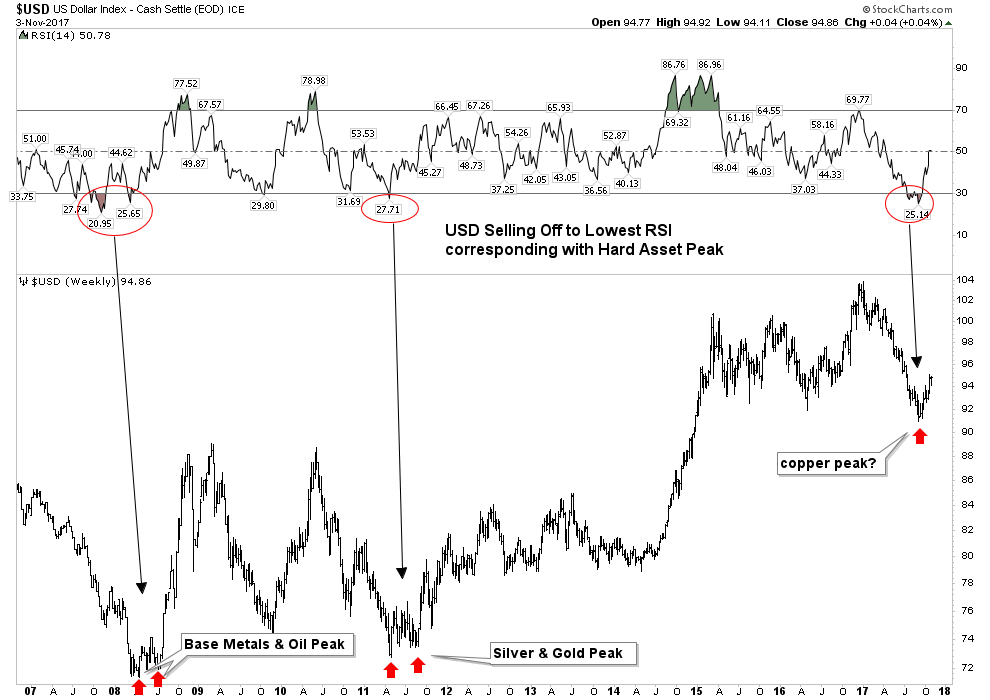
Finally, this USD chart poses the question: are the industrial metals getting ready to end their run for now? It seems that in the past when the USD reversed from being oversold on the weekly that was the message:
The Stock Market- From Here to Infinity?
Rambus has shown that the move upward in the stock market continues to be unimpeded. I would concur with the caveat that early next year it may peak and end the 9 year bull market, so far the second longest in history. Momentum is still powering higher, however internal deterioration has begun to be evident. Here is one possible scenario for the ultimate top:
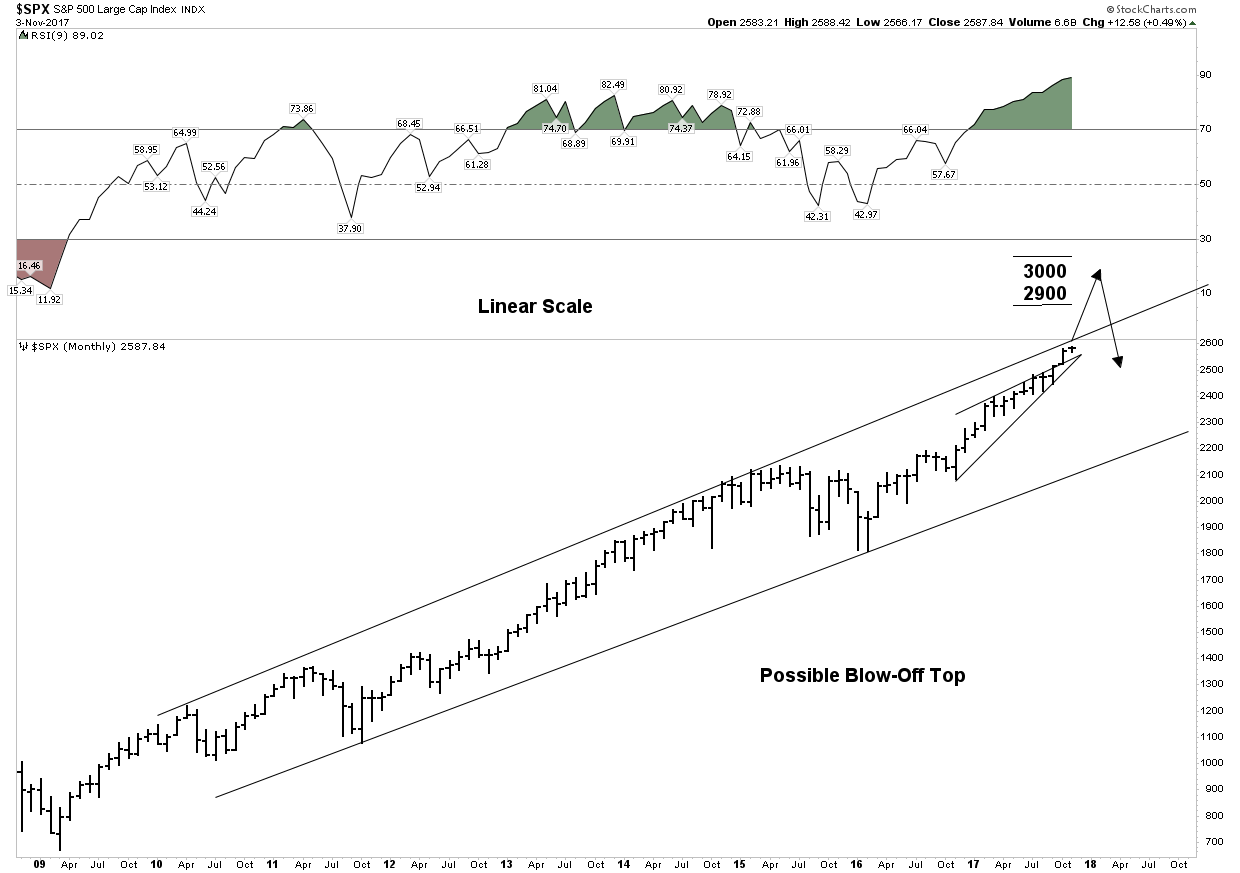
Above is a linear scale view of the 9 year bull market. It depicts a blow off top penetrating the upper trend channel with a target of 2900-3000. We see 3 phases to this bull market and the blow off would end the final phase III “mania”. Note the extreme reading in the RSI lending credence to this outcome.
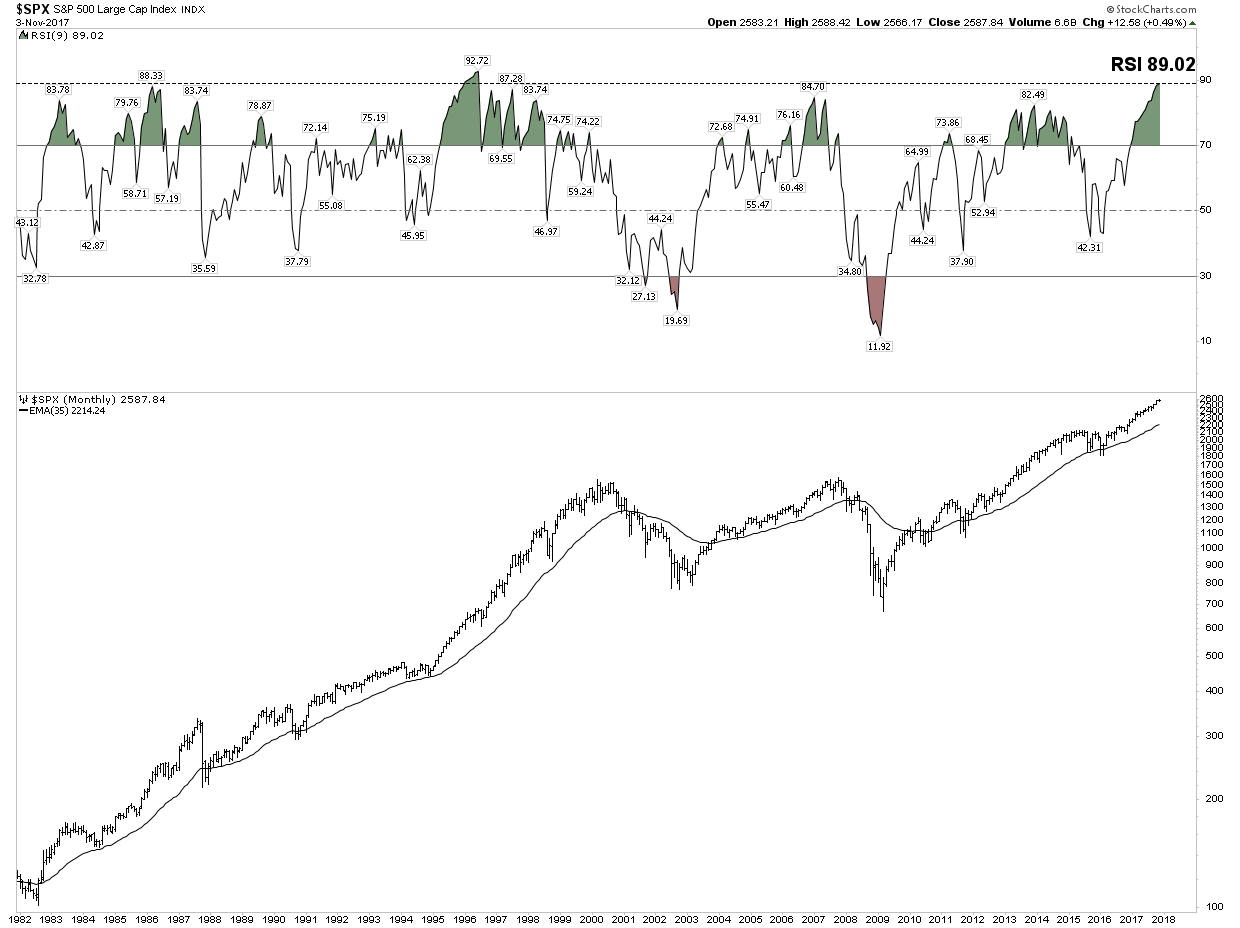
Below is a chart which highlights just how overbought and extended this market has become. It is a monthly view of the entire 36 year secular bull market. Note the RSI is now the second highest in the entire bull market. It is saying this relentless rise has reached a point where the RSI will limit its move.
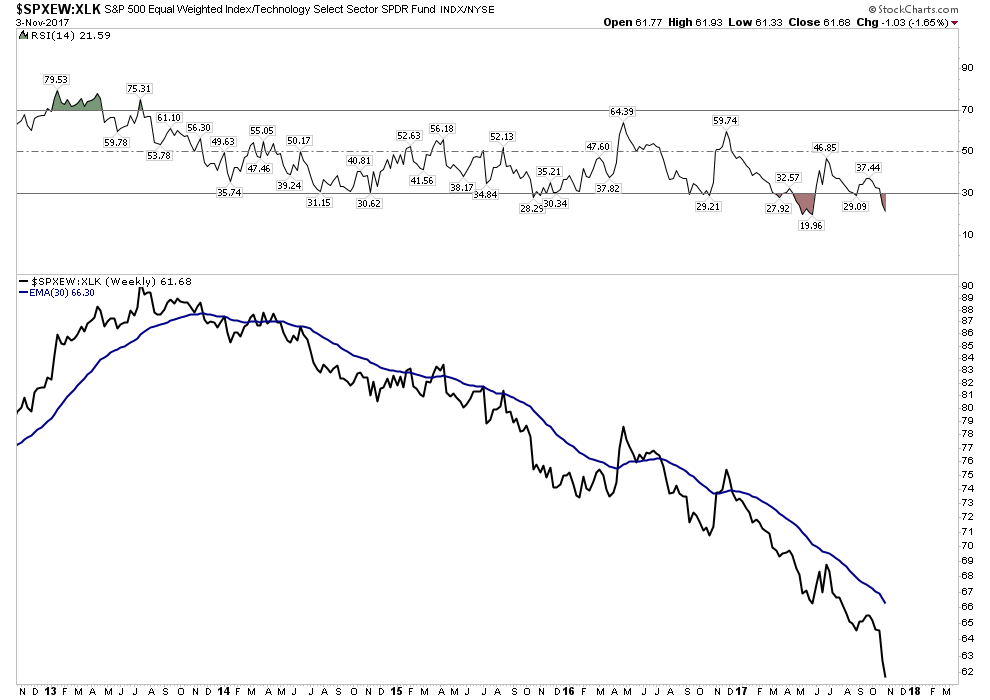
I would like to show just how narrow the advance has become. We all know how the FANG stocks have led the market. The XLK includes a heavy weighting made up of the FANGS and FANG-like stocks. The rise been relentless:
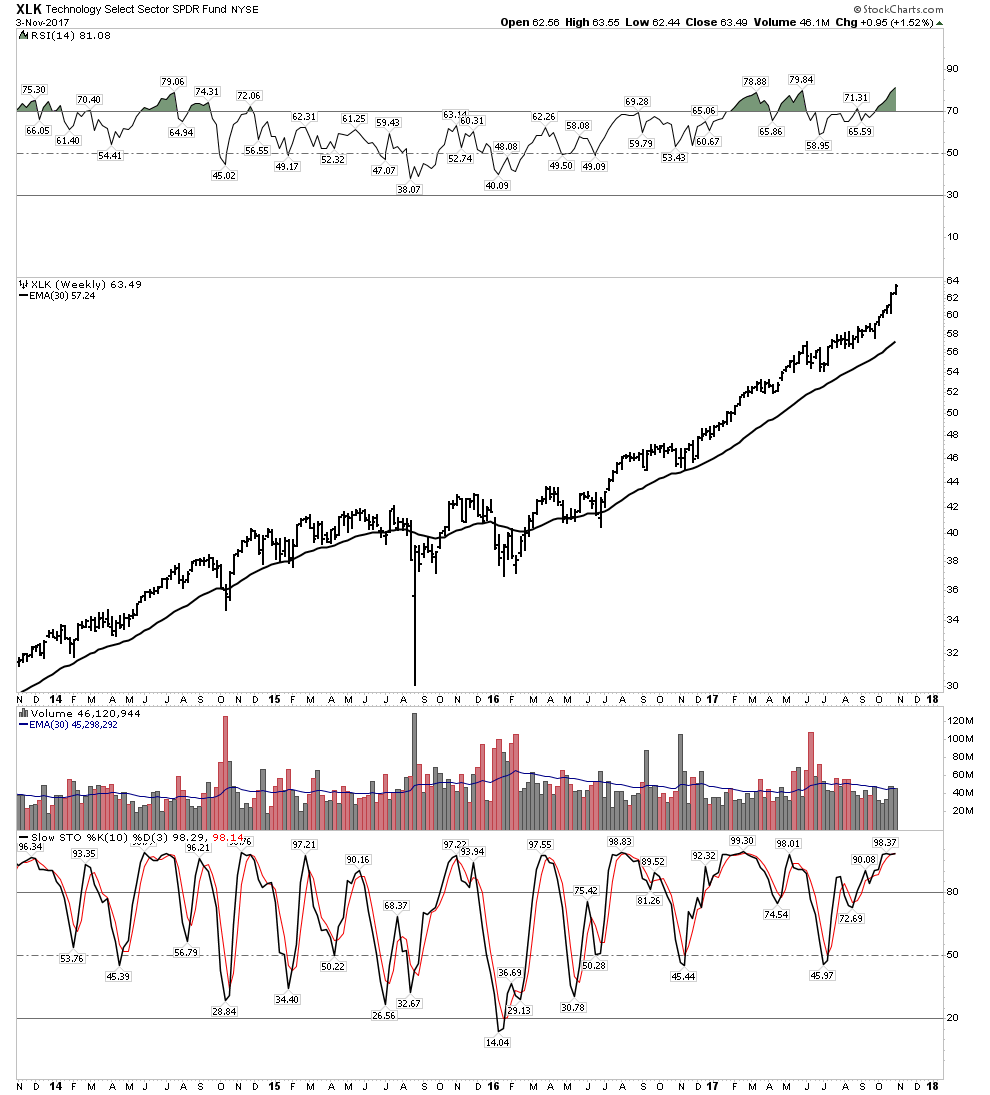
Note how extended stochastics and RSI have become. Also note how volume is trailing off despite this recent blow off move.
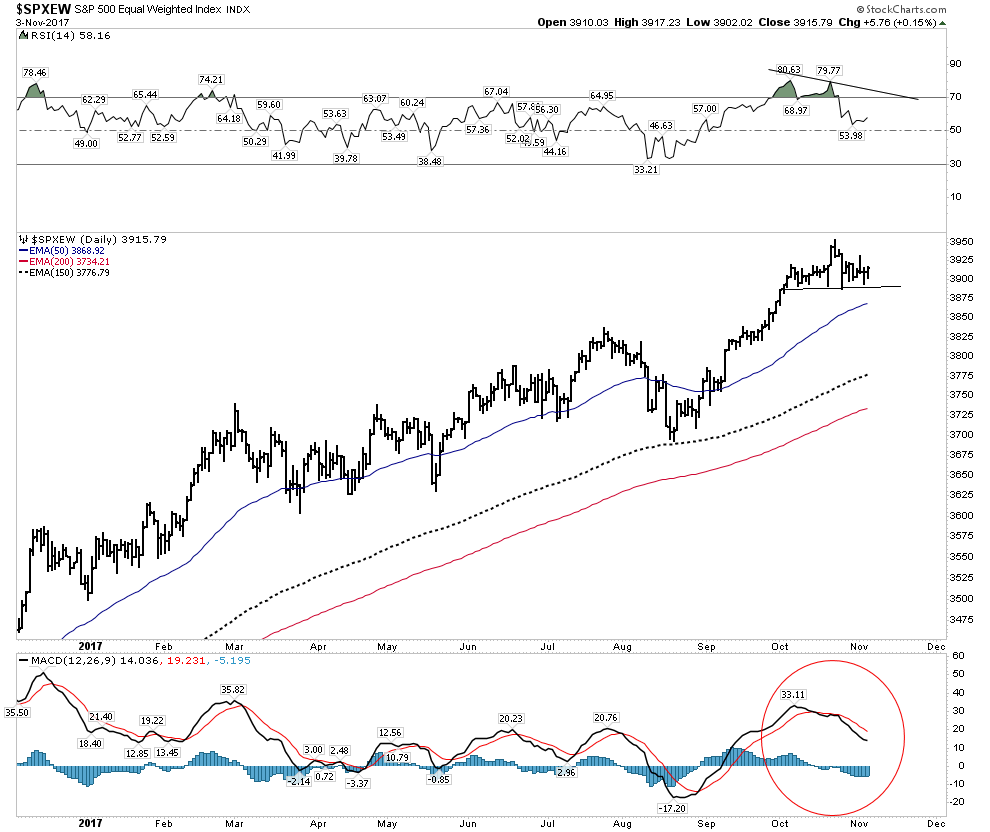
SPX-Equal Weighted Index
Below is the SPX represented as an equal weighted index. It values all 500 stocks equally vs the normal cap weighted measure. Here we see the trend solidly upward, however note that RSI is waning and it may be putting in a H&S top. MACD momentum is also indicating weakness.
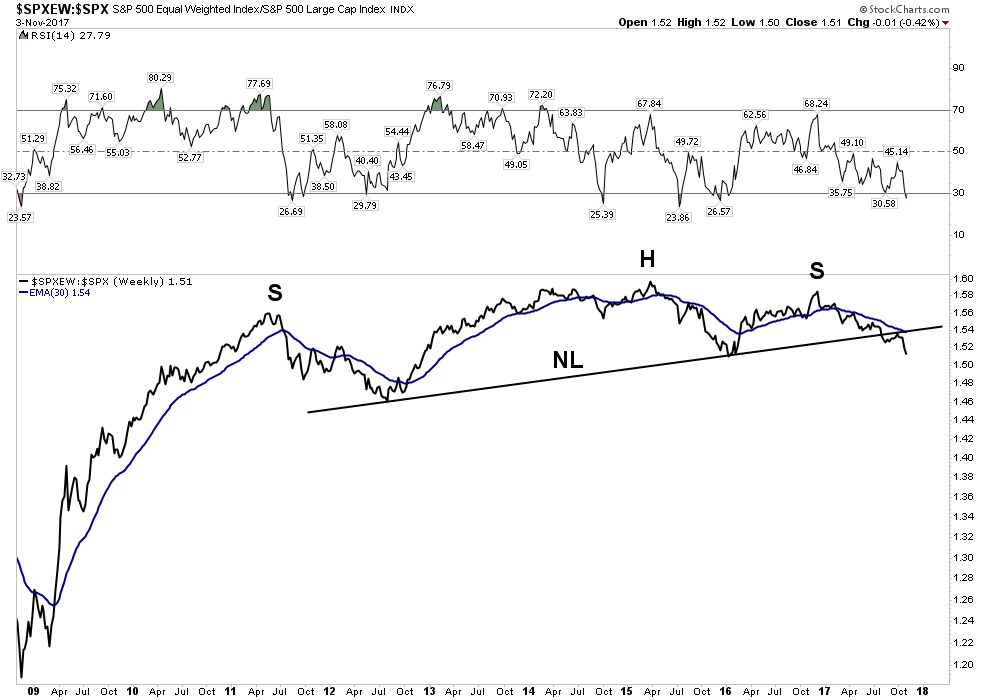
Now let’s go back and view the entire 9 year bull market and subtract out the cap weighted influence of the index as opposed to just neutralizing it. You will see it reveals the core of the market has not really gone anywhere for 7 years and it has recently broken its NL, followed up with a BT and is now resuming its downtrend.
Finally, let’s remove the effect of the super momentum driven XLK for the past 5 years and what is revealed is something really shocking. That of course is a total implosion of the core of the market relative to the momentum driven XLK. The message here for us to understand is that this market is being driven by money flows into an increasingly narrow sector of the market. This is a classic final phase characteristic of a blow off market. It is not announcing an end tomorrow, but it tells one what season we are in.
Let’s look at a few charts that you should be aware of. Again, the message is not that the end is here, but the internals are deteriorating:
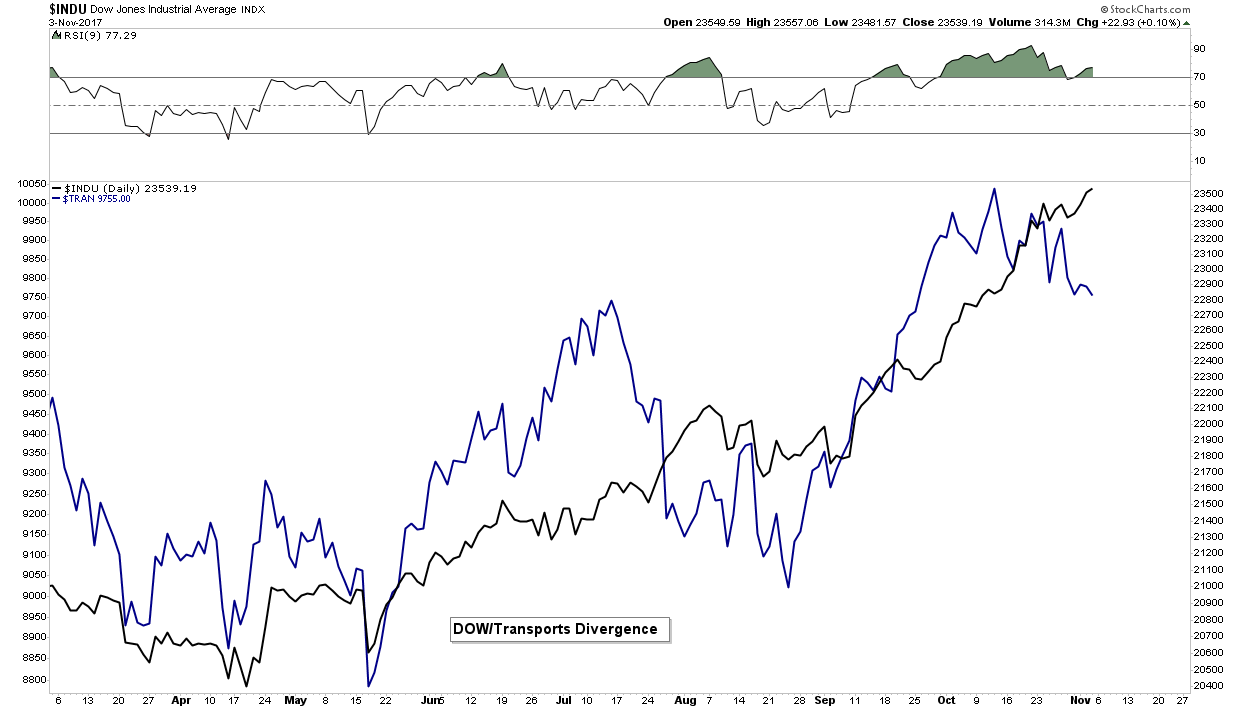
Dow Theory- Non Conformation
It’s only been in effect for three weeks, however this divergence needs to be corrected by the transports resuming its uptrend. Without a reversal upside, it signals trouble ahead:
…..continue looking at 35 more fascinating 35 charts Rambus has put together in this report HERE after which comes his:
Conclusion
The general markets continue to power higher with momentum firmly intact. If you are playing this sector you are making money, but be careful as numerous signs point to a top within 2-4 months. Meanwhile the PM sector is getting beaten up, but therein may lie the opportunity of a lifetime, especially now that we know the new FED chair is just another Brainless Keynesian who thinks there will never be any repercussions to endless money printing. Perhaps it’s time to take our eye off of the shiny object and buy what is real value, the precious and the electric metals.


-
I know Mike is a very solid investor and respect his opinions very much. So if he says pay attention to this or that - I will.
~ Dale G.
-
I've started managing my own investments so view Michael's site as a one-stop shop from which to get information and perspectives.
~ Dave E.
-
Michael offers easy reading, honest, common sense information that anyone can use in a practical manner.
~ der_al.
-
A sane voice in a scrambled investment world.
~ Ed R.
Inside Edge Pro Contributors

Greg Weldon

Josef Schachter

Tyler Bollhorn

Ryan Irvine

Paul Beattie

Martin Straith

Patrick Ceresna

Mark Leibovit

James Thorne

Victor Adair