
Timing & trends
….also from Martin:
Trump’s Tax Reform
“The negotiations on the details are in the final stages. If the reform is very real indeed, and make no mistake about it, this would be a tremendous triumph for Trump and for the nation as a whole. Trump has the potential to take the United States counter-cyclical (cycle inversion) that would actually put a tremendous amount of pressure on the rest of the world.”


 U.S. President Donald Trump will visit China November 8-10 for a series of bilateral and commercial events, including a meeting with Chinese President Xi Jinping.
On that trip, President Trump’s first visit to China—the country that he has repeatedly criticized for trade practices and the way it has handled relations with North Korea—the administration will be taking some 40 U.S. companies on a trade mission to forge deals and discuss Chinese investments in the U.S.
One of the biggest deals up for discussion is an investment of around $7 billion by an alliance including China Petroleum & Chemical Corporation, or Sinopec, for an oil pipeline in Texas and an expansion of an oil storage facility in the U.S. Virgin Islands, Bloombergreports, quoting a person familiar with the proposal. The deal is likely to be in the form of a non-binding memorandum of understanding, not a definitive contract. According to insiders, the investment will still need a final go-ahead by both the U.S. administration and China.
Sinopec, in partnership with ArcLight Capital Partners—a Boston-based private equity firm focused on energy infrastructure assets—and with Connecticut-based Freepoint Commodities, is expected to propose a project for building a 700-mile-long pipeline from the Permian to the Gulf Coast and a storage facility at the Coast, according to Bloomberg’s source. Sinopec also wants to expand an oil storage facility on St. Croix, U.S. Virgin Islands.
Related: Oil Prices Fly Higher On EIA Report
Back in early 2016, ArcLight Capital Partners and Freepoint Commodities bought the idled storage terminals, refining units, and marine infrastructure located at Limetree Bay, St. Croix, from HOVENSA. The St. Croix Facility consists of some 32 million barrels of crude oil and petroleum product storage, idled refinery units with total peak processing capacity of 650,000 bpd, a deepwater port with nine ship docks, six tug boats, and various associated equipment and inventory.
LB Terminals—the company managed by ArcLight and Freepoint Commodities—wants to invest significant resources to revitalize the St. Croix Facility as a multi-purpose energy center, with an initial focus on crude oil and refined petroleum product storage. LB Terminals has already executed a 10-year lease agreement for 10 million barrels of storage capacity with Sinopec, the partners said in January 2016.
The potential Sinopec investment in U.S. energy assets and creation of jobs in hurricane-hit areas will not be President Trump’s only mission on his Chinese visit.
“This multi-sector mission will promote U.S. exports to China by supporting U.S. companies in launching or increasing their business in the marketplace, as well as address trade policy issues with high-level Chinese officials,” the Department of Commerce said, adding that due to the high interest and the significant number of applications received, it decided to accept more than 25 U.S. firms or trade associations as delegation participants.
According to Bloomberg, more than 100 U.S. companies have applied for the trade mission, and the Commerce Department will pick some 40 of them and announce their names soon. Companies tentatively listed as working on deals with China include General Electric, Westinghouse Electric, Alaska Gasline Development Corp, Cheniere Energy, and the Boeing Co, Bloomberg says, quoting a government document it obtained.
According to Reuters, energy firms dominate the provisional list of U.S. companies picked to accompany President Trump in China. A total of ten firms are listed—few of them confirmed to Reuters that they were getting ready to travel to China, but most declined to comment. The companies are Delfin Midstream LLC, Alaska Gasline Development Corp, Cheniere Energy, Texas LNG Brownsville LLC, Freepoint Commodities, Sempra Energy, SolarReserve LLC, Westinghouse Electric Co, Arclight Capital Partners, and Air Products.
Related: Saudis Need $70 Oil To Break Even
Considering this lineup, it’s very probable that President Trump and the Commerce trade mission delegation will negotiate boosting U.S. LNG exports to China.
In April, the Commerce Department said “companies from China may proceed at any time to negotiate all types of contractual arrangement with U.S. LNG exporters, including long-term contracts, subject to the commercial considerations of the parties.”
During his visit to China last month, U.S. Commerce Secretary Wilbur Ross stressed again his intention “to reduce the trade deficit through increased exports of high-value U.S. goods and services to China and improved market access for U.S. firms.” The U.S. and China should work to overcome bilateral trade frictions through negotiation, the parties agreed, but Secretary Ross “reiterated the need for concrete deliverables and meaningful action on key issues.”
By Tsvetana Paraskova for Oilprice.com
More Top Reads From Oilprice.com:
- U.S. Gasoline Demand Climbs To Record Highs
- Tensions Rise As Iraq Halts Kirkuk Oil Exports
- Coal Prices Soar As Demand Heats Up


today’s videos and charts (double click to enlarge):
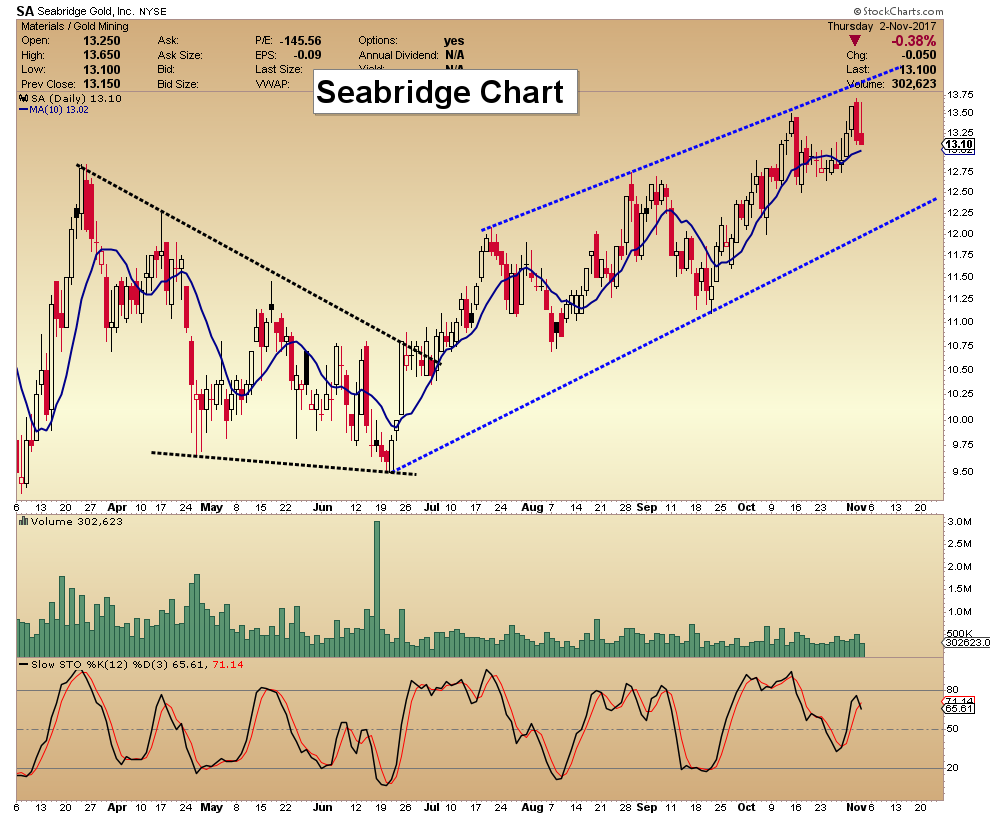
SF60 Key Charts & Video Update

SFS Key Charts & Video Update


SF Juniors Key Charts & Video Analysis


Morris
website: www.superforcesignals.com
The Loonie is tumbling and Canadian bonds rallying as the Bank of Canada backs away from its rate hiking plans in ‘surprise’ over the slowing Canadian economy.
Meanwhile, a new report from the National Energy Board brings good news for the planet (that is bad for Canadian GDP in the short and medium run). See: Canada’s demand for fossil fuels will max out in 2 years: NEB
The National Energy Board says Canada’s addiction to fossil fuels will peak in two years…The board’s annual energy futures report for the first time says with climate change policies and growth in clean energy, Canada’s consumption of fossil fuels to run cars and heat homes will max out before 2020, start to decline slightly and then flatline over the next two decades. Here is a direct video link.
At the same time, the NEB says it thinks (hopes) that falling domestic oil demand will be offset by increasing oil exports, and thus not hurt Canadian GDP. This is unlikely.
In reality, it’s not just domestic demand that will peak much sooner than previously estimated. The trend towards higher efficiency, renewable energy, and electric transportation, is global and only just getting started. In addition, new oil production technologies are enabling increased supply in most countries, including our historical oil export buyers.
Canada and other countries need to transition to products and services needed for the next phase of human evolution. We can, but to do so we will have to let go of status quo thinking and a fixation with sunk costs and antiquated business models.

This day was always coming, but unfortunately, Canada is woefully unprepared for the drop in income and the capital investment intensification needed.

-
I know Mike is a very solid investor and respect his opinions very much. So if he says pay attention to this or that - I will.
~ Dale G.
-
I've started managing my own investments so view Michael's site as a one-stop shop from which to get information and perspectives.
~ Dave E.
-
Michael offers easy reading, honest, common sense information that anyone can use in a practical manner.
~ der_al.
-
A sane voice in a scrambled investment world.
~ Ed R.
Inside Edge Pro Contributors

Greg Weldon

Josef Schachter

Tyler Bollhorn

Ryan Irvine

Paul Beattie

Martin Straith

Patrick Ceresna

Mark Leibovit

James Thorne

Victor Adair