
Stocks & Equities
The Dow and S&P 500 notched new highs this morning. So what else is new? Stocks have been going through the roof pretty much all year with no let-up in the upside momentum, save for a few minor pullbacks of 3% or so.
I’ve been warning for some time now that this overbought, overvalued market is also way overdue for a correction. And I’ve been proven dead wrong so far. But the fact is, the longer it takes for a typical pullback to materialize, the more severe it is likely to be.
At the risk of sounding like a broken record, here are several bearish red flags to watch closely. That’s because any one – or some combination – of them could quickly pull the rug out from under the market …
Red Flag #1 – Bad breadth: Granted, stocks are hitting new highs almost daily. But I notice a glaring lack of conviction in terms of market breadth – fewer advancing vs. declining stocks, which you can see in the chart below – and fewer new highs.
Plus, trading volume has diminished steadily in recent weeks at a time of year when it typically picks up.

These are classic signs of a market about to run out of gas. And they tell me the long-awaited correction is finally looming.
Don’t get me wrong; I’m not expecting a repeat of the 1987 stock market crash, which took the Dow down 22% in a single day 30 years ago last week. But we’re way overdue for a typical 10% correction.
And there’s a long way for stocks to fall, because they’re so overextended to the upside right now …
Red Flag #2 – Stocks overextended: In addition to cycles analysis, I keep a watchful eye on several tried-and-true technical indicators of price action for the markets.
One of the best is relative strength – which is a popular measure of momentum.
Specifically, the Relative Strength Index is an oscillator that moves between 0 and 100 and reflects the strength of a market’s trend. When RSI turns up from a very low level, it signals an oversold market, which may be a good buying opportunity.
But as you can see clearly in the chart below, the S&P 500 is at the other extreme …
 https://s3n.edelsoninstitute.com/wp-content/uploads/2017/10/wavechart1023-300×197.jpg 300w” sizes=”(max-width: 631px) 100vw, 631px”>
A very high RSI reading – 70 or above – signals an overbought market that’s ripe for a correction. And sure enough, the RSI for the S&P 500 has been above 70 for 15 straight days. That’s a rare occurrence that typically signals a correction of 5% or more.
All the market needs is a catalyst to break this complacency, and there are plenty of potential candidates …
Red Flag #3 – Rising headline risks: North Korea is the most obvious flash point right now, but by no means is it the only one. Just take a look at some recent headlines …
“North Korea has upped its war talk once again, warning the United States it faces an ‘unimaginable strike at an unimaginable time.‘ ”
Or how about the Middle East, where Iraq’s offensive against the Kurds threatens oil supplies? Then there are ongoing conflicts in Syria, Yemen, Libya, Turkey and the Ukraine … just to name a few. A flare-up in any one of these hot spots would quickly shatter the stock market’s complacency.
Or how about Europe?
“Stocks Drop as Spain Crisis Heats Up.“
Millions of Catalans protested for self-rule over the weekend, they want out of Spain. And Spain responded by seizing control of the autonomous region, actions that likely foreshadow large-scale civil unrest and probably martial law in one of Europe’s most-populous nations.
And while we’re on Europe, do you remember this headline from early 2017 …
“EU banks crumbling under 1 trillion-euro severe debt as toxic loans threaten CRISIS.“
This story broke back in January. And it wasn’t some prophet of doom-and-gloom saying it either. It was the chairman of the European Banking Authority sounding the alarm, the EU’s top banking regulator!
He warned flat-out that the amount of toxic debt held by EU banks has reached “urgent and actionable” levels. And guess what the EU has done about it? Absolutely nothing!
Just because the EU has been relatively quiet lately, don’t be fooled into thinking their banking and debt crisis is over … not by a long shot.
Bottom line: There is no shortage of potential risks to the market that investors are largely ignoring today. But complacency almost always gives way to a spike in volatility. That, you can bet on.
At this point, the consensus expects clear sailing for stocks through year-end. After all, this is seasonally the strongest time for stocks. But I believe the consensus may have it all wrong this time.
Investors are fooling themselves if they believe the stock market will continue to “melt-up” forever. Any one out of dozens of potential catalysts could trigger a sharp correction in this overbought market.
Forewarned is forearmed!
Good investing,
Mike Burnick

If you like precious metals, you probably like gold and silver. Let me tell you about a shiny metal that is leaving both gold and silver in the dust.
That metal is palladium – and it’s up 42.6% since the start of the year. And up 73% since the start of the new bull market in metals at the beginning of 2016. That runs rings around gold’s performance. The yellow metal is up “only” 12.5% this year and 20.5% since the start of the new bull market.
So, yeah. Palladium is the hot ticket among the shinier, non-energy metals.
Side note: I’ve told you about the energy metals before. They’re in a supercycle, and looking good. That’s part of the big megatrend of the world’s move to electric cars.
But the sun doesn’t rise and set on electric cars. So, let’s get back to the shiny stuff. The metals that can protect you from central bank money-printing.
Here is a chart of these metals, as tracked by the ETFs that hold the physical metal, since the start of the new bull market.

Wow! Just look at palladium. Why is it so hot? And why is platinum – which is much rarer than the other metals shown here – doing so poorly?
Demand Shifts into High Gear{jcomments on}
The reason is that both palladium and platinum are also industrial metals. And even there, the metals’ fortunes are zooming in different directions.
Palladium is used in catalytic converters for gasoline engines. And global car sales are shifting into high gear. World vehicle sales jumped 4.1% in August. In China, the world’s biggest car market, sales are up a whopping 8% year-over-year. Zoom-zoom!
That is revving up demand for palladium.
But what about platinum? Well, platinum is mainly used for pollution controls in diesel engines. Volkswagen is the world’s biggest car maker. Remember how its diesel cars were supposed to be so clean?
Maybe not so much. Volkswagen was caught red-handed cheating on its diesel emissions tests. The company is now liable for billions of dollars in fines.
But it’s not just Volkswagen. According to a recent study, EVERY diesel car company is emitting more pollution than tests show.
This is hurting the popularity of diesel-powered vehicles. Especially in Europe. Europe’s diesel-engine market share may fall by half by 2025. And that will remove 300,000 to 600,000 ounces of platinum demand in the next decade, according to Citigroup.
Meanwhile, the supply/demand picture in palladium is very tight. Citigroup says mine supply of palladium could fall short of demand by more than a million ounces next year.
Just recently, palladium climbed above $1,000 an ounce for the first time since 2001. Its increase is fueled by hopes for rising demand from the car industry amid a shortage of supply.
What’s more, palladium became more expensive than platinum last month for the first time in 16 years.
A Smart Way to Play Palladium
Don’t buy now. Wait for a pullback. That’s what I’m going to do, and I think you should too.
After hitting a 16-year high on Monday, palladium has already started dropping hard, and it could take a while longer before it hits bottom.
But when that time comes, probably very soon, there’s going to be a tremendous buying opportunity. And it’s just one of many!
In fact, that’s precisely the kind of buying opportunity we talked about in the first session of our Supercycle Investing Summit, which we just completed 90 minutes ago. If you missed it or want to see it again, just click here for the recording.
All the best,
Sean Brodrick

Briefly:
Intraday trade: Our Friday’s intraday trading outlook was neutral. It proved wrong because the S&P 500 index gained 0.5%, following higher opening of the trading session. The broad stock market accelerated its uptrend on Friday. There have been no confirmed negative signals so far. On the other hand, we still can see some short-term overbought conditions. Therefore, we prefer to be out of the market today, avoiding low risk/reward ratio trades.
Our intraday outlook is neutral today. Our short-term outlook is neutral, and our medium-term outlook is neutral:
Intraday outlook (next 24 hours): neutral
Short-term outlook (next 1-2 weeks): neutral
Medium-term outlook (next 1-3 months): neutral
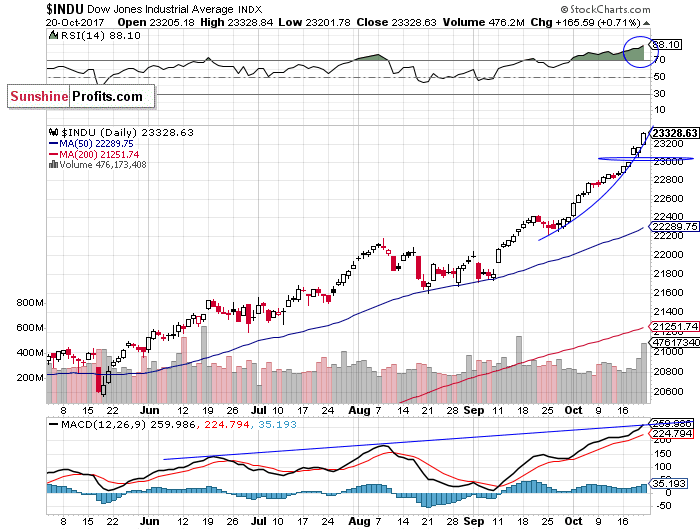
The main U.S. stock market indexes gained between 0.4% and 0.7% on Friday, extending their long-term uptrend, as investors’ sentiment remained very bullish following Thursday’s rebound off support level. The S&P 500 index has reached new record high at the level of 2,575.44. The Dow Jones Industrial Average reached another all-time high at the level of 23,328.84. It accelerated its recent run-up, as investors were euphorically buying blue-chip stocks. The technology Nasdaq Composite was relatively weaker than the broad stock market. However, it reached new record high at the level of 6,640.03, around 0.1% above its Wednesday’s high. The nearest important level of support of the S&P 500 index is now at around 2,565, marked by Friday’s daily gap up of 2,562.36-2,567.56. The next support level remains at around 2,550, marked by previous level of resistance, among others. The next support level is at 2,540, marked by recent fluctuations. On the other hand, potential resistance level is at around 2,600. The S&P 500 index accelerated its uptrend, as it broke above recent consolidation. Will it continue even higher? There have been no confirmed negative signals so far. However, we can see some medium-term technical overbought conditions:
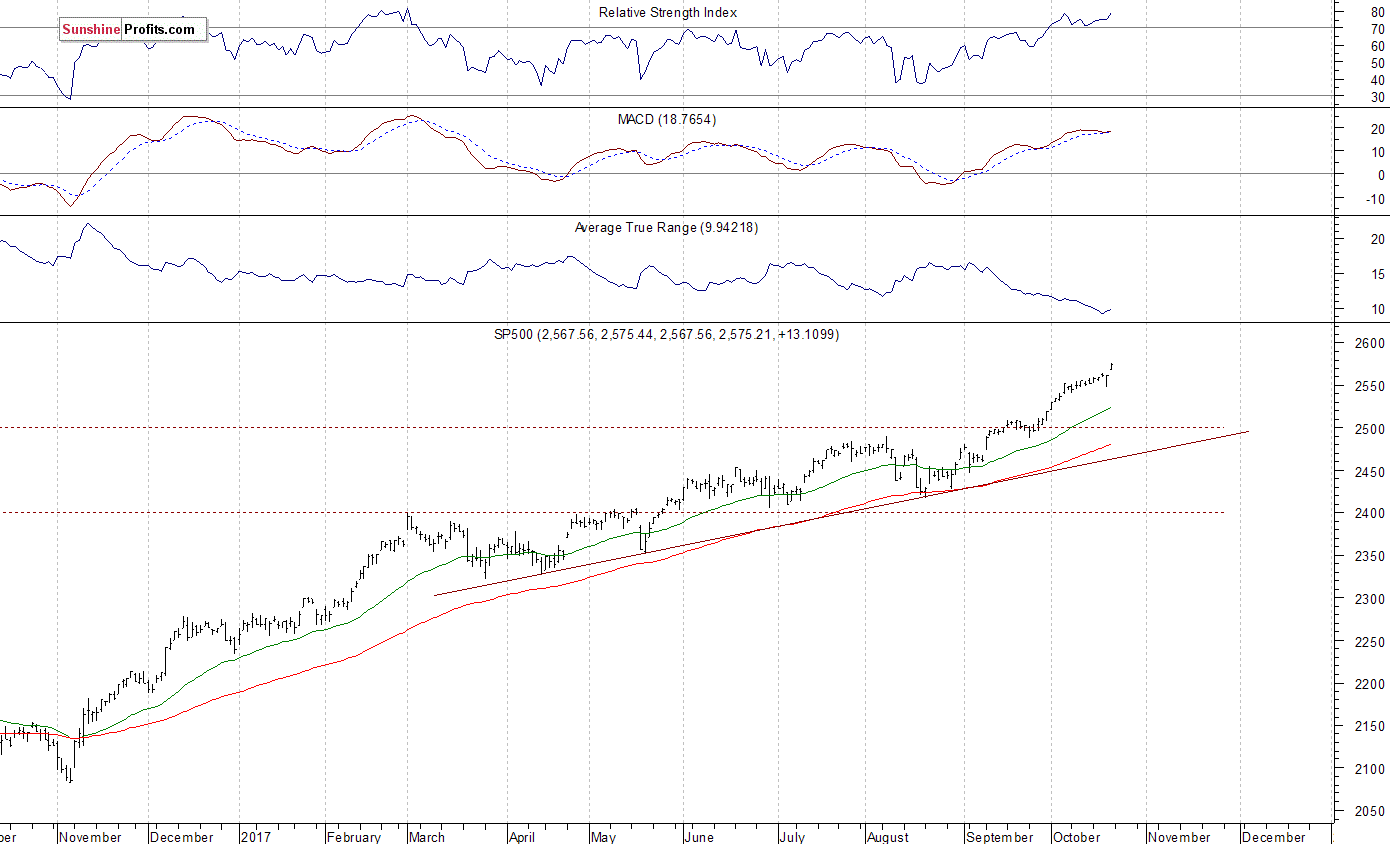
Close To New Record High
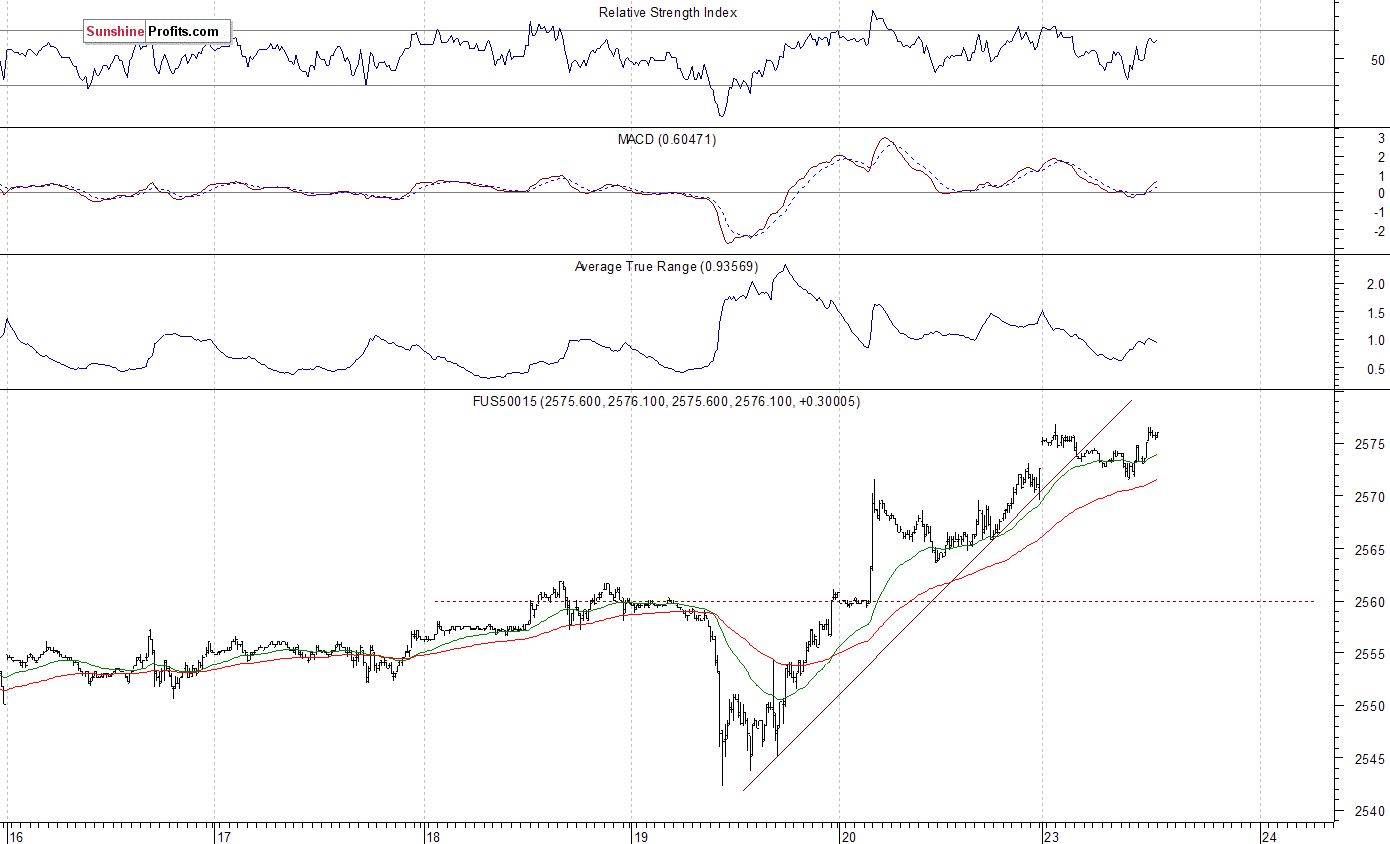
Expectations before the opening of today’s trading session are slightly positive, with index futures currently between +0.1% and +0.2% vs. their Friday’s closing prices. The European stock market indexes have gained 0.2-0.5% so far. There will be no new important economic data announcements. However, investors will wait for quarterly corporate earnings releases. The S&P 500 futures contract trades within an intraday consolidation, following an overnight rally. The market has reached new record high above the level of 2,575. The nearest important support level is at 2,565-2,570, marked by recent fluctuations. The next level of support remains at 2,560, marked by Wednesday’s local high. The futures contract trades close to its new record high, as we can see on the 15-minute chart:
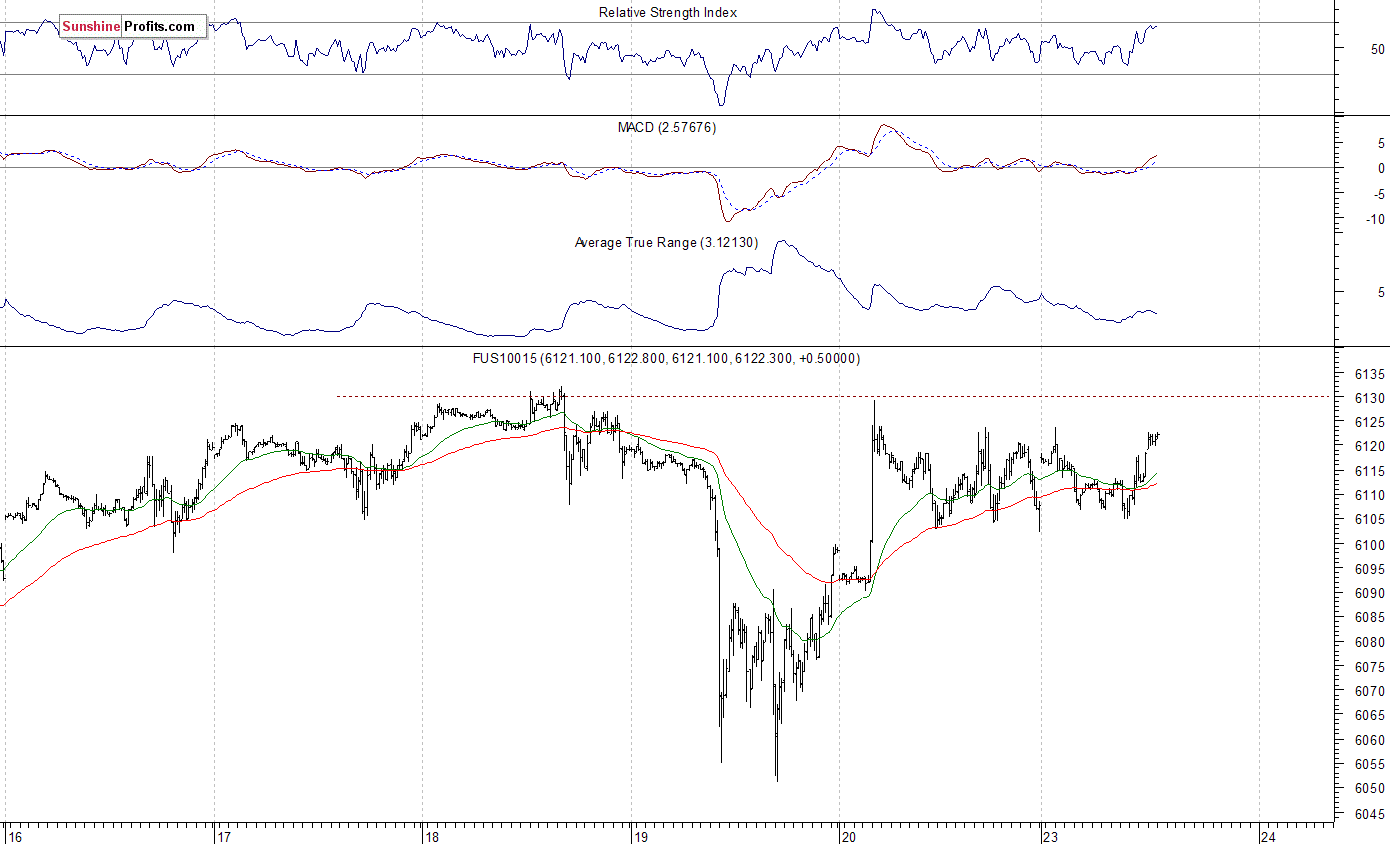
Nasdaq Still Relatively Weaker
The technology Nasdaq 100 futures contract trades within an intraday consolidation, as it extends its Friday’s uncertainty. The market fluctuates along record high, close to resistance level of 6,130. The support level remains at 6,080-6,100. The next support level is at around 6,050, marked by Thursday’s daily low. The Nasdaq 100 futures contract extends its fluctuations along last week’s highs, as the 15-minute chart shows:
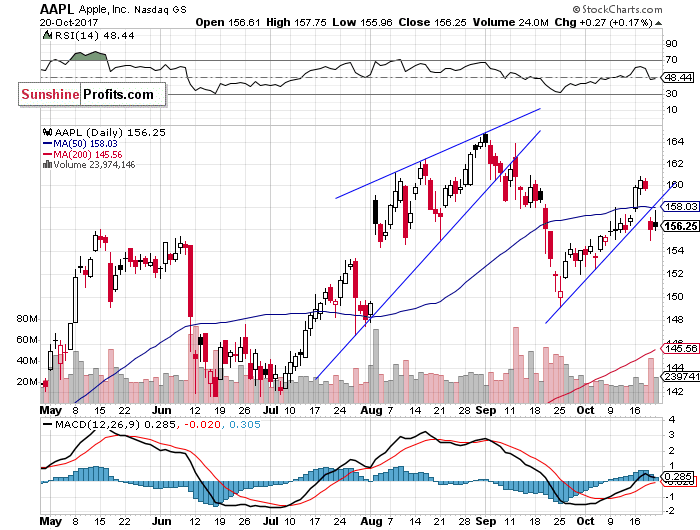
Let’s take a look at Apple, Inc. stock (AAPL) daily chart (chart courtesy of http://stockcharts.com) again. The stock remains relatively weaker than record-breaking broad stock market gauges. It broke below its short-term upward trend line on Thursday, after reaching resistance level of $160. The stock price bounced off support level at around $150 at the end of September. Is this a new downtrend or just downward correction following recent advance?
The Dow Jones Industrial Average daily chart (chart courtesy of http://stockcharts.com) shows that blue-chip index accelerated its long-term uptrend last week. There have been no confirmed negative signals so far. However, we can see technical overbought conditions. Is this a medium-term blow-off top pattern?
Concluding, the S&P 500 index continued its long-term uptrend on Friday, as it reached new all-time high at the level of 2,575.44. Investors’ sentiment remained very bullish ahead of quarterly earnings releases. There have been no confirmed negative signals so far. However, we still can see technical overbought conditions. Is this some medium-term topping pattern before downward correction?
If you enjoyed the above analysis and would like to receive free follow-ups, we encourage you to sign up for our daily newsletter – it’s free and if you don’t like it, you can unsubscribe with just 2 clicks. If you sign up today, you’ll also get 7 days of free access to our premium daily Gold & Silver Trading Alerts. Sign up now.
Thank you.
Paul Rejczak
Stock Trading Strategist
Stock Trading Alerts


Listen to the Podcast Audio: Click Here
Mike Gleason: It is my privilege now to welcome in Greg Weldon, CEO and President of Weldon Financial. Greg has over three decades of market research and trading experience, specializing in metals and commodity markets and even authored a book in 2006 titled Gold Trading Bootcamp, where he accurately predicted the implosion of the U.S. credit market and urged people to buy gold when it was only $550 an ounce.
He is a highly sought-after presenter at financial conferences throughout the country, and is a regular guest on financial shows throughout the world, and it’s good to have him back here on the Money Metals Podcast.
Greg, thanks for joining us today. And it’s nice to talk to you again. How are you?
Greg Weldon: I’m great, thanks. My pleasure, Micheal.
Mike Gleason: Well, when we had you on back in mid-August you were optimistic about gold at the time. We had a pretty good move higher, shortly thereafter that ended up with gold hitting a one year high. But it stalled out around $1,350 in early September and we’re currently back below $1,300 as we’re talking here on Wednesday afternoon. Gold hit resistance at about the same level in the summer of last year, so give us your update as to your current outlook. What drivers, if any, do you see that can push gold through that $1,350 resistance level in the months ahead, Greg?
Greg Weldon: Yeah, well, exactly as you said. You had the move that we were anticipating when we last spoke and it kind of had already started from the 1205-ish level. All of this fitting into the kind of bigger picture, technical structure that still leads to a bullish resolution. But as you accurately mentioned, you got up to what have been close to, not quite even towards last summer’s highs around $1,375, $1,377. In this case, around $1,360 and ran out of steam.
The dollar kind of changed some of the picture and the thought process linked to the Fed changed some of the picture. So, you embarked on a downside correction. $1,260 was the low, you have a nice little correction from that level. That was the level that equated to 200-day exponential moving average. It’s a level that was just below the 38% Fibonnaci retracement of the move up from $1,205. Actually, the move up from $1,123 back at the end of 2016. So you had real, critical support there. So, to me, everything’s kind of mapped out the way you might expect it to, structurally, in this market.
From here, one of two things happens, I think. Well, one of three things, anyway. You could be cut if you have a bit of low rally backed up to $1,300. You back below it a little bit to dollars; still looks kind of strong. It’s an interest rate differential dynamic as a more hawkish view for the Fed is priced into the Fed funds; that gets transferred into the two-year and five-year treasury notes. The two-year treasury notes at a record high-yield relative to the German two-year schatzi. So, that lifting the dollar … it’s kind of gravitational pull to the upside. And that is some of the downside risk here; that the rally we just saw is kind of you b-wave and maybe you have a c-wave down towards $1,240. That’s kind of an ultimate low. Whether or not it plays out that way, longer term we still like it.
Mike Gleason: Precious metals have had a pretty respectable year all in all. Gold is up about 11% year to date. Silver is up about half as much. There isn’t exactly a lot of excitement. It seems like it’s always two steps forward, one step back. Sentiment in the physical bullion markets, where we operate, is muted. There are multiple factors to consider as to why metals markets are stuck in a bit of a rut. It seems to us that one of the big ones is the equities market stock prices just keep marching relentlessly higher. Either investors have become totally desensitized to risk or maybe there just isn’t as much risk as well think there is. In any event, barring some sort of spike in inflation expectations, which pushes metals and stocks both higher, we don’t see gold and silver breaking out unless investors start getting nervous about stock market valuations and thinking about safe havens. So what are your thoughts about equity markets and how they relate to precious metals, Greg? And where do you see stock prices headed in the near term?
Greg Weldon: Yeah, I mean it’s a perfect question because the reality is, and we in our daily research we focused on this, in fact yesterday. We haven’t spoken … It sounds like we arranged this question. Focusing on the fact that gold, relative to S&P, is at a low. You really are kind of lows that we’ve seen before, but at a level where if you get much lower, you’re breaking down to multi-year lows and this whole thing gets called into question from a technical perspective. But my problem with looking at it from a technical perspective, is that I think the stock market is living in borrowed times. Basically, the Fed has done exactly what they wanted to do. They have flushed people out of safe havens and into risk assets. That’s the whole idea of QE. It worked. You reflated the stock market. That has facilitated a huge, unprecedented rise in consumer credit.
Instead of the housing market being the collateral like it was in 2006 and 2007, now it’s the stock market that’s the collateral, the Googles and Amazons of the world and the Facebooks of the world. And you have this demand that is being driven or really being fed by credit. Now you see the credit numbers start to slow. They’re unsustainable. You start to see the consumer roll over a little bit. So that’s the number one risk to the stock market; it’s actually the consumer.
If you look at the retail sales numbers, outside of automobiles and gasoline, which is price-based, you don’t have much of anything. And you have eating and drinking growth slowing. That’s a key component, a key layer to the discretionary spending that’s an important tell to the bigger picture. The consumer discretionary sector is breaking down against the S&P. So that’s a warning sign to me.
You have, in terms of the dynamics around what the expectation is for GDP growth, predicated upon policies that have not yet been even agreed upon, let alone voted upon, let alone implemented, let alone starting to work. So, I worry about that kind of fracture between the expectations, the patience level of stock investors, diminished returns, diminished volumes. I think there’s a stock market risk. That’s one of the reasons we like gold, because what would go hand in hand with that, was some kind of maybe statement or a pull back on the dot plot from the Fed that would then cause the dollar to come off its little rally here.
Mike Gleason: Let’s play the devil’s advocate maybe a little here. We look at these record stock prices and wonder about what is beyond this extraordinarily high valuations in the past when PE ratios hit these levels, it was a signal that markets were nearing a top. But there’s one big difference between the past and today: the advent of high frequency and machine-driven trading. Huge amounts of daily volume is generated by trading algorithms. That is a game changer. These programs don’t sense risk on an emotional level like human traders do. They respond very differently to geopolitical events. So, if today’s markets seem disconnected from reality, perhaps because it’s because they are.
Now you have been on the front lines, trading in these markets for decades. You were a witness for how markets have transformed in recent years. What is your take on high frequency and algorithmic trading and what does it say about the possibility that current equity market valuations can be sustained or maybe even pushed higher? What are your thoughts there, Greg?
Greg Weldon: That’s phenomenal question and it’s very well timed given that we did a big special in September called “Shrinkage,” which is a shift in the Fed policy here. But if you take now your question, which is pertinent now, and you look at experience, in my experience over decades, it brings back 1987 right off the bat. We’re not saying the market’s going to crash. There clearly there are a lot of differences. But when you ask about high frequency trading, it sounds to me, the first thing I think of, is portfolio insurance on steroids, times a thousand, times ten thousand. So, the risk in terms of just what is the catalyst that then causes kind of that cascading downside?
One of the things we’ve been pointing out to our customers… and by the way, I’m working out a gigantic special that shows just how intriguing some of the similarities are around movements in the dollar, movements in bonds, movements in gold, and movements in stocks, and some of the ratios, and even down to crude oil, Fed policy and CPI. Now as there was basically from 1985 to ’87, once they kicked in the Plaza Accord, which depreciated the dollar. A lot of intriguing connections there and the special report that I’m writing on this, it’s called “What, Me Worry?” which we’d love to make available to any of your listeners, first of all, if they want to email me.
But in terms of the catalyst, setting it up, again I think the landmines are laying in wait out there. I think if you take an example, one of the things, like I said we’ve been telling our customers, if you take Amazon or Google. Stock are trading at $1,000 a share. You need $1,000 to buy one share. So, the volume of trading has diminished dramatically over the last couple of years as the stock prices has gone up. The ownership is huge. And it’s passive, and it’s managed investments, it doesn’t matter, it doesn’t discriminate in terms of what type of investor. The people who want to own these stocks, own them. The dynamic between the price level being so high, nominally speaking, to buy up block shares, the amount of money needed, pure and simple, against the volume, to me, sets up something like you’re talking about that would be exacerbated by a flash crash. So, it becomes very scary in terms of what kind of meltdown could you see if you get the ball rolling to the downside.
I still think that this is something that will play out over some time. I think the Fed is there. I don’t think this is … There are a lot of differences. I’m not trying to make a direct ’87 comparison. But I’ll tell you what, the risk is there. No doubt about it. The risk is rising.
Mike Gleason: In terms of the Fed here, Greg, what is your thinking on who it might be that talks over for Janet Yellen as the next Fed chair and then also, tell us what you think they’re going to do here in terms of getting inflation to where they want? Basically, what are your general thoughts on the Fed and Fed monetary policy? Clearly everyone’s favorite subject.
Greg Weldon: Really, it’s two totally separate questions right now because who is Donald Trump going to pick versus how inflation going to play out. I think if you look at what the Fed is saying, the Fed has been very clear. This is where (Jerome) Powell becomes, what seems to be, and I’m not saying I believe this, I’m just saying it seems that Powell’s a logical choice if, IF, your goal is to maintain policy. Thinking about bringing in a guy like (John) Taylor, and the Taylor rule and where the natural level of Fed funds should be here, he would obviously be a much more hawkish choice. While him and Trump might have really gotten along, and maybe there’s a lot Trump can learn from him, I don’t think that’s the guy Trump wants in terms of policy for trying to get his growth agenda going.
In that context, how you maintain continuity, which really isn’t that bad. They’re certainly not tight and they’re not tightening to any nth degree. It’s almost Goldilocks material here, inflation aside. Powell is a logical choice because you make a headline splash, which of course he loves. You basically make a change, but you kind of keep the status quo.
The other one would be (Kevin) Warsh. He was more away from QE and towards just using interest rates. He’s an interesting kind of dark horse. Yellen is certainly a dark horse. What mattes really is how does the Fed decide they’re going to deal with this inflation issue when they can’t even decide what’s causing it? Because you keep hearing transitory, idiosyncratic. These are the words that being used repeatedly, over and over and over again to describe, and you’ve had one Fed official go so far as, and even Yellen herself has made comments to the effect of, “We don’t understand why it’s not materializing.”
Again, kind of back to the Taylor model, the basic rule of thumb that the Fed is counting on, i.e. hoping for, is that as the labor market continues to tighten wages, inflation will go up and that will support of a general rise in prices. The question now becomes is the natural rate of unemployment lower than we thought it was. Or, are there structural differences now, technologically based dynamics in the labor market that has hollowed out the labor market, the reason you still have participation rate while finally up a little, is still so low historically, therein lies the question. What is it kind of keeping inflation back and how does this play out?
I think the employment numbers from this month, for September, were huge in the sense it was the biggest wage number … and you know how I break the number down. To the nth degree, this was the real deal. Only one month, but still the real deal, and the best wage number we’ve seen since 2007. So, will that continue? We know anecdotal evidence is there. Will this continue over the next couple of months?
If you look at CPI and PPI, the pipeline, the year-over-year dynamics around some of the commodities, God forbid, grains, oil seeds, and tropical commodities started to rally because then you’d have a real problem. Look at what the base models are doing. Look at what energy potentially you’re going to break out here. So, I think there is some inflation coming and it’s apt to push the Fed to have to raise to meet their dot plots, and I think that’s going to be problematic for the equity markets. They’re walking the high wire act with no safety net. It’s a very difficult job.
Mike Gleason: Getting back to metals here for a bit. We would like to give our listeners an update on the silver and gold price rigging scandal that erupted a year and a half ago when Deutsche Bank was forced to acknowledge cheating and turned over mountains of evidence, which may prove damning for a number of other banks. But the courts and regulators have a record of moving slowly, if they do anything at all. Now you’re much closer to the futures markets than we are. Are you aware of any developments on that front and what do you see as the implications of the civil action against the bullion banks? Do you sense that the Deutsche Bank revelations here led to more honest markets, perhaps because of all that evidence struck fear into banker’s hearts or is it more business as usual for these bullion banks who seem to have so much influence in these markets, Greg?
Greg Weldon: I have the sense it’s business as usual. I get the sense that it’s a kind of laissez faire attitude about that because the problem is so big, if we were to actually kind of get unearthed, the impact would be much, much larger and we would know it based on the price section very quickly. It’s a powder keg. It’ll blow at some point. This is something, gosh I’ve been in the business how long, and we’ve been talking about this how long? Really, this goes way, way back. The degree to which it has gotten worse is, I mean, the thing you debate, not whether it exists or not. Is it going to be somehow uncovered to the extent that it causes that kind of disruption? I think again, this is probably fodder for a great movie… a spy movie or whatever.
Sure, there’s probably a lot of that kind of thing going on in background, but in terms of the day to day operation of the trading of these metals, I don’t see any tangible impact in the dealings I have here, no.
Mike Gleason: Well Greg, as we begin to close, give us a sense of what you’re focusing on here, maybe some of the things that we haven’t touched on and then give us a sense of how you’re evaluating these markets for your clients. Do you think it’s time to get defensive, go to cash, favor metals and commodities here as an inflation hedge, or does the wave of exuberance in stocks still have a ways to go? Any final comments or anything else that you want to leave us with today?
Greg Weldon: Well, I think some of that depends on whether they can actually get some kind of job done in Washington where the Republicans finally realize their own necks are on the chopping block here, so let’s finally ban together and get a tax reform package done. We’ll see whether that happens. I think that might be one of those last gas type of moves for the stock market. It could be a “buy the rumor sell the fact,” but I think lot has been priced in and I think there’s still going to be disappointment down the road for that.
I’m watching the consumer specifically. The retail sales numbers have been really poor all year. It’s minuscule gains in discretionary items since January. And the debt numbers are interesting. You’re starting to see a roll over, starting to see rise in delinquency rates. The debt obligations for consumers and for the Federal government, by the way, are high despite the fact that rates are still low. Can you imagine if the Feds actually did push rates a hundred basis points higher over the next however many, 14, 15 months? I think that would have a real reverberating effect on the consumer and on the government where deficits are still increasing and they’re at high levels again. No one talks about it. You have $20 trillion dollars in sovereign debt and you’re about to push the five-year note above 2%, which is your trigger to increase cost on funding the debt. Man, the land mines are out there.
I’m watching all of it. That’s what we do for our clients every single day because never before, have you had to be more plugged in. Look at the way things happen so much more quickly now. You asked about what’s the difference from 30 years. So much more availability of news, quickly. But the fact of the matter is, the basic thing that we do hasn’t changed at all, which is dissecting all of it, connecting all the dots, and kind of trying to make it all make sense in terms of what the markets are doing and how you might profit from that.
Mike Gleason: Well Greg, thank you so much for joining us again. We enjoyed it very much and love getting your very studied and experienced outlook on the state of today’s financial world. Now before we let you go, please tell folks about Weldon Financial, how they can find you, and any other information they should know about you and your firm.
Greg Weldon: Sure, thanks, appreciate that. We’re found at WeldonOnline.com. We do Weldon Live, one product, one price. It’s kind of a multi-layered product, although it’s just again, one price. We do daily and we cover daily global macro, fixed income, foreign exchange, stock indexes and ETFs, precious and industrial metals, energy, and agricultural commodities. And we tie them all together and we have what we call our Trade Lab, which is part of Weldon Live. These as specific trading recommendations in all of those sectors, we’re old school futures guys, so that’s kind of the way we approach it. What we find is a lot of family offices or independent brokers or even individuals out there, and there’s no reason with the way your see ETFs now being utilized that the average investor can’t operate more like a hedge fund manager or CTA.
We try and provide rhyme and reason to what’s going on and then specific strategies to take advantage of it. Weldon Live found at WeldonOnline.com.
Mike Gleason: Well great stuff. Thanks so much for your time today, Greg. I hope we can talk again down the road. Take care and we appreciate you coming on.
Greg Weldon: Thanks. No problem, Mike. Any time.
Mike Gleason: Well, that will do it for this week. Thanks again to Greg Weldon of Weldon Financial and WeldonLive. For more information, simply go to WeldonOnline.com and we urge everyone to sign up for a free trial there. Again, you can find all of that information at WeldonOnline.com. Be sure to check that out.
Mike Gleason is a Director with Money Metals Exchange, a national precious metals dealer with over 50,000 customers. Gleason is a hard money advocate and a strong proponent of personal liberty, limited government and the Austrian School of Economics. A graduate of the University of Florida, Gleason has extensive experience in management, sales and logistics as well as precious metals investing. He also puts his longtime broadcasting background to good use, hosting a weekly precious metals podcast since 2011, a program listened to by tens of thousands each week.
The dollar is getting ready for a sizable rally, and that means that gold and silver are going to be knocked back again. Longer-term however, the outlook for the Precious Metals could scarcely be better, as we will see. In last weekend’s update it was pointed out that gold’s gap breakout from its steep downtrend shown on its latest 6-month chart below was probably false and that it was expected to drop back as the dollar advanced, which it duly did last week. Bearing in mind that the dollar has about completed its Head-and-Shoulders bottom, it is now clear that a parallel Head-and-Shoulders top is completing in gold as shown on the chart. This chart projects a breakdown beneath the nearby support level to be followed by a drop targeting the quite strong support in the $1200 – $1215 area.

….continue HERE for 7 more charts & analysis

-
I know Mike is a very solid investor and respect his opinions very much. So if he says pay attention to this or that - I will.
~ Dale G.
-
I've started managing my own investments so view Michael's site as a one-stop shop from which to get information and perspectives.
~ Dave E.
-
Michael offers easy reading, honest, common sense information that anyone can use in a practical manner.
~ der_al.
-
A sane voice in a scrambled investment world.
~ Ed R.
Inside Edge Pro Contributors

Greg Weldon

Josef Schachter

Tyler Bollhorn

Ryan Irvine

Paul Beattie

Martin Straith

Patrick Ceresna

Mark Leibovit

James Thorne

Victor Adair