
Gold & Precious Metals
Strengths
- The best performing precious metal for the week was palladium, up 7.28 percent as money managers raised their net-long positions on continued expectations that the shift from diesel to gasoline powered cars will continue.
- Gold traders and analysts surveyed by Bloomberg are bullish for the first time in five weeks, reports Bloomberg. Following the release of the Fed minutes which showed rising concern about low inflation, the yellow metal climbed to a two-week high. A fresh flare-up in tensions with North Korea pushed gold higher this week, writes Bloomberg, along with a U.S.-Turkey diplomatic spat regarding visitor visas was supportive.
- The Indian government withdrew an order that brought the gold industry under anti money-laundering legislation, reports Bloomberg. Jewelers were included in the Prevention of Money-Laundering Act in August that increased compliance requirements. In response to the rule reversal, shares of jewelers climbed in the country. This move comes just as gold buying improves before the Hindu festival of Diwali, the peak season for demand, the article continues.
Weaknesses
- The worst performing precious metal for the week surprisingly was gold, up more than 2 percent, despite grabbing most of the precious metals headlines.
- According to the People’s Bank of China website, gold reserves in China came in at 59.24m fine troy ounces in September, unchanged again from the previous month, which unfortunately is beginning to become a trend. Chinese markets had been closed the prior week to mark National Day.
- Oddly, the B2Gold share price underperformed for the week as it reported a production beat for the third quarter as well as its first gold pour at Fekola. SSR Mining also reported a minor shortfall in quarterly production which did hit the share price as well.
Opportunities
- The odds of an interest rate increase by year-end fell to 73 percent on Friday, from 77 percent on Thursday, weakening the dollar, according to fed funds futures data compiled by Bloomberg. Gold climbed above $1,300 on the dovish news and this has heads turning somewhat back to gold versus the bulk miners as the following report illustrates. S&P Global Market Intelligence released a note this week showing that miners planned to spend nearly $8 billion looking for new deposits in 2017, about 14 percent more than last year, reports Bloomberg. Gold exploration budgets in particular rose 22 percent to $4.1 billion in 2017, the article continues. That’s the biggest increase among nonferrous metals.
 6
6
- Another report this week comes from UBS, saying that gold is poised for a recovery. “Following the past three Fed rate hikes, gold typically performed well in the months that followed, while the dollar, rates and equities tended to come off. Gold has rallied each January since 2014 and we think there is reasonable potential for this trend to continue,” the report reads.
- Miners could be spared a proposed royalty increase in Western Australia, reports Bloomberg, after the government’s opposition party said it would block the motion in parliament. Western Australia hosts four of the nation’s biggest gold mines. Leader of the opposition Liberal party Mike Nahan said on Tuesday that Liberal party members of parliament will vote with other minor and cross-benchers to overturn the royalty increase.
Threats
- Despite gold surpassing $1,300 this week, Goldman Sachs sees further technical weakness for the yellow metal, with the potential for prices to fall 14 percent from current levels, reports Bloomberg. The bank has been fairly bearish on gold, maintaining its outlook in a September report that gold prices will end the year at $1,250 an ounce.
- Foreign Relations Committee Chairman Bob Corker and President Donald Trump ratcheted up a feud this week over Twitter. Corker called the White House an “adult day care center” and warned that Trump could set the U.S. “on the path to World War III,” reports Bloomberg.
- Following reports that Secretary of State Rex Tillerson called President Donald Trump a moron, the president fired back defending his intelligence, reports Bloomberg. “I think it’s fake news, but if he did that, I guess we’ll have to compare IQ tests,” Trump said in a Forbes interview. “And I can tell you who is going to win.”

Where Has the Volatility Gone?
A Bull Market in Complacency
San Francisco, Denver, Lugano, and Hong Kong
Strange things did happen here
No stranger would it be
If we met at midnight
In the hanging tree.
– Lyrics from the theme song of The Hunger Games
If buttercups buzz’d after the bee,
If boats were on land, churches on sea,
If ponies rode men and if grass ate the cows,
And cats should be chased into holes by the mouse,
If the mamas sold their babies
To the gypsies for half a crown;
If summer were spring and the other way round,
Then all the world would be upside down.
– Lyrics from a 17th-century English folk song entitled “The World Turned Upside Down”
A bull market is like sex. It feels best just before it ends.
– Warren Buffett
Longtime readers know that I read a wide range of newsletters, articles, and websites every day. There are times when I see patterns in the information flow that are like puzzle pieces begging to be put together. I have been struck in the past few days by the amount of analysis and number of data sets that are all pointing to the same conclusion: There is a bull market in complacency.
Strange things are happening out there. One formerly successful billionaire hedge fund manager after another throws in the towel, sending the money in their funds back to the clients, confessing that they don’t know how to handle these markets. I am reminded of the surrender of Cornwallis to Washington at Yorktown in 1781. Tradition has it that, as the British surrendered, their band played the old English folk tune “The World Turned Upside Down.”

The inability of so many active funds to find that “edge” that formerly allowed them to produce alpha is quite remarkable. I have written about this phenomenon before, so I won’t go into detail here; but it is the massive move from active to passive funds that is the core of the problem. Passive investing simply allocates among a number of index funds that indiscriminately buy or sell the stocks that are in their indexes.
That means if you buy an index fund for the Russell 2000 (small-cap stocks), not only are you getting the stocks of well-run companies, you are also buying the 30% of the small-caps that have less than zero earnings. And since we’re seeing literally hundreds of billions of dollars moving to passive investing and away from active managers every year, that is a lot of indiscriminate buying. Barron’s estimates that passive investments could make up half of all US equity retail flows in 2018 and 2019, and this calendar year will see the largest ever dollar shift in assets under management from active to passive. Part of the reason is a general move to lower fees, and part is simply that active management has failed to outperform.
Here’s the problem: It is extremely difficult for an active manager to buy the best companies and/or short the worst companies and show much outperformance relative to the passive index funds. No matter how much research you do, no matter how well you know those companies, your research is not giving you an edge over the massive movement to passive investing.
And if you have no edge, you have no alpha. It is just that simple. Personally, I don’t think this is the end of active investing, but the game is going to have to change.
Where Has the Volatility Gone?
I was talking with Ed Easterling of Crestmont Research about the markets, and he asked me if I knew that there have been 39 times since 1990 when the VIX has closed below 10, and that 30 of those times have happened this year. And since the VIX has closed below 10 for the last two days since Ed and I talked, it is now 32 of 41 closes below 10. And 15 of those have been in the last 30 days!
Ed sent me an updated chart last night of the VIX Index through the close of the markets on Friday. Notice that the all-time low of 9.19 was put in on October 5, 2017.
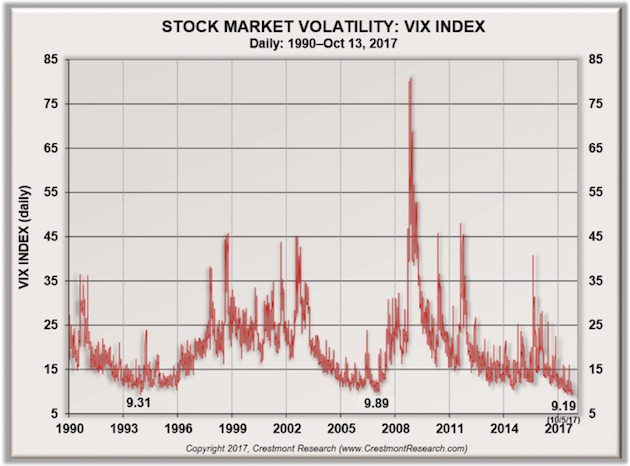
All the previous sub-10 closes occurred in only two periods: Four of them were in the winter of 1993–1994 (around Christmas, which is traditionally a light trading period), and the others were in the winter of 2006–2007, another period of great complacency.
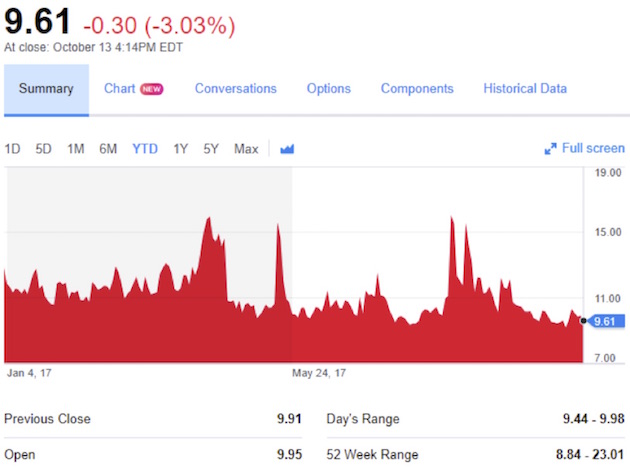
You can’t really draw any conclusions about the next move of the markets, because the VIX could spike to 50 or stay in this low range for a very long time. Essentially, we have trained investors to “buy the dips,” and that mentality removes a lot of volatility. Here is a chart of the VIX since the beginning of the year (from Yahoo Finance):
I got a blitz email tutorial this week from my friend Doug Kass, of Seabreeze Capital, a writer for the Street.com and Real Money Pro. He generally puts out two to three short pieces a day with his observations on the markets, and he discusses what stocks he is trading.
I was particularly struck with his observation about the massive – and it truly is massive – short position in the VIX and VIX futures. Look at this chart:
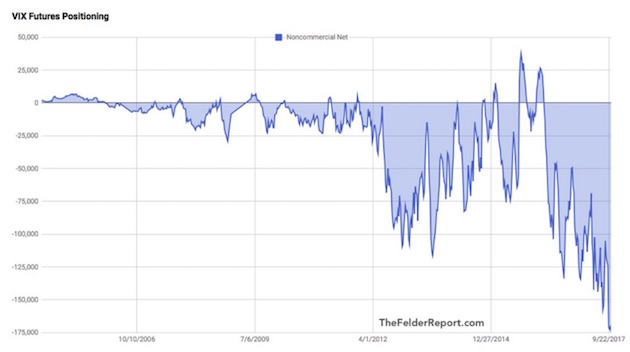
Now, as my friend and fellow Mauldin Economics writer Jared Dillian notes, prior to 2006 it was not possible for retail investors to trade the VIX. Then an ETF was created, and options and futures became available. Prior to that time it was just professionals who could create the effect of the VIX with futures and options trade positioning on the S&P. You almost had to be a pit trader to be able to do it.
Understand, the VIX is a totally artificial construct. It is a derivative of a derivative. In the beginning, around 1993, the VIX basically measured the implied volatility of eight S&P 100 at-the-money put and call options. Let’s go to Investopedia for a quick tutorial:
What is the VIX – CBOE Volatility Index?
VIX is the ticker symbol for the Chicago Board Options Exchange (CBOE) Volatility Index, which shows the market’s expectation of 30-day volatility. It is constructed using the implied volatilities of a wide range of S&P 500 index options. This volatility is meant to be forward looking, is calculated from both calls and puts, and is a widely used measure of market risk, often referred to as the “investor fear gauge.”
Breaking down the VIX – CBOE Volatility Index
The CBOE designed the VIX to create various volatility products. Following the CBOE’s lead, two other variations of volatility indexes have since been created: the VXN, which tracks the NASDAQ 100; and the VXD, which tracks the Dow Jones Industrial Average (DJIA).
The VIX, however, was the first successful attempt at creating and implementing a volatility index. Introduced in 1993, it was originally a weighted measure of the implied volatility of eight S&P 100 at-the-money put and call options. Ten years later, in 2004, it expanded to use options based on a broader index, the S&P 500, which allows for a more accurate view of investors’ expectations on future market volatility. VIX values greater than 30 are generally associated with a large amount of volatility as a result of investor fear or uncertainty, while values below 20 generally correspond to less stressful, even complacent, times in the markets.
How the VIX’s value is established
The VIX is a computed index, much like the S&P 500 itself, although it is not derived based on stock prices. Instead, it uses the price of options on the S&P 500, and then estimates how volatile those options will be between the current date and the option’s expiration date. The CBOE combines the price of multiple options and derives an aggregate value of volatility, which the index tracks.
While there is not a way to directly trade the VIX, the CBOE does offer VIX options, which have a value based on VIX futures and not the VIX itself. Additionally, there are 24 other volatility exchange-traded products (ETPs) for the VIX, bringing the total number to 25.
An example of the VIX
Movements of the VIX are largely dependent on market reactions. For example, on June 13, 2016, the VIX surged by more than 23%, closing at a high of 20.97, which represented its highest level in over three months. The spike in the VIX came about due to a global sell-off of U.S. equities. This means global investors saw uncertainty in the market and decided to take gains or realize losses, which caused a higher aggregate equity supply and lower demand, increasing market volatility.
So there you have it. The VIX is simply a way to measure the future expectations of investors regarding the volatility of market prices. And lately, investors have been rewarded for shorting the VIX. It is almost like the experiments you see where rats learn that if they punch a button that they get a grape. Investors have learned that if they short the VIX they make a profit.
Except that now there are so many people on that side of the boat that when the boat starts to turn over, the rush to get the other side is going to rock that boat hard, possibly to the point of swamping it. Doug warns that a 2% or 3% move down in the markets could cause short covering in the VIX that could quickly spiral out of control. Not unlike the “portfolio protection” trade that brought about the 1987 crash.
Peter Boockvar sent me a screen capture from his Bloomberg. The University of Michigan’s Surveys of Consumers have been tracking consumers and their expectations about the direction of the stock market over the next year. We are now at an all-time high in the expectation that the stock market will go up.
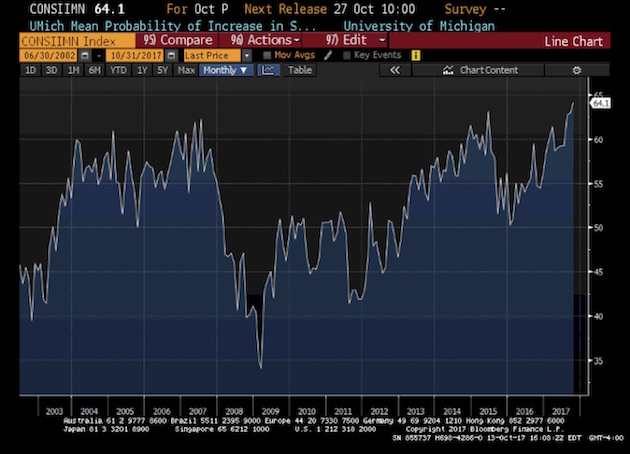
It is simply mind-boggling to couple that chart with the chart of the VIX shorts. Writes Peter:
Bullish stock market sentiment has gotten extreme again, according to Investors Intelligence. Bulls rose 2.9 pts to 60.4 after being below 50 one month ago. Bears sunk to just 15.1 from 17 last week. That’s the least amount since May 2015. The spread between the two is the most since March, and II said, “The bull count reenters the ‘danger zone’ at 60% and higher. That calls for defensive measures.” What we’ve seen this year the last few times bulls got to 60+ was a period of stall and consolidation. When the bull/bear spread last peaked in March, stocks chopped around for 2 months. Stocks then resumed its rally when bulls got back around 50. Expect another repeat.
Only a few weeks ago the CNN Fear & Greed Index topped out at 98. It has since retreated from such extreme greed levels to merely high measures of greed. Understand, the CNN index is not a sentiment index; it uses seven market indicators that show how investors are actually investing. I actually find it quite useful to look at every now and then.
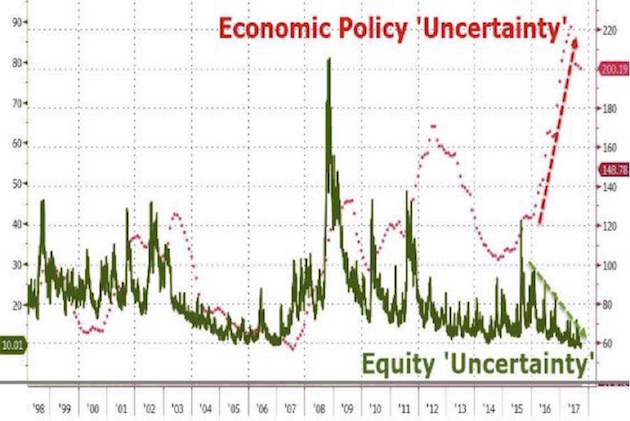
The chart below, which Doug Kass found on Zero Hedge, pretty much says it all. Economic policy uncertainty is at an all-time high, yet uncertainty about the future of the markets is at an all-time low.
At the end of his email blitz, which had loaded me up on data, Dougie sent me this summary:
At the root of my concern is that the Bull Market in Complacency has been stimulated by:
* the excess liquidity provided by the world’s central bankers,
* serving up a virtuous cycle of fund inflows into ever more popular ETFs (passive investors) that buy not when stocks are cheap but when inflows are readily flowing,
* the dominance of risk parity and volatility trending, who worship at the altar of price momentum brought on by those ETFs (and are also agnostic to “value,” balance sheets,” income statements),
* the reduced role of active investors like hedge funds – the slack is picked up by ETFs and Quant strategies,
* creating an almost systemic “buy on the dip” mentality and conditioning.
when coupled with precarious positioning by speculators and market participants:
* who have profited from shorting volatility and have gotten so one-sided (by shorting VIX and VXX futures) that any quick market sell off will likely be exacerbated, much like portfolio insurance’s role in a previous large drawdown,
* which in turn will force leveraged risk parity portfolios to de-risk (and reducing the chance of fast turn back up in the markets),
* and could lead to an end of the virtuous cycle – if ETFs start to sell, who is left to buy?
The chart above, which shows the growing uncertainty over the future direction of monetary policy, is both terrifying and enlightening. The Federal Reserve, and indeed the ECB and the Bank of Japan, went to great lengths to assure us that the massive amounts of QE that they pushed into the market would help turn the markets and the economy around.
Now they are telling us that as they take that money back off the table, they will have no effect on the markets. And all the data that I just presented above tells us that investors are simply shrugging their shoulders at what is roughly called “quantitative tightening,” or QT. I can understand the felt need by central bankers to “reload the gun” by raising rates so they will have a few bullets left to fire during the next downturn. Though frankly, I think that if they simply left the market to itself, very short-term rates wouldn’t be all that high. I mean, if 30-year Treasuries are still below 3%, what does that tell you about inflation expectations, and what does that tell you about expectations for short-term money market instruments?
Admittedly, the amount of QT this year is rather de minimis. But then it begins to rise quickly. At least two of those on the short list for Fed chair, in their recent speeches, have been critical of the Fed for not raising rates more forcibly; and while they haven’t explicitly commented on the balance sheet, they presumably would be inclined to continue with its reduction.
I simply don’t buy the notion that QE could have had such an effect on the markets and housing prices while QT will have no impact at all. In the 1930s, the Federal Reserve grew its balance sheet significantly. Then they simply left it alone, the economy grew, and the balance sheet became a nonfactor in the following decades.
I don’t know why today’s Fed couldn’t do the same thing. There is really no inflation to speak of, except asset price inflation, and nobody really worries about that. We all want our stocks and home prices to go up, so there’s no real reason for the central bank to lean against inflationary fears; and raising rates and doing QT at the same time seems to me to be taking a little more risk than necessary. And they’re doing it in the midst of the greatest bull market in complacency to emerge in my lifetime.
Do they think that taking literally trillions of dollars off their balance sheet over the next few years is not going to have a reverse effect on asset prices? Or at least some effect? Is it really worth the risk?
Remember the TV show Hill Street Blues? Sergeant Phil Esterhaus would end his daily briefing, as he sent the policemen out on their patrols, with the words, “Let’s be careful out there.”

San Francisco, Denver, Lugano, and Hong Kong
I will be going this week to San Francisco (technically, to Marin County) to visit the Buck Institute, which is the premier aging research center in the world. I have been invited join their Buck Ambassadors Council, which will afford me the privilege of receiving once or twice yearly updates on where antiaging research is going. I will give you a report when I return. Then on November 7 I will be speaking to the Denver CFA Society. A week later I will fly to Lugano, Switzerland, for a presentation to a conference – and I’ll try not to push myself quite so hard on this next trip across the Pond. I will also be in Hong Kong for the Bank of America Merrill Lynch conference in early January.
I will admit to being pretty pumped about the next two days of meetings at the Buck Institute. My host, Lou Gerken (famous local venture capitalist), decided to throw a small pre-meeting dinner for me on Sunday night. We thought eight people would be about the right number. Turns out we are now up to 21, and counting. I’m particularly excited about meeting Aubrey de Grey, whom I have talked with over the years but never met. He is probably the first person I read and then listened to who really began to make me understand the potential for solving the riddles of aging – in what may now be my own lifetime.
I remember talking with Dr. Mike West, CEO of BioTime, about 15 years ago. Like Aubrey, he is aggressively focused on figuring out how to turn back the clock on aging. Fifteen years ago he thought we would be able to do it within 40 years – so sometime in the mid-2040s. Now? He thinks the early 2030s is a given and maybe we’ll get there in the late-2020s. The speed at which the research is piling up and accelerating is simply staggering. Part of that gathering momentum is simply faster computers and artificial intelligence, and part of it is some remarkably good fortune and amazing discoveries.
Eric Verdin and his team at the Buck are literally at the center of the spiderweb of antiaging research in the world. If memory serves, the institute has some 250+ scientists across many disciplines doing research on a wide variety of topics. They freely share their findings with scientists all over the world. Since the institute opened in 1999, they have published over 660 papers. They are working on every aspect of aging, working to find ways not only to prevent some of aging’s effects but maybe also to cure them.
The two-day program I’ll attend is literally packed with researchers who will do TED-type talks on what they’re finding. Your humble analyst will be talking about some of the sociological and economic issues surrounding aging. And serendipitously, my great friend and doctor, Dr. Mike Roizen, will be presenting on how the Cleveland Clinic is helping its staff to get younger – until, as he says, the Buck can take over and do the rest. And with the glaring exception of myself, the presenters are all a who’s who of aging research. As you can tell, I am pumped, because this is one of those topics that I find myself really intrigued by and immersed in.
It is time to hit the send button. The gym is calling, and there are weights that need to be pushed, pulled, shrugged, and lifted. I’ve been training with The Beast for over two years now. We do a lot of work on my shoulders and around the neck area. My neck is literally 1.5 inches bigger now than it was 15 years ago, when I hardly ever did anything in the gym that focused on that part of the body. One of the things I’m going to have to do when I’m in Hong Kong is go to a local tailor and get a bunch of new dress shirts so that I can actually comfortably wear a shirt and tie. Not a bad problem to have, all in all. Have a great week!
Your wondering what will end the complacency analyst,

John Mauldin
subscribers@MauldinEconomics.com
Copyright 2017 John Mauldin. All Rights Reserved

Ability is a poor man’s wealth.
- Wren
The reaction when the market starts to correct is the same; run for the hills, the world is ending or some variation of that theme. However, if you spend a little time on looking at the history of the markets; one thing becomes clear. Those that panic gets hammered and those that remain calm walk away with the spoils.
One way to visually see the “deviation factor” is through the use of standard deviation bands. Many software programs on the market will automatically fill in the Standard Deviation (SD) bands; Ideally, the setting should be set at 3SD from the norm, but settings of 2SD will suffice if you are unable to alter the settings manually. When the markets touch these ranges, and the trend is up, then backing up the truck is the thing to do.

Big Charts does not allow you to change the settings, they are fixed at 2SD, but there are sites out there that will let you adjust the settings. Despite this limitation, one can immediately spot two great opportunities; 2003 and 2009, clearly illustrating that fear never pays. As long as Fiat is in play, the Fed will attempt to reflate the economy. Naysayer after naysayer has stated that one day the masses will wake up, well they are still waiting for that day. Most don’t even know what Fiat stands for, and even fewer are willing to give it up. There is a saying don’t fight the Fed, and so far that saying has held true.
Strong corrections falling in the 2SD ranges and beyond should be embraced. From a long-term perspective, every back-breaking correction or crash has proven to be a buying opportunity. Knowing the trend does help and we put that to maximum usage; it’s for this reason we have adamantly stated that the Bull Market the bears were calling an end for would not end shortly. Several years later, and the Bull as we foretold remains strong; the bull market will end but not before the crowd embraces it like a long lost love
Stock market crashes should be viewed through a bullish lens,
But how do you get out of the market at the right time, First of all, forget about trying to time the exact top, instead focus on the emotion? When the crowd turns euphoric, it is time to take money of the table and or tighten your stops. As you can see from the latest reading below the crowd is still antsy.

This is an old bull market, and it continues to trend higher because the crowd is still nervous and the most individuals think this market cannot and should not trend higher; that is why it probably will continue to trend higher. For almost several years on end we have been stating that this bull market would trend higher than the most ardent of bull’s expectations and so far that’s exactly what this bull market has done.
History never changes; the markets will experience one very strong correction before this bull keels over. The problem is that the masses have been waiting for a strong correction since roughly 2013. The ironical part is that the markets will pull back strongly, but most likely they will be trading at a higher level than they were at 2013. In 2013 the Dow was trading in the 12,800-13,000 ranges. While it is possible that the Dow could drop to this level, it is a low probability event as the masses are far from Euphoric at the moment. Most likely the Dow will shed 25%-30% from its highs. Assume the Dow trades to 22K; at the extreme end, the Dow could drop to the 15,600 ranges. Market Update June 18, 2017
Until the trend turns negative, we can only make educated guesses regarding the intensity of the next correction. As Fiat money rules the world, even more, money will be poured into the next created financial disaster, which will eventually push the market to new all-time highs. Until the people reject Fiat, the Fed will continue to create boom and bust cycles purposely; that is their primary agenda. Examine the history of the Fed, and you will see that they have gone out of their way to create these cycles. Volatility is a trader’s best friend and the higher the market trends, the more volatile the ride. As the volume of the money supply increases so will the volatility.
Ability will never catch up with the demand for it.
Malcolm S. Forbes
By Sol Palha

 1. Beef Up Your Portfolio With Small Cap Superior Performance
by Michael Campbell & Ryan Irvine
For the past 18-years Ryan Irvine has had a remarkable track record with average returns well over 30% annually over the last 4 years. Ryan tells Michael and the Money Talks audience today about the cash generating and under followed small-cap stocks that he has found. Between 1926 – 2004 Small-cap stocks averaged a 15.9% return compared to only 9.26% for Large Caps and thats the reason Warren Buffet laments he has grown to large to buy them.
2. Coal Fueled Teslas
Several countries are making proclamations that state all new cars shall be electric by a certain date. Who decided on electric cars? I know they sound “clean” but where does that electricity come from?
3. Germans Have Quietly Become the World’s Biggest Buyers of Gold
The worlds biggest investors shifted hands to Germany in 2016, with investors there ploughing as much as $8 billion into gold coins, bars and exchange-traded commodities (ETCs). This set a new annual record for the European country.
How cool would it be to take photos or videos just by blinking your eye?
Now imagine telescopic vision. Or, infrared night-vision.
It would be like having superpowers. And you could have them sooner than you might think – with a contact lens.
Alphabet (GOOGL), Sony Corp. (SNE) and Samsung Electronics Co. Ltd.(SSNLF) have all filed patents on ways to make smart contact lenses.
 These contact lenses use tiny electronic antennas and optical sensors to record video and take pictures. But that’s just the beginning.
The technology is real. It is happening.
For investors, that opens a new avenue of possibilities.
Soon, contact lenses could help you zero-in on objects like a hunting hawk. Or, pierce the night like a prowling cat. Adding facial-recognition software would mean that you could always call people by name – even if you’d forgotten meeting them.
This is the kind of thing that would not have been possible even a decade ago. However, exponential advances in information technology have led to better product modeling, and even new miniaturization processes.
The combination means almost anything is now possible. I call it the New Gilded Age. That’s because, just like 150 years ago, we find ourselves in a truly golden age of invention, and opportunity.
A contact lens with a built-in camera certainly pushes the limit of what most people believe is possible. It is not hard to imagine augmented-reality and other cool applications.
Add an earpiece and a network connection, and first responders get superpowers …
- Police officers could identify suspects by surveying a crowd.
- Paramedics might gain access to a victim’s medical records after visual identification.
- Such a device would save countless lives.
The concept was science fiction until 2008. Researchers at the University of Washington managed to successfully test a prototype that involved an integrated circuit, a radio receiver and an LED.
In 2016, DARPA, the research division for the Department of Defense, challengedthe technology community to drastically reduce the size of printed circuit boards through modularity. Shrinking the circuit boards reduces the time and energy required to move data.
DARPA has its own motives …
Officials claim the new architecture would be perfect for identifying objects in real-time video feeds, and coordinating fast-moving swarms of unmanned aerial vehicles.
It would also help shrink the electronics required for a contact lens camera system.
So far, all the patents filed by major technology companies involve a multi-layered system.
There is an antenna to wirelessly transfer data to another device, like a smartphone. There is a circuitry component, involving a microprocessor and autofocus image pickup sensor. The Sony patent makes reference to onboard storage, but it’s not clear how that would work.
For power, each patent experiments with some form of kinetic energy. The idea is to harness the power created from natural blinking. Somehow, the devices will differentiate deliberate blinking, which will control the user interface.
It all seems incredibly complicated. Then again, we are talking about tiny sensors attached to a contact lens.
Yes, sensors are where it all begins. They have been a hot investment theme for several quarters, and my members have been aboard for the ride.
I began recommending sensor-making companies because sensor data is vital to the digital economy. For example, some sensors detect ultrasonic sounds, proximity, temperature and touch. Others can act as 3-D scanners.
In a world with camera-ready contact lenses, sensors will play an even bigger role.
However, sensors are merely the tip of the spear. New compounds and manufacturing processes will need to be developed for miniaturization. Many companies will profit from this trend.
The time to begin investing in the technology of companies like Cognex Corp. (CGNX), the leading maker of sensors and vision systems for industrial robots, is now.
While contact lenses with built-in cameras may seem far-fetched, such systems are already possible. Their investment story is here now.

-
I know Mike is a very solid investor and respect his opinions very much. So if he says pay attention to this or that - I will.
~ Dale G.
-
I've started managing my own investments so view Michael's site as a one-stop shop from which to get information and perspectives.
~ Dave E.
-
Michael offers easy reading, honest, common sense information that anyone can use in a practical manner.
~ der_al.
-
A sane voice in a scrambled investment world.
~ Ed R.
Inside Edge Pro Contributors

Greg Weldon

Josef Schachter

Tyler Bollhorn

Ryan Irvine

Paul Beattie

Martin Straith

Patrick Ceresna

Mark Leibovit

James Thorne

Victor Adair