
Wealth Building Strategies
$1T+ CLUB IS DOMINATED BY U.S. BASED ASSET MANAGERS
In the late 1700s, it was the start of the battle of stock exchanges: in 1773, the London Stock Exchange was formed, and the New York Stock Exchange was formed just 19 years later.
And while London was a preferred destination for international finance at the time, England also had laws that restricted the formation of new joint-stock companies. The law was repealed in 1825, but by then it was already too late.
In the U.S., exchanges in New York City and Philadelphia took full advantage by dealing in stocks early on. Eventually, for this and a variety of other reasons, the NYSE emerged as the most dominant exchange in the world – helping propel New York and Wall Street to the center of finance.
THE CENTER OF FINANCE
Wall Street, and the U.S. in general, is now synonymous with finance – and most of the world’s largest banks, funds, and investors maintain a presence nearby. The biggest asset management companies, which pool investments into securities such as stocks and bonds on behalf of investors, are no exception to this.
Today’s chart shows all global companies with over $1 trillion in assets under management (AUM).
Not surprisingly, all but 17.1% of assets managed by this $1 Trillion Club are overseen by companies based in the United States.


Even further, outside of Northern Trust (Chicago), Pimco (Newport Beach), and Capital Group (Los Angeles), the remaining U.S. companies are based in the Northeast specifically – either on Wall Street, or just a short drive away.
THE NEWEST ENTRANT
The newest entrant to the $1 trillion club is Norway’s sovereign wealth fund, which is managed by Norges Bank Investment Management. It’s the world’s largest sovereign wealth fund, and it was “never forecast” to get so big.
The Norwegian fund recently joined France’s Amundi ($1.6 trillion), the UK’s Legal & General ($1.3 trillion), and Japan’s Goverment Pension Investment Fund ($1.2 trillion) as non-U.S. members of this exclusive club.
The Chart of the Week is a weekly Visual Capitalist feature on Fridays.

The US Dollar is still interesting and attractive to investors, despite the statistical fluctuations.
The US labor market statistics in September was surprising, but not as impressive as it might have been.
Improvements in the Unemployment Rate and the Average Hourly Earnings will allow the US Federal Reserve to tighten its monetary policy.
The first October week was quite effective for the American Dollar. The main currency pair updated the low at 1.1668 it reached on August 17th and then was corrected bit, but made perfectly clear that there might be more declines. If there is a reason, the “bears” will come quickly.
The US labor market statistics in September is astonishing. The numbers were expected to be quite high, but the market was really surprised by the readings it saw. The Unemployment Rate was 4.2% in September after being 4.4% the month before. This is the lowest value of the indicator since 2001, over 16 years. It’s highly unlikely to be a mistake: the Participation Rate increased up to 63.1% against 62.9% in August. It appears that the labor market is really feeling good.
Another positive thing is the growth of the Average Hourly Earnings. In September, it expanded by 0.5% m/m after adding 0.2% m/m in the previous month and against the expected reading of 0.3% m/m. On YoY, the indicator increased by 2.9%. That’s a very good result.
However, this is where good news ended. The Non-Farm Payrolls decreased by 33K, although it was expected to expand by 82K after adding 169K the month before. The report says that the decline in some industries likely reflected the impact of hurricanes Irma and Harvey, which made the country nervous last month. But if one takes a closer look at the NFP numbers published in July and August, one can see that the indicator was revised downwardly twice. If one adds the September reading to this period of time, the overall picture won’t be very promising. Still, the fact that the US labor market is usually pretty stable makes all above-mentioned numbers look not so horrible. It means that the September decline will be eliminated in October or November, unless there are some serious stresses of course.
The Unemployment Rate and the Average Hourly Earnings data shows that the inflation in the USA is rising. This, in its turn, supports the Federal Reserve in its intentions to tighten the monetary policy. After they published the September reports on the employment, expectations relating to the key rate increase in December 2017 increased up to almost 80%, according to the CME futures. This was the reason why the USD rose.

The best way to see investors’ attitude to the USD is the EUR/USD pair behavior. Let’s take a look at the H4 chart, which shows the downtrend. The key element of the current movement is the price’s consolidating around the support level, and one of the most possible scenarios implies that it may return to the upside border of the descending channel. One of the targets close to the resistance level is the retracement of 61.8% at 1.1875. If this scenario continues, we can expect the price to rebound from the upside border and resume falling to reach 1.16. also, we shouldn’t exclude a possibility that the instrument may break the current resistance level and start forming a new rising impulse. The main short-term target of this impulse will be the local high at 1.2092.
Author: Dmitriy Gurkovskiy, Senior Analyst at RoboForex

Attention!
Forecasts presented in this section only reflect the author’s private opinion and should not be considered as guidance for trading. RoboForex bears no responsibility for trading results based on trading recommendations described in these analytical reviews.

Oct 10, 2017

- The traditional post jobs report rally for gold is in full swing. Please click chart above to enlarge or here now. Double-click to enlarge this daily gold chart. Gold arrived at a key Fibonacci line at about $1268 as the US jobs report was released.
- Please click here now. Double-click to enlarge. The dollar has stalled against the yen, and that’s also good news for gold.
- Gold tends to stage great rallies in the days following the jobs report, and this rally is a particularly interesting one. Here’s why:
- First, Trump has ratcheted up his “hawk talk” in regards to North Korea and Iran. He’s scheduled to make a key speech on Thursday about Iran, a country which is now exporting two million barrels of oil a day.
- Second, the Chinese government recently chopped commercial bank reserve requirements. That triggered a massive rally in bank stocks around the world, and in most stock market indexes.
- Chinese citizens tend to buy more gold when stock markets are rallying and economic sentiment is positive.
- Friday also marked the last day of COMEX gold trading during the Golden Week holiday in China. Chinese gold markets are now open again, and eager buyers are clearly in action.
- Perhaps most importantly of all, on Friday the Indian government cancelled the “Know Your Client” rule for gold jewellery buyers and that happens just in time for the launch of Diwali.
- Please click here now. This is pretty big news for gold price enthusiasts around the world.
- Given all of this gold-positive news, it’s pretty easy to understand why gold has bounced so firmly from the $1268 area Fibonacci line.
- Fundamentally, there is nothing negative for gold right now. Gold has rallied after every rate hike. It did that in the 1970’s as the Fed Funds rate soared to 20%. The precious metals and the mining stocks soared like a flock of golden eagles as that happened, and 2018 could see that repeated, albeit on a smaller scale.
- The Fed has three rate hikes scheduled for 2018, and aggressive quantitative tightening (QT). By December of 2018, money velocity should reverse and begin a long term bull cycle.
- The QE money ball is essentially “toast”. Bond prices will get a haircut as rates rise and QT accelerates. Money will pour out of government bonds and central banks and into the fractional reserve banking system, and… into gold.
- Please click here now. Central banks and governments have not propped up their economies since the 2008 financial crisis occurred.
- What they have done is prop up financial markets while insidious inflation and no wage gains on Main Street have seen the plight of the average citizen get worse.
- That can change. Please click here now. Donald Trump’s three main campaign promises were to cut taxes, chop the price of the US dollar against other fiat currencies, and to give government bond market creditors a haircut.
- His promises are essentially a mechanism to move a portion of the fifteen trillion dollars in financial markets liquidity towards Main Street. He has yet to do that, but I think 2018 will probably be recorded in history books as “The Golden Year”.
- I’m predicting that 2018 will be the year that Trump begins talking more openly about the bond market and the need for creditors to be realistic about what they can expect to get paid.
- Along with the “motherlode” of positive demand coming out of China and India, Trump’s actions and words should help make 2018 the year that gold ends its sideways trading pattern of the past three years, and starts a significant trending move higher.
- Please click here now. Double-click to enlarge this fabulous silver chart. There’s a beautiful inverse head and shoulders bottom formation in play, with an ultimate target in the $22 area.
- Please click here now. Double-click to enlarge this key GDX chart. GDX has started a strong rally. All fundamental lights are green for the entire precious metals asset class.
- Most technical lights are green, except for one. Please click here now. Double-click to enlarge. My “line of concern” at $1300 relates to the head and shoulders top neckline that gold is rallying towards now.
- The technical target of that pattern is about $1215. Whether the “Queen of Assets” can successfully surge through that neckline area is likely to be determined in the short term by Trump’s speech on Thursday about Iran. In the medium term, it will be determined by the amount Diwali gold demand that appears (or doesn’t) over the next two weeks.
- Tactics? Nervous investors should buy put options and buy them today! On the buy-side, the key for gold bugs is to be light buyers of all their favourite precious metals investments if gold trades at $1270 and to be substantially bigger buyers at $1215 or lower. Do that, while cheering that the price only goes higher!
Thanks!
Cheers
st
Oct 10, 2017
Stewart Thomson
Graceland Updates
website: www.gracelandupdates.com

The rise in the market has seemed unstoppable. Despite the Federal Reserve continuing to hike interest rates and tightening monetary policy, geopolitical risks from North Korea to Iran, mass shootings, failure of legislative agenda and weak economic growth – the market’s rise has continued unabated.
Much of the recent rise, as discussed last week, has been based upon faulty assumptions about the effect of tax cuts and reforms. However, in the short-term, it is always the exuberance of market participants chasing returns as the “fear of missing out,” or FOMO, overrides the logic of fundamentals.
The problem for investors is that since fundamentals take an exceedingly long time to play out, as prices become detached “reality,” it becomes believed that somehow “this time is different.”
Unfortunately, it never is.
Our chart of the day is a long-term view of price measures of the market. The S&P 500 is derived from Dr. Robert Shiller’s inflation adjusted price data and is plotted on a QUARTERLY basis. From that quarterly data I have calculated:
- The 12-period (3-year) Relative Strength Index (RSI),
- Bollinger Bands (2 and 3 standard deviations of the 3-year average),
- CAPE Ratio, and;
- The percentage deviation above and below the 3-year moving average.
- The vertical RED lines denote points where all measures have aligned
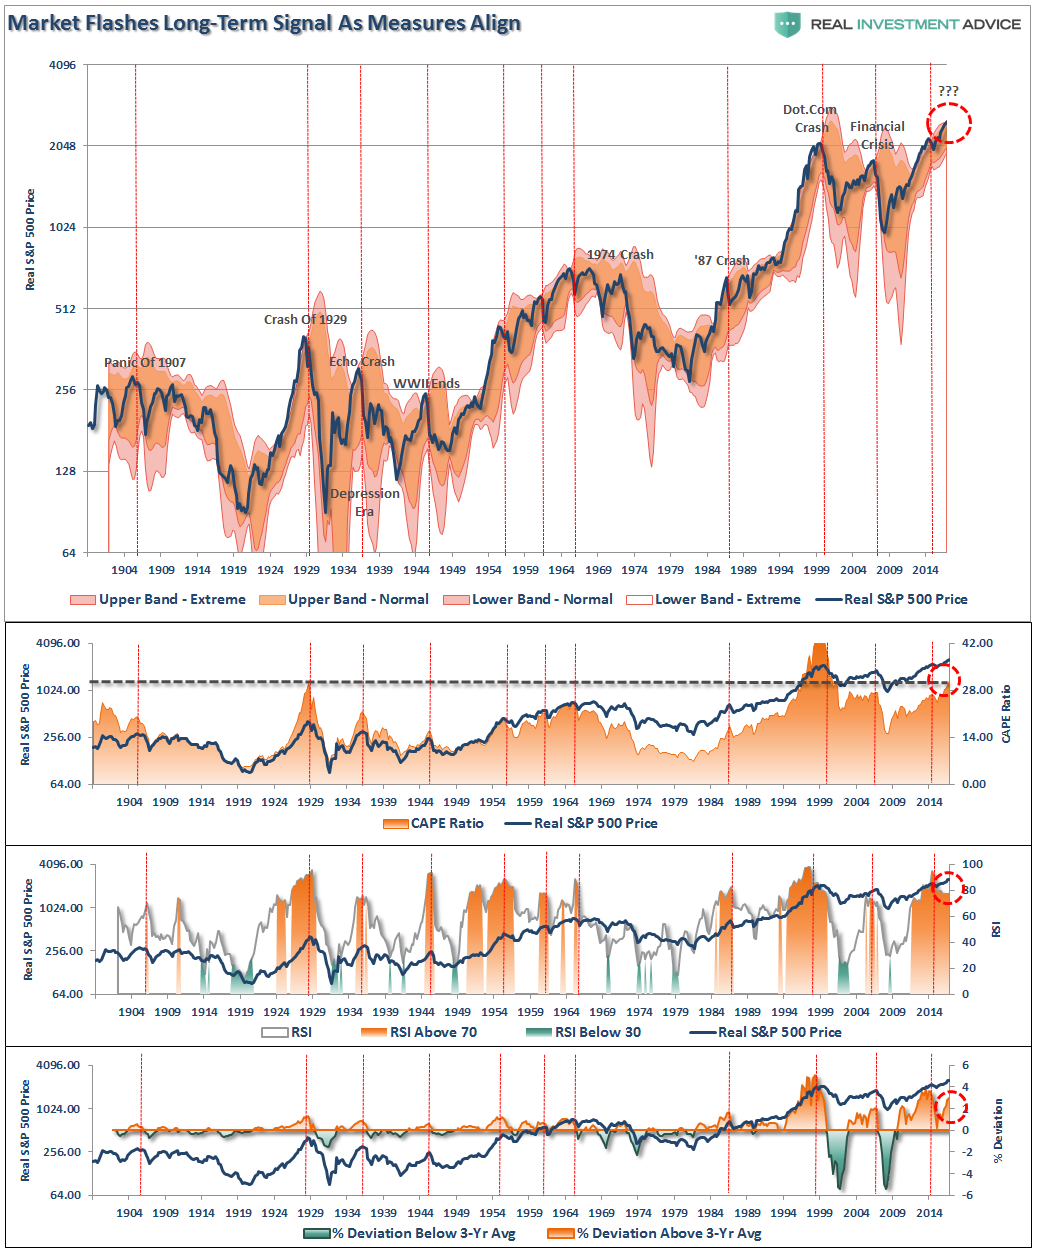
Over the next several weeks, or even months, the markets can certainly extend the current deviations from long-term mean even further. But that is the nature of every bull market peak, and bubble, throughout history as the seeming impervious advance lures the last of the stock market “holdouts” back into the markets.
As Vitaliy Katsenelson penned last week:
“Our goal is to win a war, and to do that we may need to lose a few battles in the interim. Yes, we want to make money, but it is even more important not to lose it.
We are willing to lose a few battles, but those losses will be necessary to win the war. Timing the market is an impossible endeavor. We don’t know anyone who has done it successfully on a consistent and repeated basis. In the short run, stock market movements are completely random – as random as you’re trying to guess the next card at the blackjack table.”
I wholeheartedly agree with that statement which is why we remain invested, but hedged, within our portfolios currently. Unfortunately, for most investors, they are currently playing with a losing hand.
As the chart clearly shows, “prices are bound by the laws of physics.” While prices can certainly seem to defy the law of gravity in the short-term, the subsequent reversion from extremes has repeatedly led to catastrophic losses for investors who disregard the risk.
With sentiment currently at very high levels, combined with low volatility and excess margin debt, all the ingredients necessary for a sharp market reversion are currently present. Am I sounding an “alarm bell” and calling for the end of the known world? Should you be buying ammo and food? Of course, not.
However, I am suggesting that remaining fully invested in the financial markets without a thorough understanding of your “risk exposure” will likely not have the desired end result you have been promised.
As I stated above, my job is to participate in the markets while keeping a measured approach to capital preservation. Since it is considered “bearish” to point out the potential “risks” that could lead to rapid capital destruction; then I guess you can call me a “bear.” However, just make sure you understand that I am an “almost fully invested bear”…for now.
But such can, and will, rapidly as the market dictates.
(Follow up read on how to approach the market: The 80/20 Rule Of Investing)
Just remember, in the market there really isn’t such a thing as “bulls” or “bears.” There are only those that “succeed” in reaching their investing goals and those that “fail.”
Lance Roberts

Lance Roberts is a Chief Portfolio Strategist/Economist for Clarity Financial. He is also the host of “The Lance Roberts Show” and Chief Editor of the “Real Investment Advice” website and author of “Real Investment Daily” blog an

 Within a twenty-four-hour span the Catalonian people voted 90 percent in favor of secession from Spain, despite the Spanish government’s effort to violently squelch the referendum, and a man in a Las Vegas hotel room opened fire on a concert, killing fifty-nine and wounding over 500. There’s no tangible connection between the two incidents, but they illustrate incipient forces still gathering steam that are transforming the world.
No government, military force, or intelligence unit has figured out how to stop those determined to kill large numbers of people if the killers are willing to forfeit their own lives. Nor will they. Individuals and small groups have the capability to amass and use large amounts of lethal weaponry, killing military and civilian targets in a guerrilla war, or victims on the deadly end of their random bullets or bombs.
Arguments that this can stopped by limiting access to weaponry are specious, serving only as cover for further expansion of government and curtailment of individual liberty. The trend towards cheaper, more widely distributed killing power stretches back to the invention of gun powder. Guns can now be manufactured at home with 3D printers. The cows left the barn long ago.
Standing in opposition to the forces of decentralized violence are the forces of centralized violence, governments….


-
I know Mike is a very solid investor and respect his opinions very much. So if he says pay attention to this or that - I will.
~ Dale G.
-
I've started managing my own investments so view Michael's site as a one-stop shop from which to get information and perspectives.
~ Dave E.
-
Michael offers easy reading, honest, common sense information that anyone can use in a practical manner.
~ der_al.
-
A sane voice in a scrambled investment world.
~ Ed R.
Inside Edge Pro Contributors

Greg Weldon

Josef Schachter

Tyler Bollhorn

Ryan Irvine

Paul Beattie

Martin Straith

Patrick Ceresna

Mark Leibovit

James Thorne

Victor Adair