
Bonds & Interest Rates
 It’s easy for me to sit back and take pot shots at the hedge fund gurus calling for a repeat of the 2008 crash. Spouting words about markets never repeating the previous crisis is kind of cheap. If I am so sure history won’t repeat, why don’t I offer an alternative theory?
Well, at the risk of embarrassing myself, here it goes.
The biggest risk out there is not credit. It is not the monster short VIX speculative position. It is not CDX leverage.
The true DANGER AHEAD lies in the universal belief that treasuries (and other sovereign fixed income) offer a perfect hedge versus risk assets.

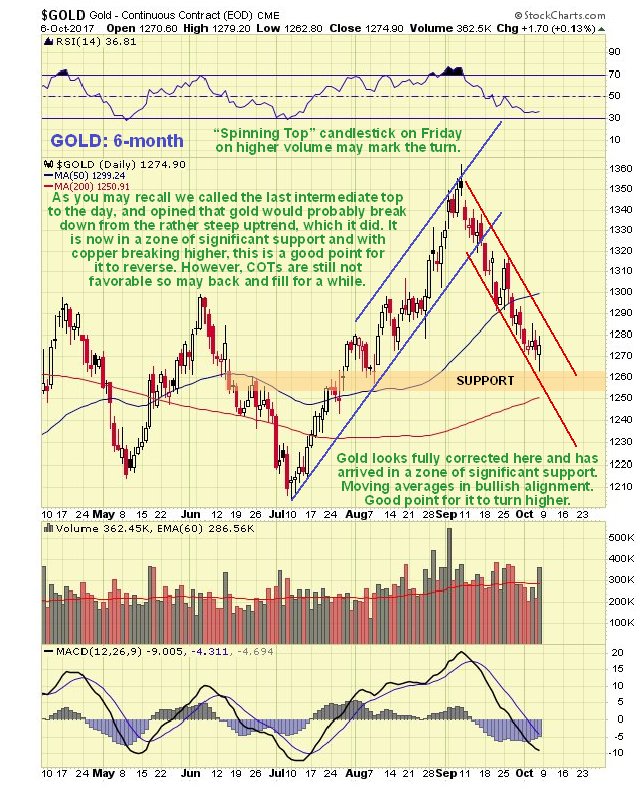
The last Gold Market update almost a month ago called the intermediate top within a day, as you may recall, and the subsequent Gold and US Dollar Interim update called the rally in the dollar the day before it started. Having seen a significant reaction back by gold, the question now is “Has it run its course?” The short answer to that is yes, although calling a bottom here is complicated by the fact that gold’s COTs have not eased as much on the reaction as we might have expected, and the dollar Hedgers’ chart is still flat out bullish for the dollar. What this means is that we may need to see some bottoming action by gold, even if it soon breaks out of its rather steep short-term downtrend, and another possibility that we will examine is that the dollar and gold rally in tandem, a rare circumstance that could be occasioned by an extreme development such as an attack on North Korea, although if this happens the peoples of Seoul and Tokyo will doubtless have more important things to think about than the price of gold.
On gold’s latest 6-month chart we can see how the reaction of recent weeks has retraced about 50% of the prior rally, as tensions with N Korea have temporarily eased. This reaction has more than fully corrected the overbought condition resulting from the rally, and has brought gold back into a zone of significant support just above its rising 200-day moving average, and with moving averages in bullish alignment, conditions generally favor a reversal and rally. The “spinning top” candlestick that occurred on Friday on increased volume may mark the turn, although the candlesticks that occurred on the charts for silver and silver proxies look like more convincing reversals.
An important factor having a bearing on the outlook for the Precious Metals was the nice reversal in copper on Thursday after a significant reaction, with it gaining nearly 3%…
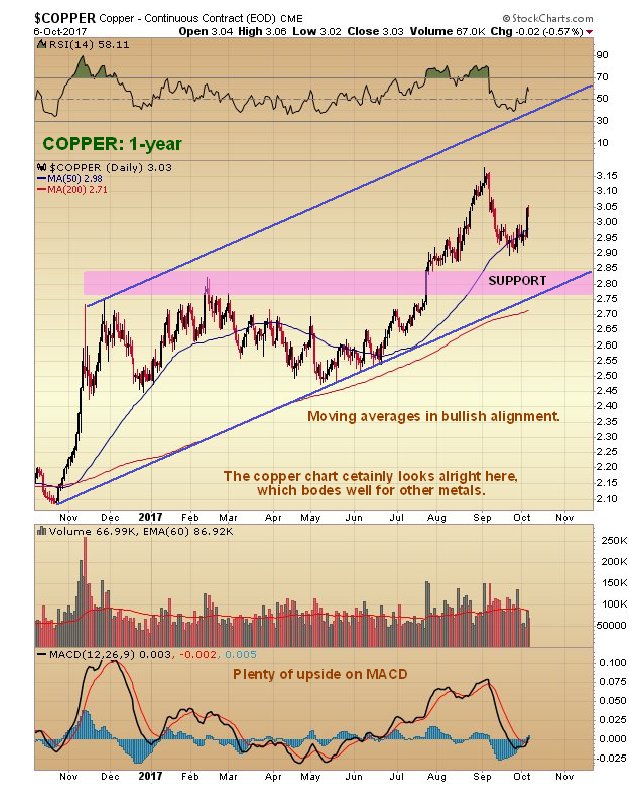
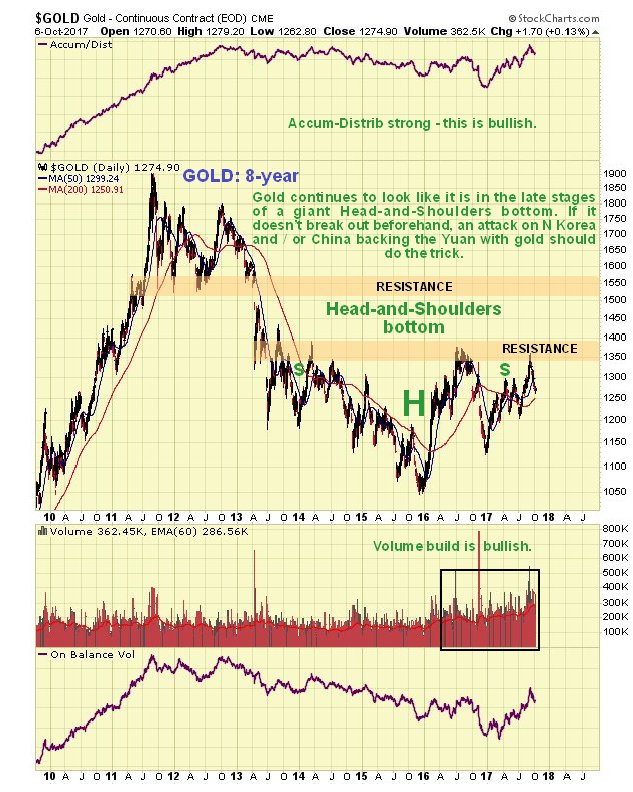
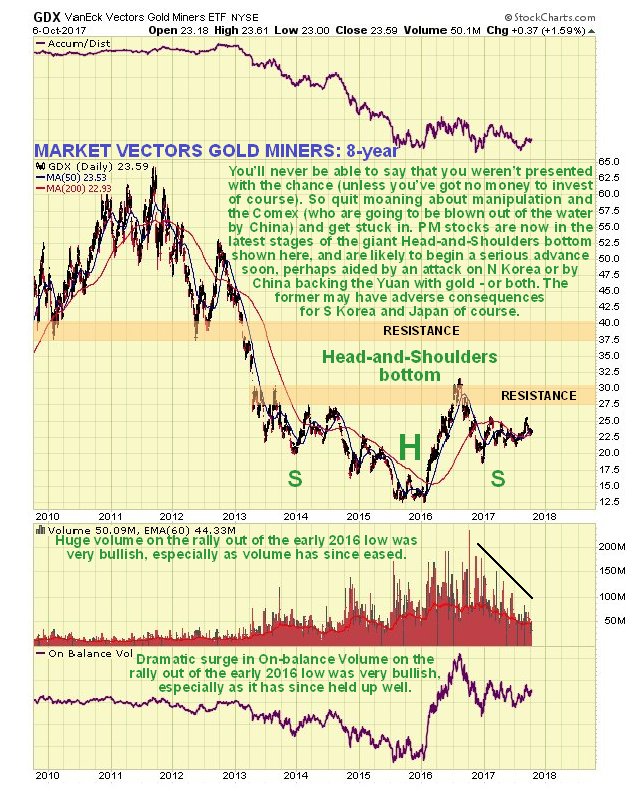
Given that copper tends to lead other metals as it did on the last rally, this could well be followed by gold and silver reversing to the upside after their reaction back to support, despite the dollar looking like it has further to rally. Another positive factor for gold and silver is that there was a full moon late last week and the Precious Metals often reverse on either the new or full moon, although astrologically silver is ruled by the moon and gold by the sun, which may explain why the Incas, famous for their gold, worshipped the sun – which makes a lot more sense than many of the other things that get worshipped. If you think that is wacky, try this for size – eclipses are thought by many astrologers to be a baleful omen, and you may recall that on August 21st a total eclipse of the sun slashed right across the US from coast to coast. Soon after, the country was clobbered by a succession of natural disasters, in addition to Donald Trump’s Tweetstorms, with 3 massively destructive hurricanes impacting Texas, then Florida, and lastly Puerto Rico. Coincidence? – I think not. On gold’s 8-year chart it continues to look like it is in the late stages of a giant Head-and-Shoulders bottom pattern. The buildup in volume over past 20 months certainly looks positive, especially over the past several months, all the more so because it has driven volume indicators higher, notably the Accum-Distrib line, which is not far off making new highs – exceeding its level at the 2011 peak. Once gold breaks above the resistance level approaching $1400 it will be on its way, although it will then have to contend another important band of resistance in the $1510 – $1560 range.
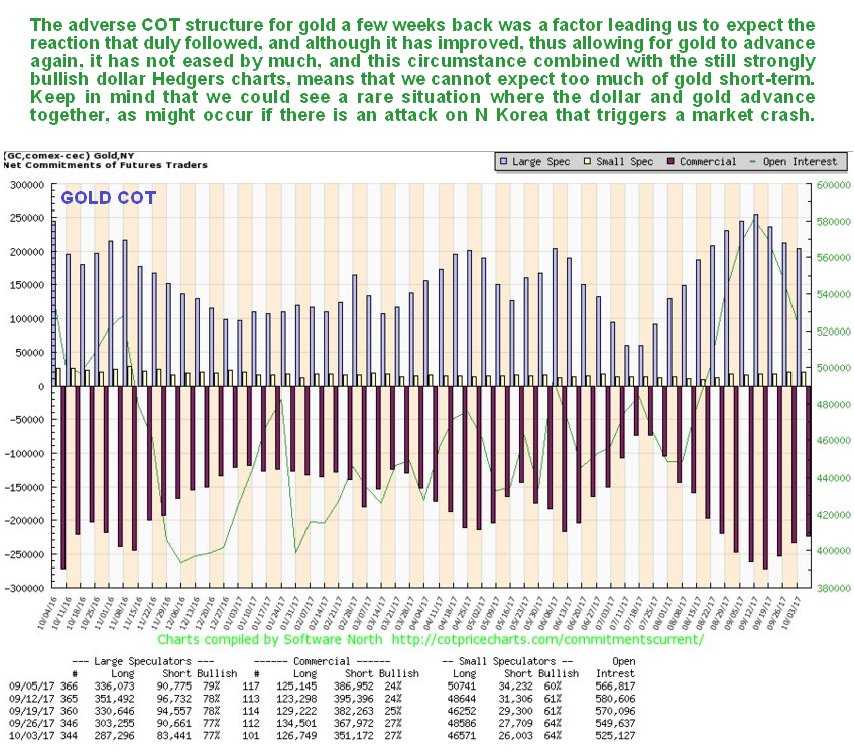
The latest COT chart for gold shows that, while positions have certainly eased on the reaction of recent weeks, they have not eased by as much as one would expect, which sounds a cautionary note and suggests that a rally now may be stunted, and followed by more basing action before a larger uptrend can gain traction. This accords with what we are seeing on the dollar charts, especially the latest dollar Hedgers chart.
Click on chart to popup a larger, clearer version. The Market Vectors Gold Miners, GDX, which functions as a gold stocks index, is marking out a giant Head-and-Shoulders bottom that roughly parallels the one completing in gold itself. The fact that the price is still well below the strong resistance at the top of this reversal pattern means that prices for many gold (and silver) stocks are still very favorable. The volume pattern during the build out of this base pattern is very bullish, with big volume on the rise out of the low (Head) of the pattern, tailing off steadily as the Right Shoulder has formed.
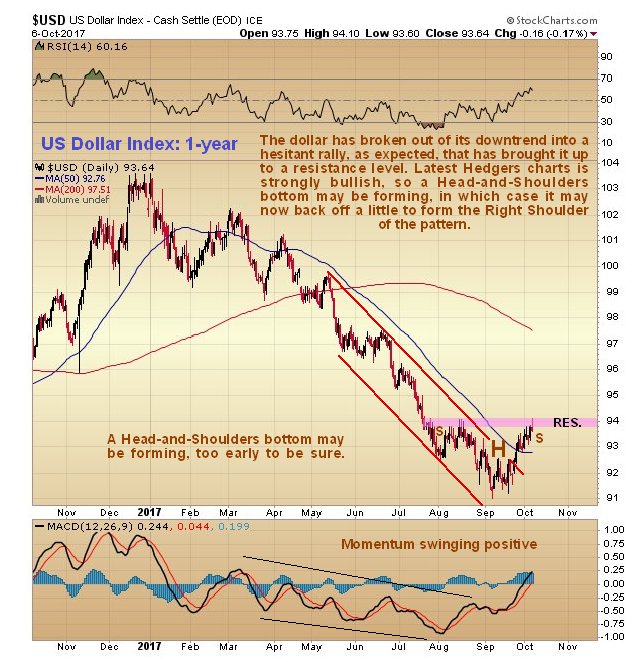
The dollar looks like it has put in an intermediate bottom. On the 1-year dollar index chart shown below, we can see that it has broken out of its downtrend by a significant margin and looks like it may be marking out a Head-and-Shoulders bottom, although it is still too early to be sure. If it is then we will see a shallow dip to mark out the Right Shoulder of the pattern before it then turns higher.
The latest dollar Hedgers chart certainly looks bullish, with the large Commercial Hedgers having cleared out their short positions…
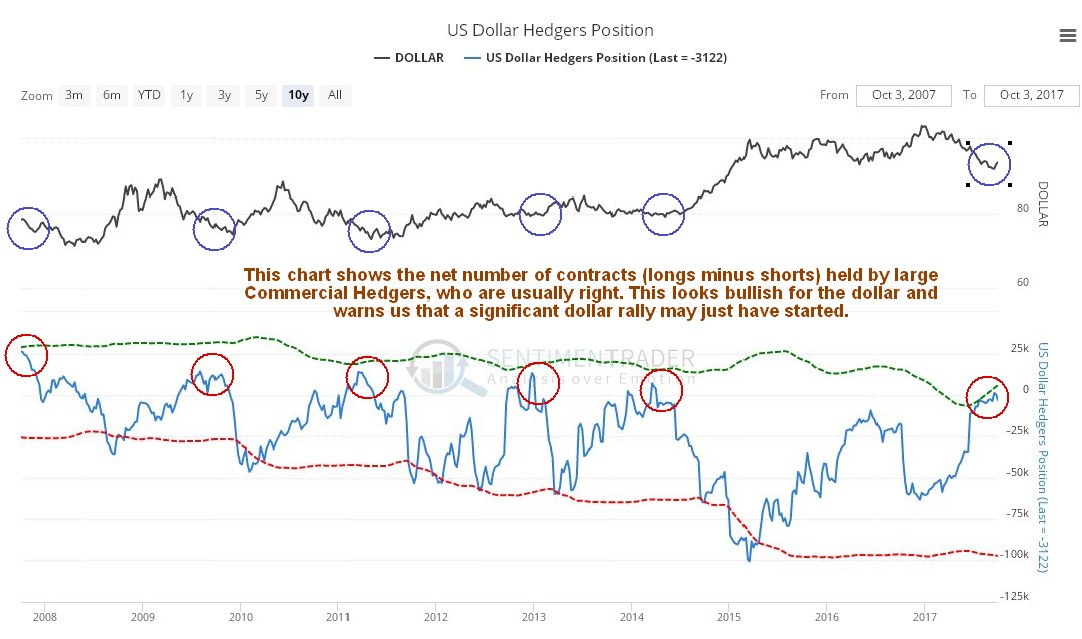
Click on chart to popup a larger, clearer version. Chart courtesy of www.sentimentrader.com
Although we cannot reconcile this positive dollar outlook for the medium-term (long-term outlook remains bearish) with a positive outlook for the Precious Metals sector, there are times when the dollar and gold and silver rally together. This could happen for example if some drastic action is taken with respect to North Korea.

MamaMancini’s Holdings (MMMB:OTCQX) is a marketer and distributor of a line of food products, primarily meat balls – the company reported a record quarterly results this past week. We let you know if it is a BUY, SELL or HOLD?


 1. The Wall Street Journal Called Him The Highest Paid Economic and Financial Forecaster in the World – he’s here for you right now.
by Michael Campbell & Martin Armstrong
The World’s top forecaster tell you what keeps him up at night. Hint: it will impact you
2. Mr. Market, what are you telling us about the dollar?
by Jack Crooks
I have a few different scenarios in my mind and find all of them plausible (see, Orwell’s Doublethink lives in the minds of traders). My continuous question as I watch currency price action: Mr. Market, what are you telling us about the dollar?
Three simple scenarios now rattling in my head:
3. Marc Faber Warns of Another Market Crash
Peter Schiff touches on a key point the feel-good-investor must now consider: we have never seen a Federal Reserve try to unwind a balance sheet of this size before, no less against the backdrop of robo-trading and real-time news.
Bitcoin was spoken about at the Sohn Investment Conference. On CNBC we read:
Dan Morehead, chairman of digital currency exchange Bitstamp, said bitcoin and other digital currencies will likely become assets serious investors will want in their portfolios.
“Bitcoin’s essentially going to revolutionize currency, or money,” Morehead said on Wednesday at the Sohn Investment Conference in San Francisco, which was attended by portfolio managers and asset allocators.
“If it does work, the upside is so high, it’s a rational, expected thing to have in your portfolio,” he said.
First of all, Morehead is obviously interested in the success of Bitcoin as he heads up a digital currency exchange. So, you have to take his assertions with a pinch of salt. Having said that, there are parts of this assessment we agree with. The most important one might be that “serious investors” will indeed want to hold Bitcoin. Actually, they might want to hold Bitcoin already. While it might not be public knowledge, it might be the case that as much as 5% of hedge fund managers have small stakes in Bitcoin. At the same time, only 0.5% of hedge funds would actually hold the currency. This might be indicative of the interest of “smart money” in Bitcoin. Hedge funds might be very interested in including Bitcoin in their portfolio but they either don’t have the technical means to do so or are wary of unclear legal status of the currency. If you recall what happened with gold after the first large gold ETF was set up in 2004, this might be the kind of thing to expect from Bitcoin. So, if we do see a Bitcoin ETF, we might see a lot more buying fueled by people who currently want to hold Bitcoin but cannot.
For now, let’s focus on the charts

Bitcoin after Rebound
On BitStamp, we saw a period of depreciation. This came on the heels of a rebound. Recall our recent comments:
There is no change in that Bitcoin has stayed above the 38.2% retracement in a visible way. The outlook is now more bullish than before, at least for the short term, as the currency has held up above the support. The one change that we saw was the move above the 23.6% retracement which is a bullish indication. Based on the current price, we wouldn’t rule out a move to the recent all-time high, or even slightly above it.
The depreciation we have seen has brought Bitcoin back to the 23.6% retracement and even slightly below it. The tiny breakdown is not verified and we wouldn’t draw serious conclusions from this fact but rather wait for a confirmation. Right now, it seems that the situation is slightly less bullish than it was a couple of days ago but the environment hasn’t changed enough to consider speculative positions.
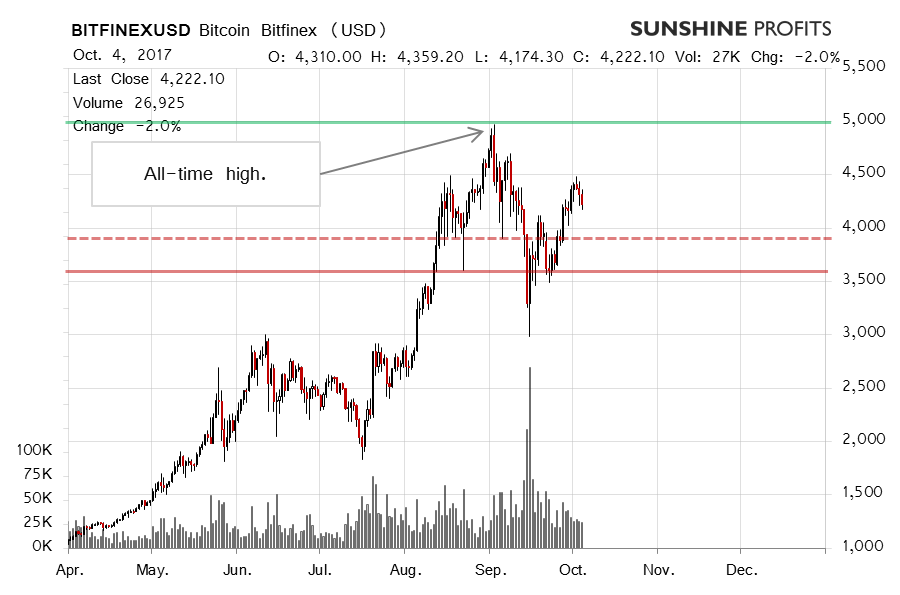
On the long-term Bitfinex chart, we see the tiny pullback from the recent move up. In our previous alert, we wrote:
The more significant move above the 38.2% retracement is not yet visible from the long-term perspective. Also, most of the action to the upside has transpired today (this is written after 12:00p.m. ET). Currently, the situation seems slightly more bullish than was the case previously since the currency is above the 38.2% level, above the recent downtrend and also the currency hasn’t broken down below this level convincingly for some time now. So, we might be seeing more strength in the market. The problem with that is that the volume is clearly low in relative terms and not much action to the downside could result in the conclusions being reversed. (…)
As noted earlier, the move to the upside extended and we not only saw the move above the 38.2% retracement but also above the 23.6% retracement. At the moment, we might see a move back to the all-time high as the move below several retracements has been invalidated. If this is in fact the case, $5,000 might be the level defining whether we see yet another extension or a reversal.
1. Bitcoin is below the 23.6% retracement but this doesn’t necessarily have very strong implications for the next couple of days. Right now, our take is that Bitcoin might be in for further appreciation since the currency has managed to stay above several support levels for some time now. At the same time, any move forward might be limited by the recent all-time high. At the moment, it seems that Bitcoin is showing strength, but this conclusion might be reversed relatively quickly.
2. If you have enjoyed the above analysis and would like to receive free follow-ups, we encourage you to sign up for our daily newsletter – it’s free and if you don’t like it, you can unsubscribe with just 2 clicks. If you sign up today, you’ll also get 7 days of free access to our premium daily Gold & Silver Trading Alerts. Sign up now.
Regards,
Mike McAra
Bitcoin Trading Strategist
Sunshine Profits: Gold & Silver, Forex, Bitcoin, Crude Oil & Stocks
* * * * *
Disclaimer
All essays, research and information found above represent analyses and opinions of Mike McAra and Sunshine Profits’ associates only. As such, it may prove wrong and be a subject to change without notice. Opinions and analyses were based on data available to authors of respective essays at the time of writing. Although the information provided above is based on careful research and sources that are believed to be accurate, Mike McAra and his associates do not guarantee the accuracy or thoroughness of the data or information reported. The opinions published above are neither an offer nor a recommendation to purchase or sell any securities. Mr. McAra is not a Registered Securities Advisor. By reading Mike McAra’s reports you fully agree that he will not be held responsible or liable for any decisions you make regarding any information provided in these reports. Investing, trading and speculation in any financial markets may involve high risk of loss. Mike McAra, Sunshine Profits’ employees and affiliates as well as members of their families may have a short or long position in any securities, including those mentioned in any of the reports or essays, and may make additional purchases and/or sales of those securities without notice.


-
I know Mike is a very solid investor and respect his opinions very much. So if he says pay attention to this or that - I will.
~ Dale G.
-
I've started managing my own investments so view Michael's site as a one-stop shop from which to get information and perspectives.
~ Dave E.
-
Michael offers easy reading, honest, common sense information that anyone can use in a practical manner.
~ der_al.
-
A sane voice in a scrambled investment world.
~ Ed R.
Inside Edge Pro Contributors

Greg Weldon

Josef Schachter

Tyler Bollhorn

Ryan Irvine

Paul Beattie

Martin Straith

Patrick Ceresna

Mark Leibovit

James Thorne

Victor Adair