
Asset protection

“I wrote a series of articles on the Fed versus History. If you thought the Fed could keep us out of recession, you would be a bull. If you thought History would prevail, you should stay out of the market. I bet on History. Time has shown that History won that fight. History is a tough opponent. Betting against History is usually a losing proposition.”
September 2008 seems so long ago now. The experiment of global QE has proven from the last 9 years that the $700 billion bailout in 2008 did not end the crisis, but kicked off a world that became addicted to ongoing bailouts….
….also:
If You Want To Know How Crazy Things Really Are Right Now, Take A Look At This… (hint, take a look at the chart below! – Ed)


Highlights
-
Bob Hoye of Institutional Advisors rejoins the show with an update on the Bitcoin phenomenon.
-
For the first time in economic history, the masses have a chance to grab the reigns of the money supply, central banks are no longer required.
-
While institutions such as JP Morgan spread negative rhetoric on the cryptocurrencies, many continue to secretly accumulate vast stockpiles.
- Elliott wave analysis suggests that Bitcoin (BTC) should retrace from the recent $5,000 peak to at least $2,600.
- Still, the BTC rocketship could continue unabated skyward to $10,000.
- The PTB will continue to struggle against cryptos as their system unravels at an increasing pace.
- The Greenback is now jeopardized by the introduction of a gold backed petrol contract in China.
- The petrol-dollar arrangement of 1974 must now compete in the East with a petrol-gold-Yuan alternative.
- Financial bubbles are now the new norm, including junk bonds, US equities, domestic real estate in Canada and even some cryptocurrencies.
- A few legendary technophiles, such as John McAfee and Marketwatch.com are suggesting that Bitcoin could climb to a peak of at least $500,000.
- The S&P has eclipsed year 2000 bubble levels by many metrics, including P/E ratios and Bob Hoye’s top indicators.
- The credit spread and yield curve remain positive, so equities could continue to surprise on the upside, but the risk offers a meager expected return.
Bob Hoye of Institutional Advisors rejoins the show with an update on the Bitcoin phenomenon. For the first time in economic history, the masses have a chance to grab the reigns of the money supply, central banks are no longer required, at least in the digital realm. While institutions such as JP Morgan spread negative rhetoric on the cryptocurrencies, many continue to secretly accumulate vast stockpiles of Bitcoin, including JP Morgan. While Elliott wave analysis suggests that Bitcoin should retrace from the recent $5,000 peak to at least $2,600, perhaps even further, the rocketship could continue unabated skyward to $10,000. Nevertheless, the PTB will continue to struggle against cryptos as their system unravels at an increasing pace. Similar to 1914 as the Pound Sterling began to wane as the de facto reserve currency due in part to national debt accumulated from two World Wars, the Greenback is now jeopardized by the introduction of a gold backed petrol contract in China. Ergo, the petrol-dollar arrangement of 1974 must now compete in the East with a petrol-gold-Yuan alternative. Financial bubbles are now the new norm, including junk bonds, US equities, domestic real estate in Canada and even some cryptocurrencies. A few legendary technophiles, such as John McAfee and Marketwatch.com are suggesting that Bitcoin could climb to a peak of at least $500,000, in three years time. The S&P has eclipsed year 2000 bubble levels by many metrics, including P/E ratios and Bob Hoye’s top indicators. The credit spread and yield curve remain positive, so equities could continue to surprise on the upside, but the risk may not warrant a meager expected return.


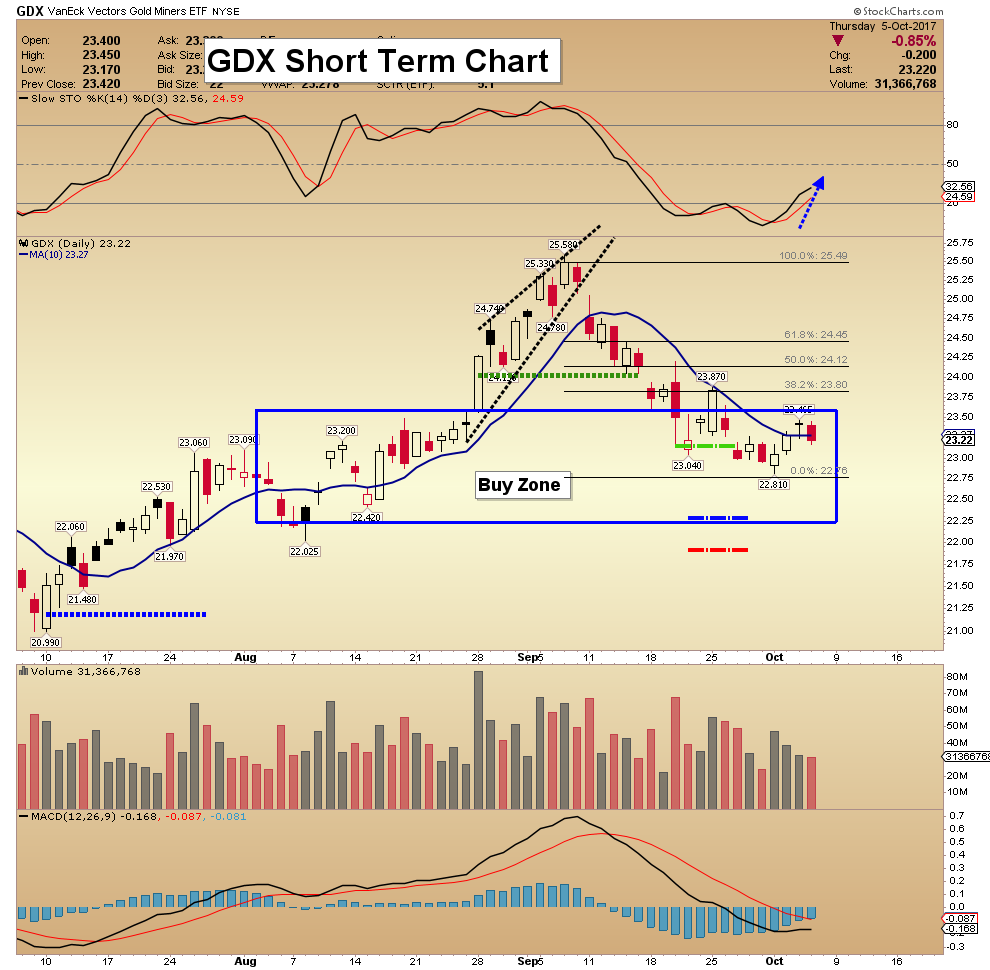
Today’s videos and charts (double click to enlarge):
SFS Key Charts & Video Update


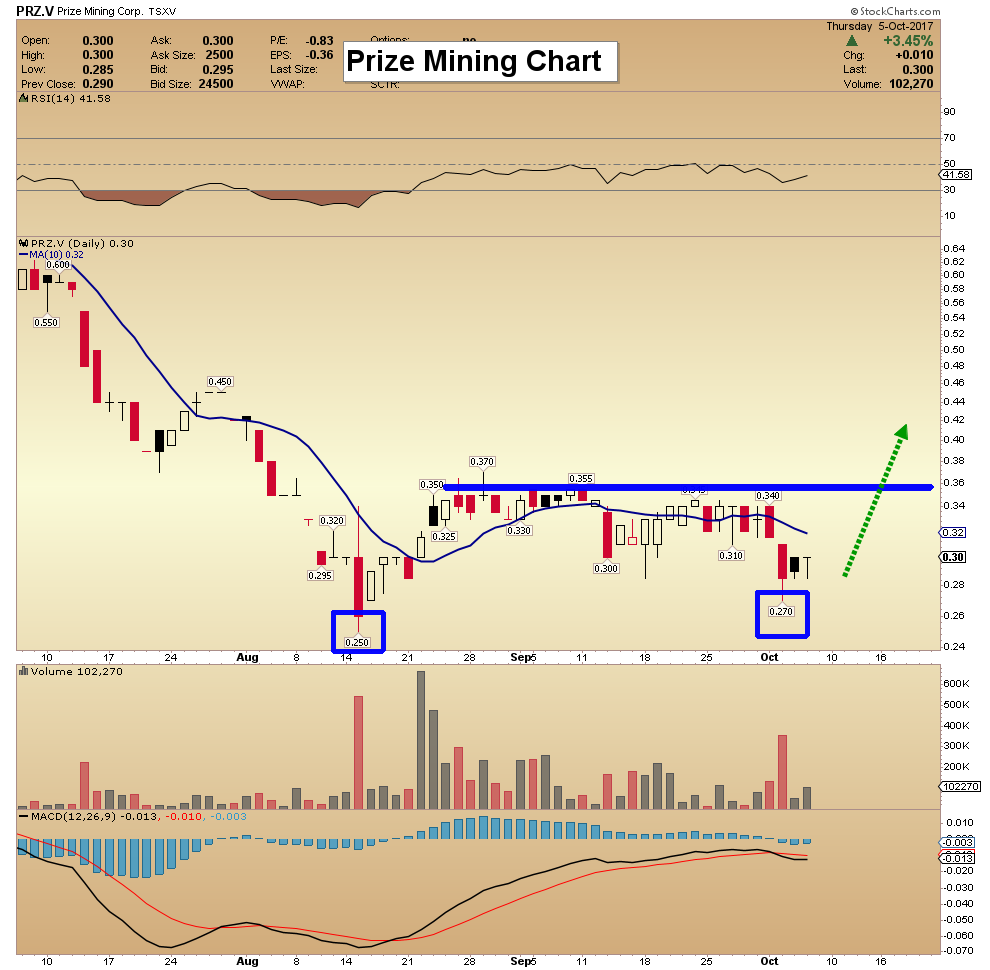
SF Juniors Key Charts & Video Analysis


SF Trader Time Key Charts & Video Analysis


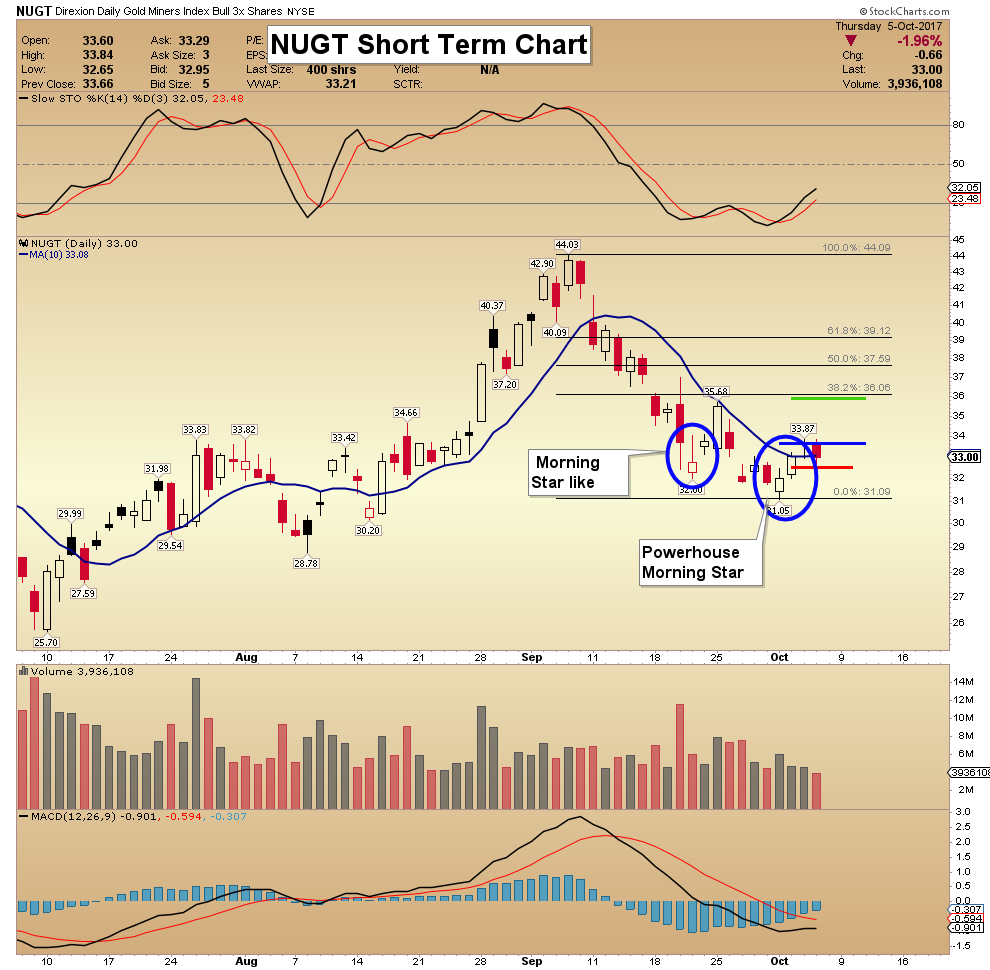
Morris
website: www.superforcesignals.com
About Super Force Signals:
Our Surge Index Signals are created thru our proprietary blend of the highest quality technical analysis and many years of successful business building. We are two business owners with excellent synergy. We understand risk and reward. Our subscribers are generally successfully business owners, people like yourself with speculative funds, looking for serious management of your risk and reward in the market.
Frank Johnson: Executive Editor, Macro Risk Manager.
Morris Hubbartt: Chief Market Analyst, Trading Risk Specialist.

With the Semiconductor sector below but hailing its all-time highs, a lot of images come to mind; chief among them the 1999-2000 stock market bubble…
In early 2013 we noted a progression that would go on to birth the current economic expansion and stock market boom (of course, I didn’t come close to envisioning the extent of the boom that followed). I’ve belabored it often since, but here’s the short version of the progression yet again…
Fiscal Cliff drama resolves into market relief after Q4 2012 and this occurs right around the time we noted that Semiconductor Fab equipment bookings were ramping up → which projected a ramp in the cyclical Semiconductor industry → which would lead general manufacturing → which projected broader economic firming → which projected improving employment → and with ISM currently booming and the Semi cycle in full swing, voila, we are still on that continuum.
Speaking of which, and considering I am not one for subtlety, here’s the Continuum again so you have a cartoon to consider while digesting the rest of this post.

The Semiconductor cycle was born in 2013 just before long-term Treasury yields topped out into the climax of the Great Promotion Rotation hype that the financial media cooked up as a rationale for buying stocks. It turned out they did not need hype because over valuation and over speculation aside, the cycle was real and backed by firm economic activity.
But it was a Goldilocks recovery and to this very day the bond market has not changed its mind about that. If the backbone of the chart above (the red EMA 100) remains intact, the continuum… continues. We’ll return to the bond market a bit later in the post with some reasoning about why Janet Yellen or whoever replaces her may not be as lucky as the middle two mugs on the chart above.
So here we are nearly 5 years later and Semi Fab spending for 2017 has been robust and is projected the same for 2018. I’d tend to dismiss these projections as trend following happy talk as I would the average economist’s projections, but in this case SEMI is charged with being accurate for industry users, not with running promotions upon we financial sphere types* looking for macro signals. Ever since we got the lift off signal in January of 2013 I’ve watched closely to see if the rosy projections might be hype and all along they’ve been borne out. The only crack in the rose colored glasses is that the rate of change has faded from what is in essence the 2017 actual to the 2018 projection. It’s hardly a concern in and of itself.

Moving on to what would be the next step from a firming Semi cycle, manufacturing is brisk all these years later (although Callum Thomas points out a discrepancy between the Markit and ISM PMIs).

If ISM (which I trust as a data source) is right the signal is as good as it gets for the manufacturing sectors. However, a casual glance at respondents’ overall healthy view (ISM Report for September) shows that the recent Hurricanes factored quickly and heavily into pricing in the supply chain.
Headline PMI really does not mean much. New Orders and Employment are solid and backlogs are good too. The rest is noise factoring into the headline PMI. It’s a solid report but I saw a lot of financial media buzzing about the Prices reading at 71.50. Tune it out. It’s not going to create inflation or inject anything structural into the economic situation.

The ISM’s bottom line however, is that the readings were firm in August as well and if inflation expectations start to creep up and large financial interests and global sovereign Treasury bond holders become net sellers… inflation would be indicated. It could be a good old fashioned inflation like the post-2000 period, which has so many similarities to today (like a potential market blow off).
But with the Fed soon to be actively, albeit slowly, removing assets from its balance sheet as a remedy to Ben Bernanke’s decidedly over the top original actions, a wild card is in the mix that did not exist in 2000 on through the inflationary bull market overseen by Alan Greenspan. In that time frame, despite obvious inflation in the system, the bond market remained tame (as one look at that time frame on the 30yr Continuum above clearly shows) and supportive. After post-2008 unconventional policy was fire hosed in there must be distortions, the effects of which we have not yet felt.
After 2000, from low long-term Treasury yields the great credit/mortgage bubble was blown in reaction to the stresses in and around 2001. This then instigated mal-investment in the housing and mortgage markets, mal-pricing in the housing market and in a progression much uglier than the Semi cycle noted at the beginning of this post, eventually proceeded into new leveraged derivative products and vehicles by which Wall Street banks almost wrecked the financial system. Their salespeople sucked in not only gullible and unqualified home buyers, not only US institutions and municipalities, but institutions and investment entities all over the world. All due to the speculation that resulted from inflation-by-policy (i.e. money printing) permitted by low Treasury yields and the supposed “inflation vigilantes” that may in hindsight have been more myth than reality.
So we are left watching ‘inflation expectations’ signals from the bond market (still tame) and economic indicators in order to gauge how well the Fed is doing at boosting inflation. Dumping long-term Treasury bonds, if not regulated well, could eventually work to paint the macro in an opposite way that Operation Twist did. Maybe now this macro operation would paint inflation in, as opposed to Op/Twist’s goal of sanitizing it out of the system.

Again, the goal of Twist was to buy long-term bonds and sell short-term bonds, to force a flattening yield curve and hold long-term interest rates down. Enter the Goldilocks economy, as if by decree. But today the Fed is on the verge of doing the opposite, albeit slowly. They plan to sell long-term instruments back into the market while at the same time economic growth is brisk.
Nothing is a lock here in Wonderland, but with the world conditioned for decades by the secular decline in yields, what if the red line on the first chart above is taken out (above 3.3%), the bond bull ends and all bets currently aligned with the secular bond bull (yield decline) come off?
Bottom Line
We have a lot of similarities to 2000 except that back then Greenspan had the benefit of low yields, which provided the mechanics of the recovery (i.e. the credit bubble and inflationary bull market, which later melted down into the first “Great Recession”).
Today we have a market that has feasted off of the Goldilocks environment that was created by QEs 1-3 and a Twisted operation of brilliance by Ben Bernanke, the “hero”, who will have long since ridden off into the sunset.
Investment and risk management objectives would include some important dos and don’ts depending on what the Treasury bond market and the Continuum above, do. Be prepared with an open mind that considers a view of decades as opposed to days, weeks, months or years.
* Of course I’m not really a financial type. I don’t wear fancy suits and I’ve spent more years on a manufacturing shop floor than in my home office writing about markets (which at 13 years and counting is getting pretty long too).
NFTRH.com and Biiwii.com

 The late stages of financial bubbles are always tough for rational analysts. Focused as they are on the numbers, such analysts are relatively immune to the emotion that drives the action at market extremes, so they find themselves making predictions that turn out to be “wrong” for months and sometimes years.
Then the cycle turns and the rational analyst is vindicated – though often far too late for his bruised ego and diminished client base to easily recover.
[Recall the scene in The Big Short where hedge fund manager Michael Burry, after suffering months of abuse from his clients for shorting the 2006 housing bubble a bit early, is lambasted by a client who can’t believe Burry has, after the crash, gone long equities — because they’re clearly going to zero. In both cases Burry was right and his clients wrong, but he nevertheless closed up shop and quit the business.]
Anyhow, we’re there again, with governments manipulating all major markets to valuation levels at which previous crashes have occurred. This is leading analysts who focus on historical norms to issue warnings, which turn out to be wrong (stocks are setting new records as this is written), which draw derision from people who see no reason why the party ever has to end.
A good example is John Hussman, whose eponymous family of funds has been on the wrong side of this market for an uncomfortably long time. Yet he persists, because the numbers don’t lie. From his most recent report to clients:
So the mindset, I think, goes something like this. Yes, market valuations are elevated, but, you know, low interest rates justify higher valuations. Besides, there’s really no alternative to stocks because you’ll get what, 1% annually in cash? Look at how the market has done in recent years. There’s no comparison. Value investors who thought stocks were overpriced in recent years have been wrong, wrong, and wrong again, and even if they’re eventually right, being early is just the same as being wrong. The best bet is just to invest in a passive index fund for the long-term, and ignore the swings. There’s really no alternative.
What’s notable about this mindset is its excruciating reliance on three ideas. The first is that low interest rates “justify” rich valuations. The second is that market returns simply emerge as a kind of providence from a higher power, perhaps magical gnomes, or the Federal Reserve if you like, and that those returns have no particular relationship to valuations even in the long-term. The third is that market returns during the recent advancing half-cycle are an accurate guide to future outcomes.
In effect, stocks are viewed as good investments because they have been going up, and the evidence that stock prices will go up is that stock prices have gone up. Every additional market advance makes stocks look even better, based on past returns. Indeed, the more extreme valuations become, the more convinced investors become that extreme valuations don’t matter.
And that’s why we’re all gonna die.
A few insights may help to deconstruct this mindset. First, if one is going to invest one’s financial future in the stock market here, it’s worth making at least a cursory study of 5, 10 or even 20-year growth rates in population, labor force, productivity, S&P 500 revenues, earnings, real GDP, nominal GDP, and virtually every other measure of fundamentals. That exercise will quickly inform investors not only that the growth rate of fundamentals has persistently slowed from post-war norms in recent decades, but also that the underlying drivers of growth (primarily labor force demographics and productivity growth) are now running at rates that are likely to produce real GDP growth on the order of just 1% annually over the coming decade, while even a sizeable jump in productivity would likely result in sustained real GDP growth below 2% annually.
Unfortunately, this has implications for how one responds to interest rates, because the argument that “low interest rates justify higher valuations” relies on the assumption that the growth rate of underlying cash flows is held constant. Any basic discounted cash flow analysis will demonstrate that if interest rates are low because growth is also low, then no market valuation premium is “justified” by the low interest rates at all. Indeed, if both growth rates and interest rates are x% lower than their historical norms, then even a historically normal level of market valuation would be associated with subsequent market returns that are x% below historical norms. No valuation premium is required to produce this result.
The most reliable valuation measures we identify (those most strongly correlated with actual subsequent market returns) are about 2.5 to 2.7 times their historical norms here. Paying a valuation premium in this case simply causes prospective future market returns to collapse.
In order to provide the longest perspective possible, and also to offer a measure that can be easily calculated and validated should one choose to do so, the chart below shows my variant of Robert Shiller’s cyclically-adjusted P/E (CAPE), which has a correlation near 90% or higher with actual subsequent 10-12 year S&P 500 total returns in market cycles across history.
What investors presently take as a comfortable environment of pleasant market returns and mild volatility is actually, quietly, the single most overvalued point in the history of the U.S. stock market.

Hussman’s conclusion is, obviously, that a horrendous crash is coming. The problem is that this – and most other valuation measures – started flashing red in 2013, so warnings based on them now have a hollow ring.
Will they end up being be right? Without a doubt. And the longer the current exuberance goes on the bigger will be the subsequent crash. Somewhere out there is the perfect moment to short the hell out of this and pretty much every other country’s stock market. But only a tiny handful will nail it.

-
I know Mike is a very solid investor and respect his opinions very much. So if he says pay attention to this or that - I will.
~ Dale G.
-
I've started managing my own investments so view Michael's site as a one-stop shop from which to get information and perspectives.
~ Dave E.
-
Michael offers easy reading, honest, common sense information that anyone can use in a practical manner.
~ der_al.
-
A sane voice in a scrambled investment world.
~ Ed R.
Inside Edge Pro Contributors

Greg Weldon

Josef Schachter

Tyler Bollhorn

Ryan Irvine

Paul Beattie

Martin Straith

Patrick Ceresna

Mark Leibovit

James Thorne

Victor Adair