
Wealth Building Strategies
 Investors are being urged to not overlook Japan’s robotic future as unfavorable demographics reportedly are fueling innovation and investment opportunities.
“Japan, simply put, is in the midst of a robotics revolution that will transform nearly every aspect of society and be replicated, in some shape or form, around the world given the aging populations of Europe, the U.S. and even China,” the Financial Times reported.
Japan has been pushing on the robotics frontier for years. As a result, the use of robotics has expanded beyond the Japanese factory floor to include schools, hospitals, nursing homes, airports, train stations and even temples, the FT explained.
No other country in the world has strategically embraced robots as much, with the state’s revised Japan Revitalization Strategy seeking to achieve “a new industrial revolution driven by robots,” the FT said.
The FT explained that the best way to invest is by either directly owning leading Japanese robotics manufacturers and service providers, or through the ROBO ETF, with Japanese companies comprising roughly 30 per cent of the total market capitalization.
….also:
Steve Forbes: ‘Automation Actually Enriches the Economy’


The right software can change industries quickly.
For fast-moving companies like Airbnb, Stripe, Uber, Facebook, or Slack, the piping – such as the internet and smartphones – is already well-established, allowing these startups to scale at unprecedented speeds.
For 3D printing and other such “hard” technologies? Things end up being a lot more complicated.
A LONG TIME COMING
The rise of 3D printing reached peak hype years ago – and as far back as 2014, we were illustrating how 3D printing could ultimately shape the future of business. However, since those days, the technology has arguably fallen into the dreaded “trough of disillusionment” category on the famous Gartner Hype Cycle.
The harsh reality is that it’s just really hard to move things like 3D printing forward at the same type of speed as software. For the technology to scale at a commercial level, products would need to be flawless and intuitive from the get-go (they weren’t), and all engineering, technological, and design problems would need to be solved at lightning-quick speeds. Instead, it takes huge amounts of research, investment, patience, and iterations to get to the next level.
Today’s infographic comes to us from Raconteur, and it highlights a most recent snapshot of the 3D printing industry. Importantly, it shows that the technology is still chugging along in a way that is changing how things are made – just at a less hype-worthy pace.
BUILDING FROM GROUND UP
3D printing has now permeated practically every industry in at least some capacity, being used in a wide range of sectors from consumer goods to pharmaceuticals.
According to a report by EY, the potential for additive manufacturing is highest in the automotive and aerospace industries. For example, it’s expected that about half (49%) of automotive companies will use 3D printing to directly manufacture car parts in order to achieve operational efficiencies. These companies believe that 3D printing will help them address challenges such as demand for increased customization, continued improvement, and lightweight components.
As a result of increased demand and more familiarity with the technology, Gartner said shipments of 3D printers increased 108% between 2015 and 2016, resulting in 456,000 units shipped globally. More importantly, by 2020 this number will be at 6.7 million units, which would represent phenomenal growth for the technology.
As of today, most companies are still using 3D printers for accelerating product development, such as prototyping (34% of applications) and for proof of concept (23%). However, as 3D printing gets more use in additional areas – such as mass customization and collaboration on products – it’s possible the ship will really begin to sail, even if it was slightly delayed in getting out of the gate.


Tonight I would like to update some of the different commodities and emerging markets we took some positions in back in late July of this year. First, let me say that as investors we like everything to line up in perfect harmony so we can make some sense out of what is actually happening in the markets. It’s just human nature. For example, if the US dollar is doing this then the PM complex or the commodities should be doing that. There is a general rule that there is an inverse correlation between the US dollar and the PM complex or commodities, but it’s not always accurate.
Many times we can get bogged down trying to make everything fit perfectly before we make a trade. This can sometimes lead to missed opportunities as what we were expecting didn’t take place. For the most part this is one of the reasons why I prefer Chartology. When a pattern is building out the bears and bulls are making their side known by the battle they’re having with each other, which eventually creates a consolidation or reversal pattern. All the fundamentals that a stock has is also priced into the chart pattern.
Many times as investors we have to know why a stock is doing what it’s doing, from a fundamental point of view, which can begin to complicate things to the point where we become more confused than ever and can’t see the forest for the trees anymore. For me personally I try to keep it fairly simple by looking at what chart pattern is building out and base my buy or sell points by what the chart is suggesting. Nothing is perfect when it comes to trading the markets, but sometimes less is more.
I know right now many investors are seeing a stronger dollar and expect that commodities will head much lower based on the inverse correlation these two generally have which may in fact turn out that way. From a Chartology perspective many of the different commodities built out very large reversal patterns, which is going to be very hard to reverse those patterns. So regardless of what the US dollar is doing I have to go with what the chart patterns are suggesting.
Lets start by looking at a weekly chart for Copper which built out a very large 3 year inverse H&S bottom. About 3 months ago we got the breakout above its neckline telling us the bottoming process was complete. After a strong breakout move Copper is now pulling back to the breakout point forming a backtest to the neckline which will come in around the 2.75 area along with the 30 week ema. Until something changes this bullish setup I have to respect what the chart is saying regardless of what the US dollar is doing presently.
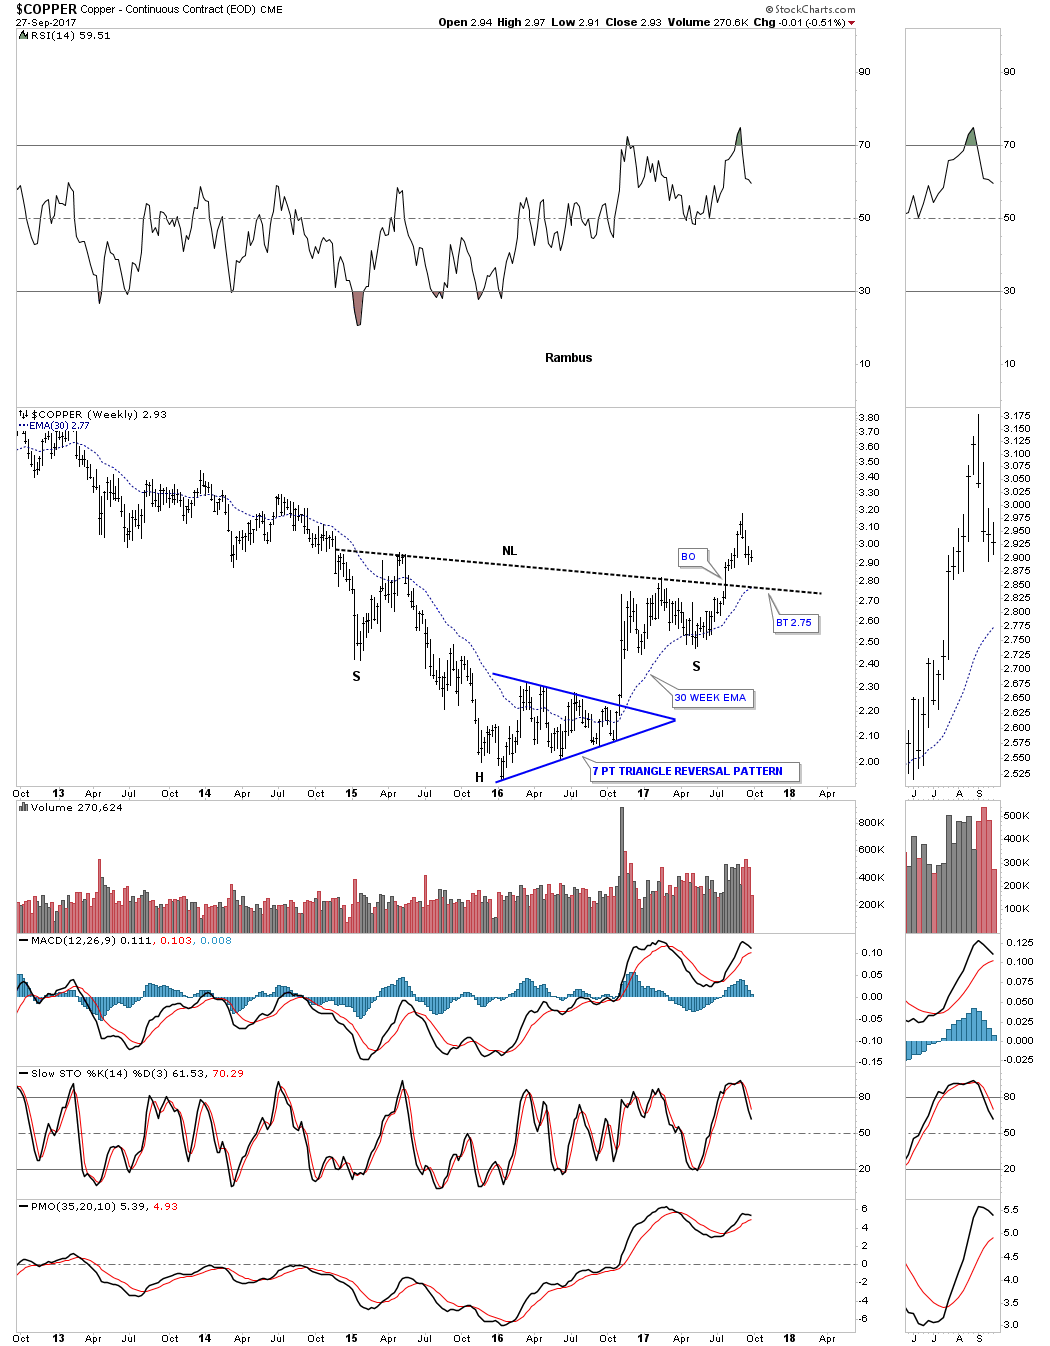
Double Click to Get Full Chart
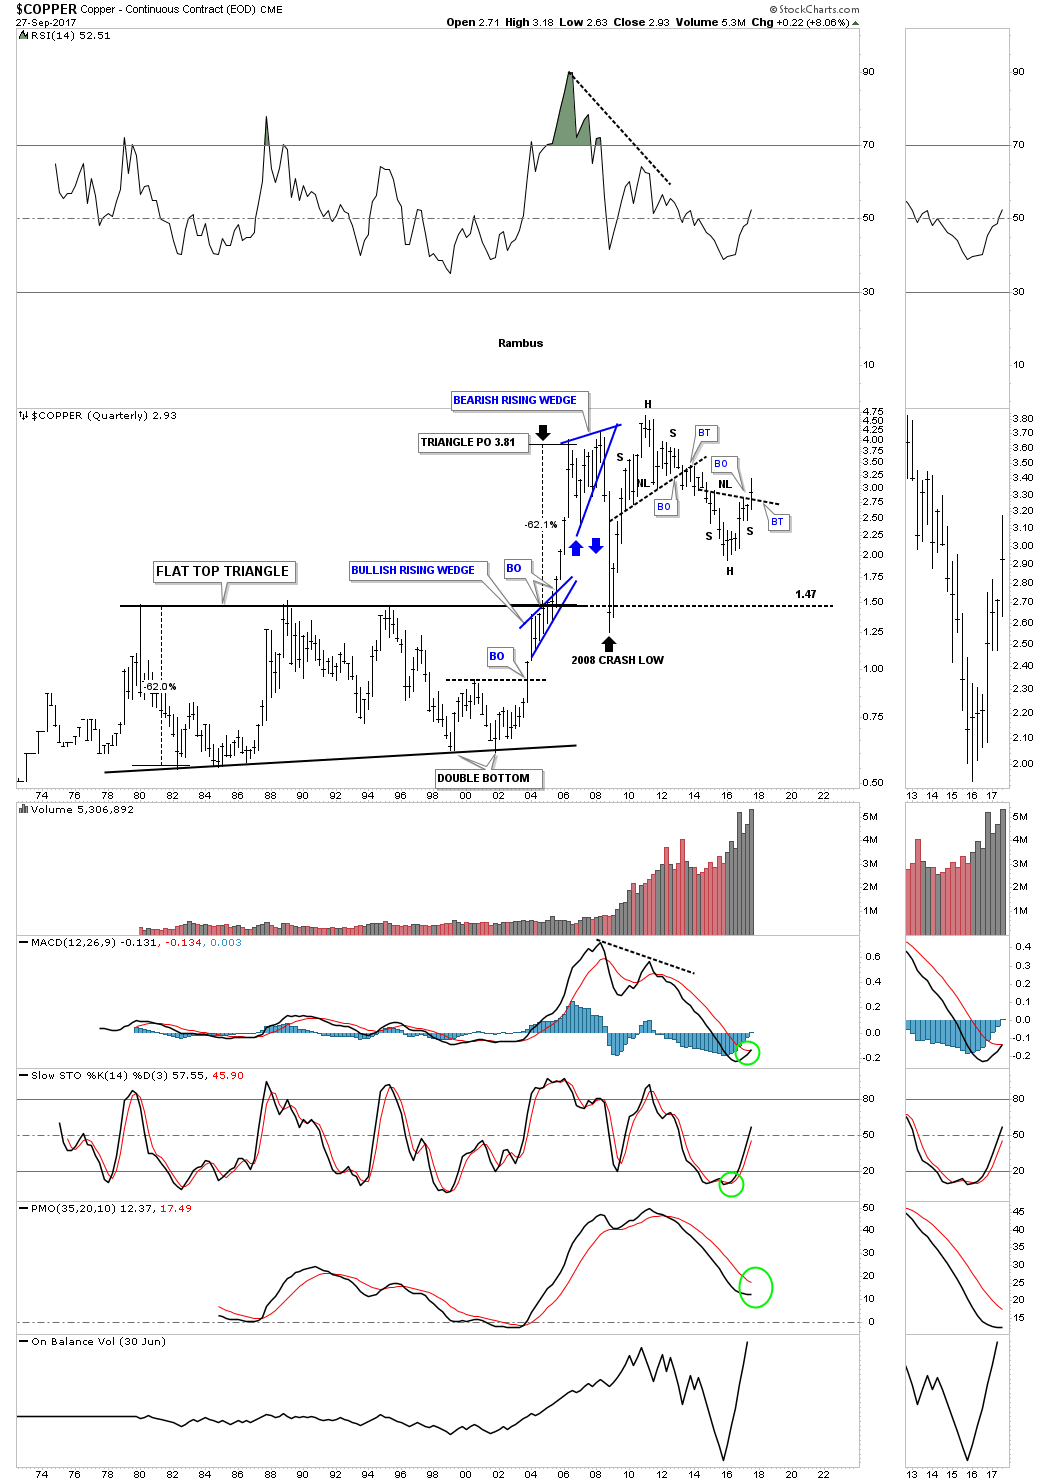
The 20 year monthly chart for Copper shows a very symmetrical H&S bottom forming after an almost 7 year decline. This is the area one would be looking for some type of reversal pattern to form.
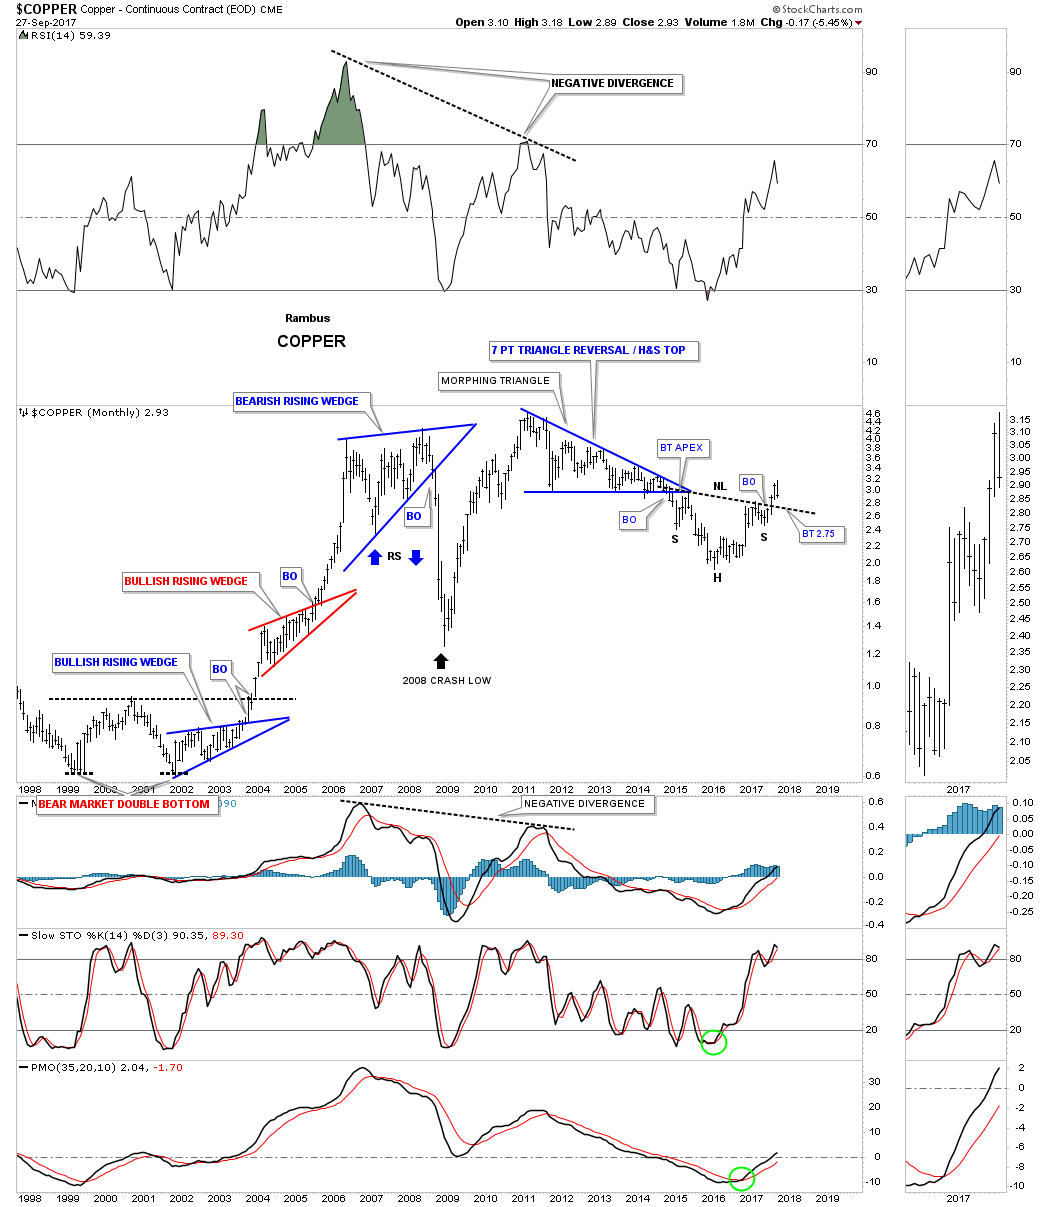
When one looks at this 45 year quarterly chart for Copper you can begin to see how our current H&S bottom fits into the very big picture. Note the beautiful H&S top that formed at the 2010 high. It took approximately 3 quarters for the breaking out and backtesting process to play itself out before the impulse move down began. Before we leave this chart Copper built out a 25 year flat top triangle which led to that strong impulse move up. Also note the blue bullish rising wedge which formed just below the top rail of that 25 year flat top triangle which gave Copper the energy it needed to finally take out that massive resistance line.
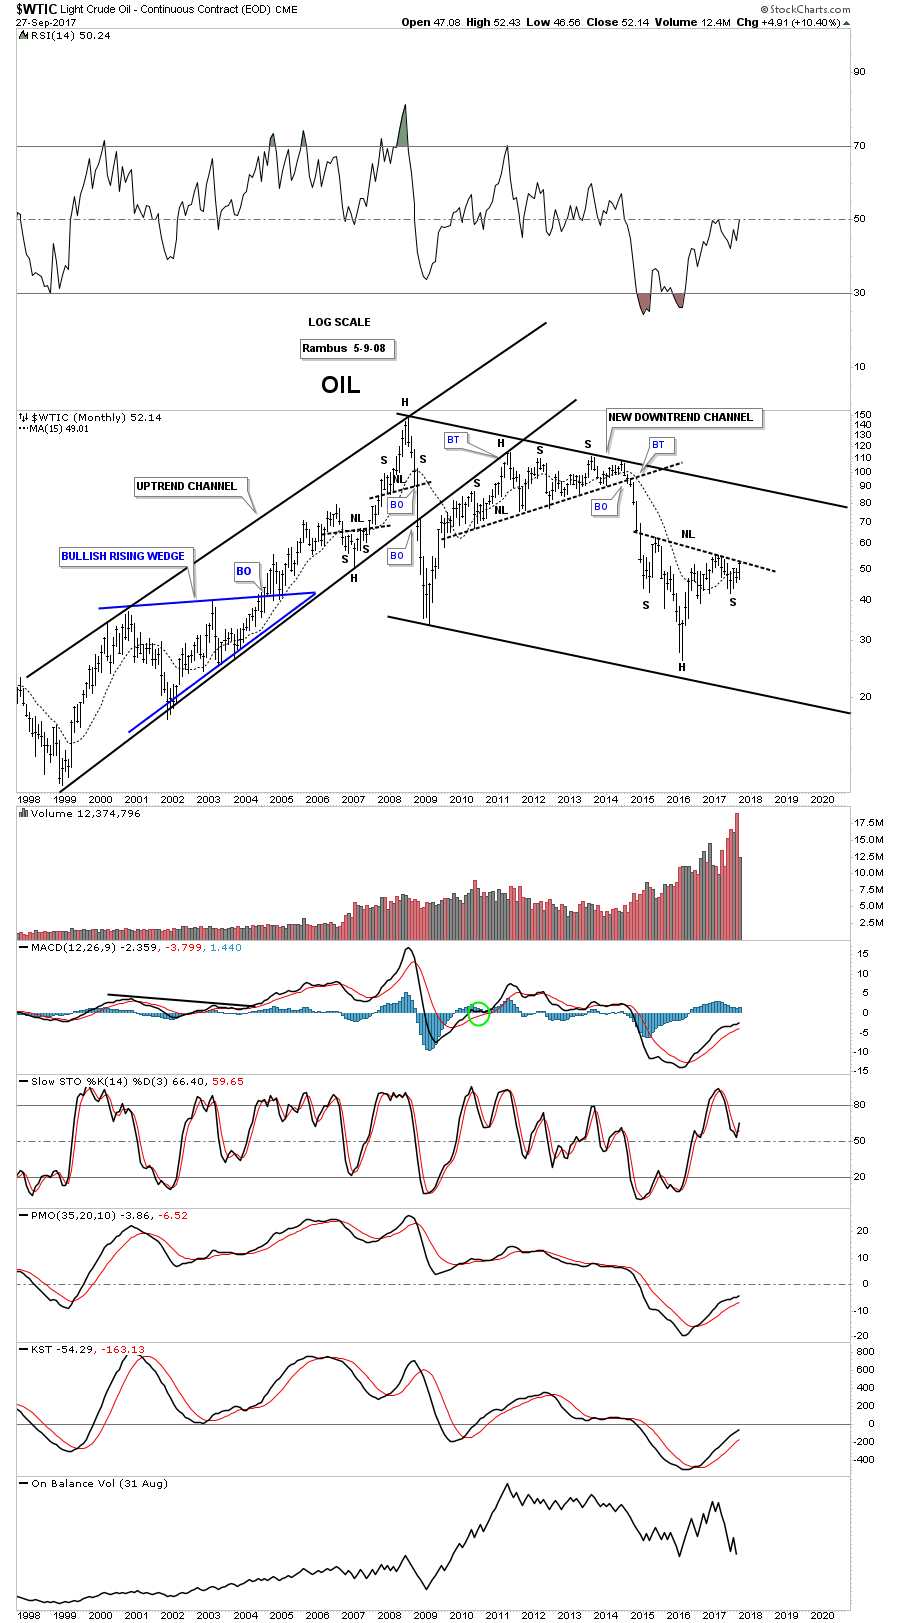
Another very important commodity is Oil, which is building out its own 3 year H&S reversal pattern after an almost 5 year decline. This weekly chart shows the price action is currently testing the neckline. Many times a line chart will give you an early heads up when a breakout is about to take place vs a bar chart.
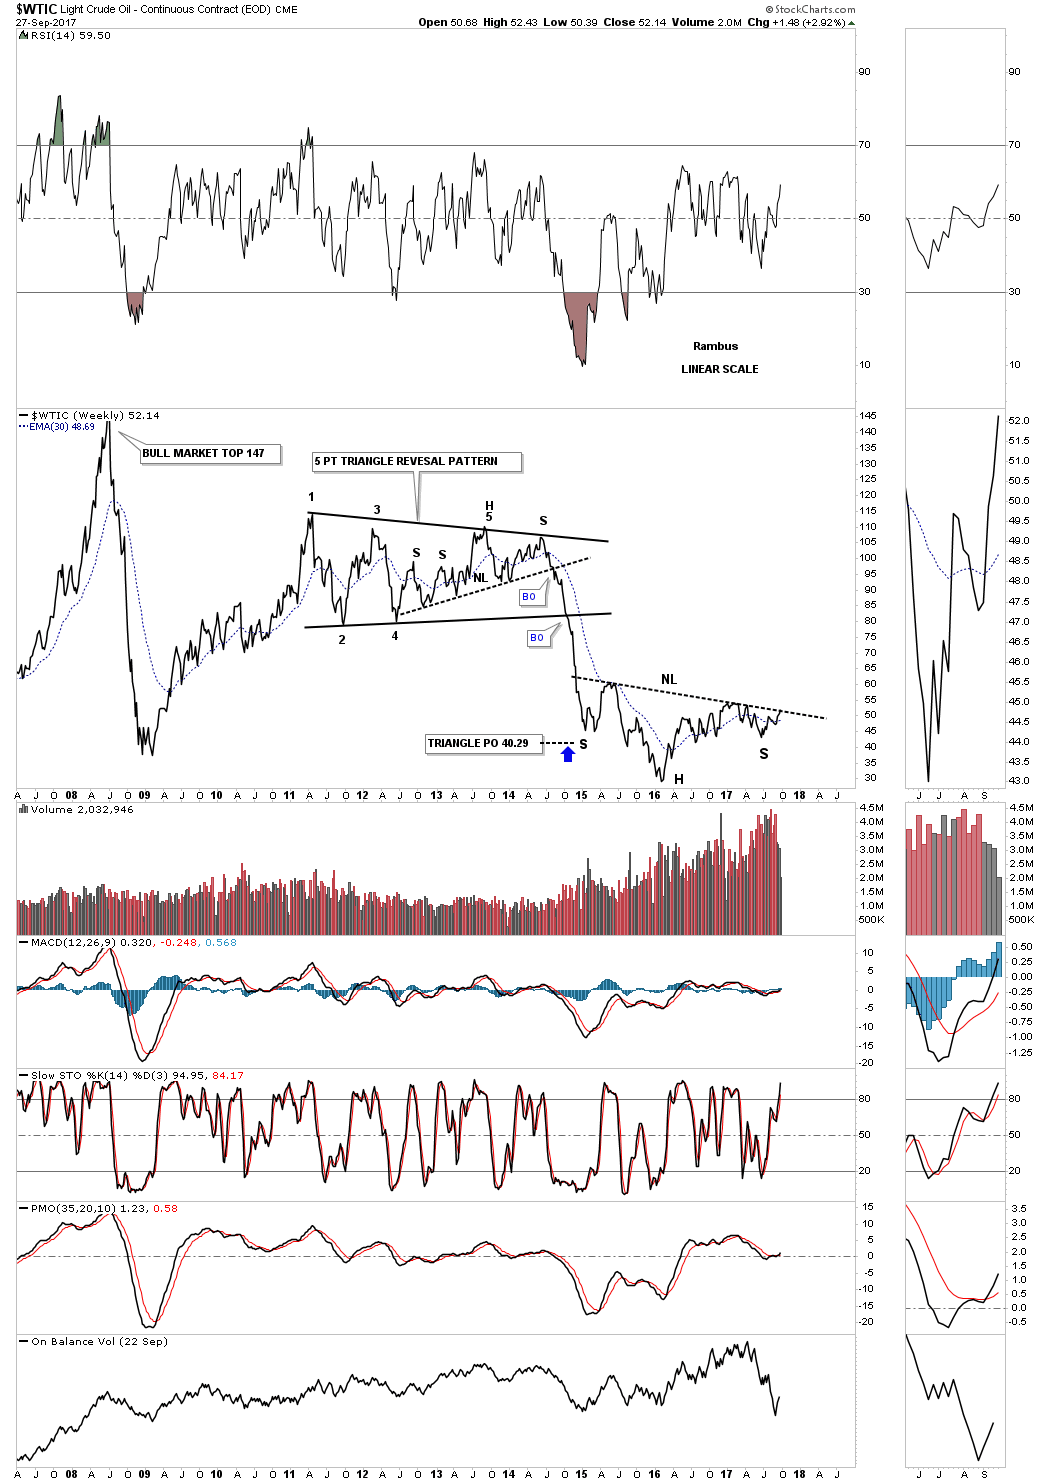
When looking at these H&S bottoms make a mental note of the price objective which is taken from the bottom of the head straight up to the neckline. That distance is then added to the breakout point to get a minimum price objective.
Next lets look at a weekly chart for the XLB, basic materials sector, which is hitting new all time highs.
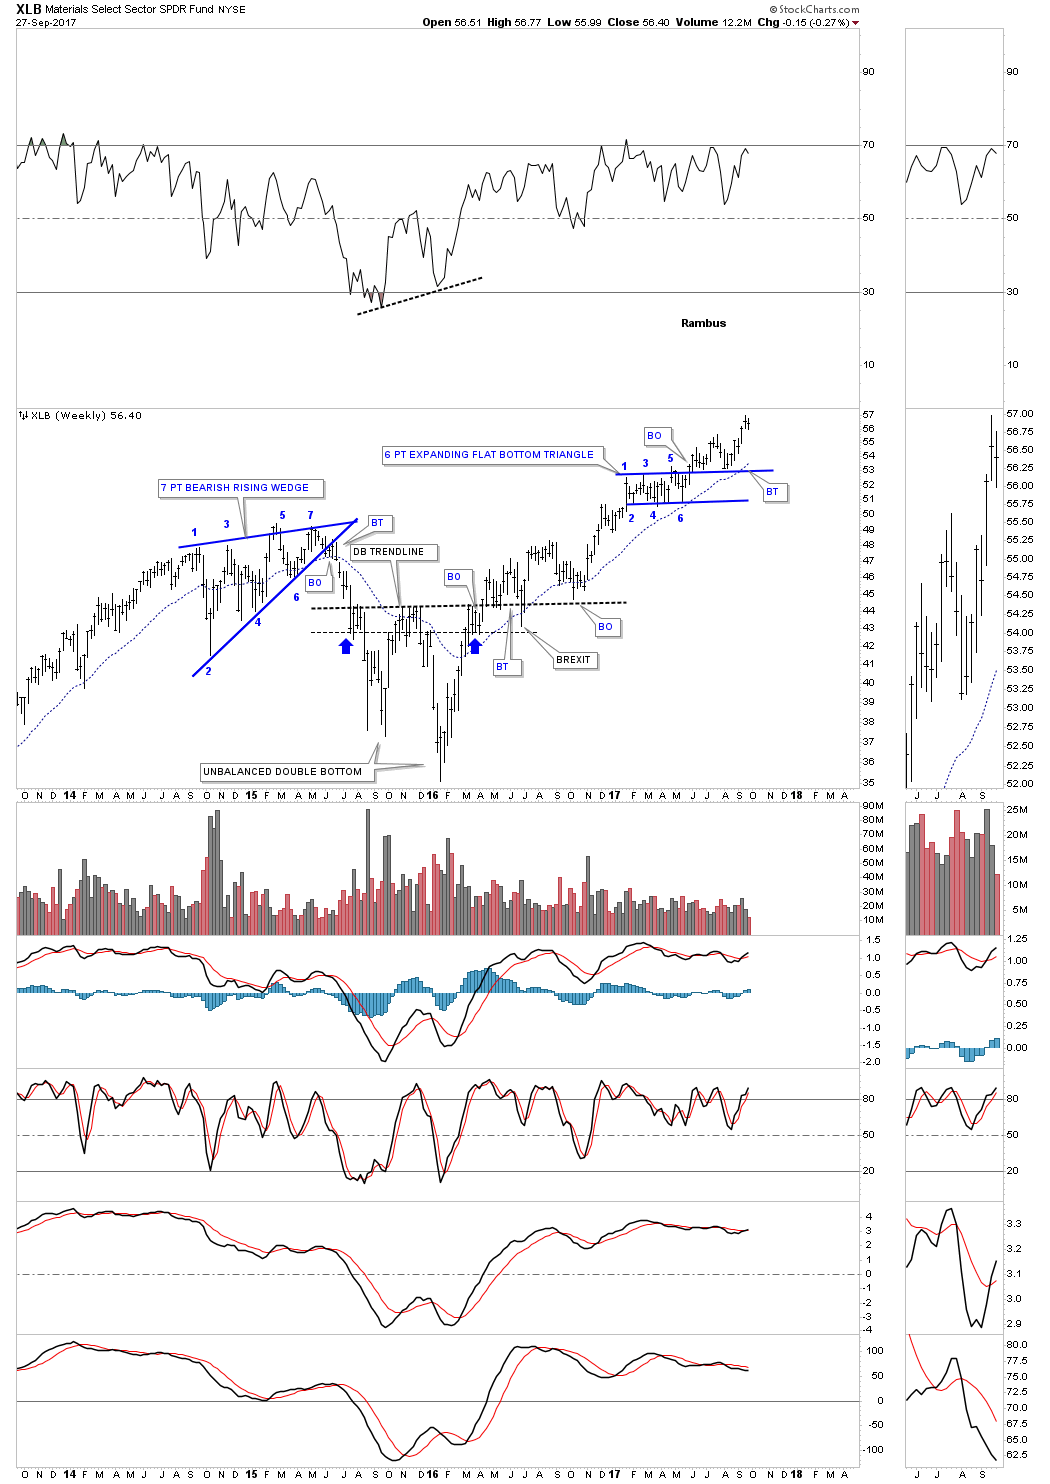
In the past we’ve looked at how the lower channel can morph into a bigger channel that can double in size. In the case for the XLB it looks like a possible 3rd equal channel maybe in the process of building out.
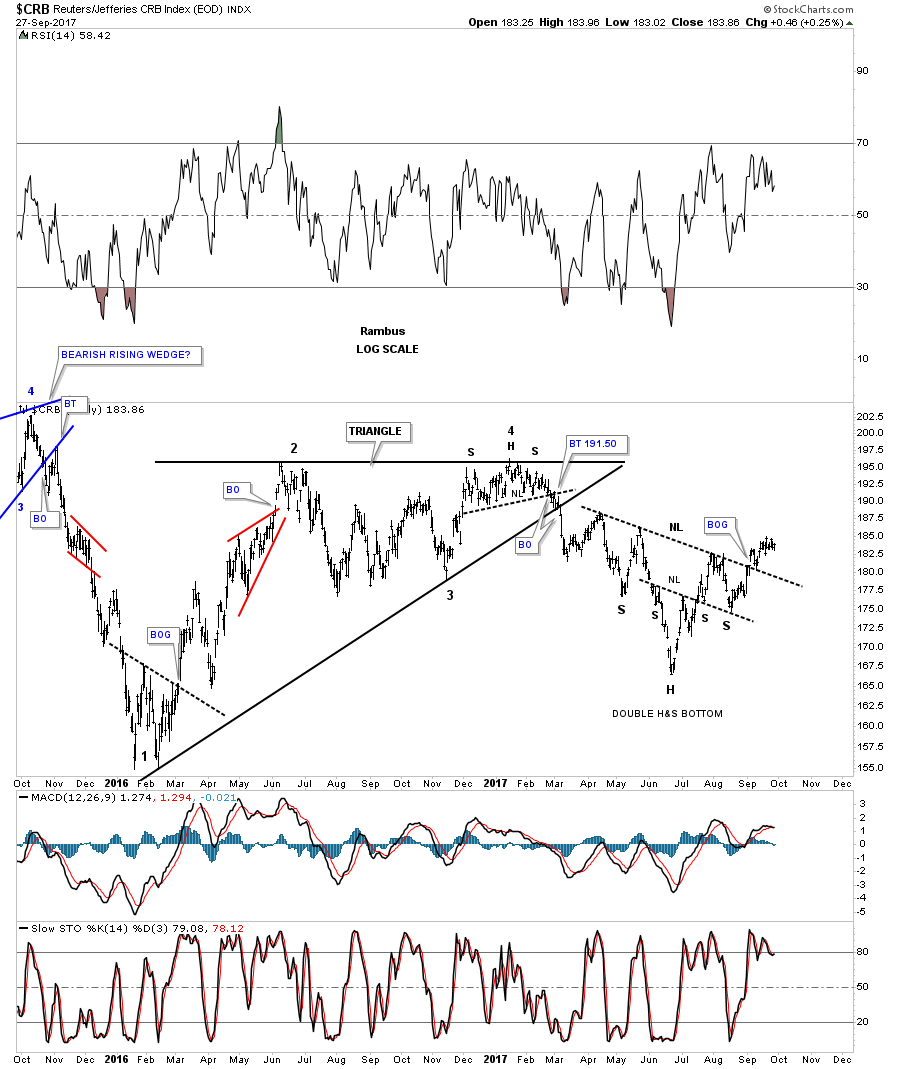
Next lets look at several different commodities indexes to see what they may be telling us. This first commodities index is the old CRB index which has built out a double H&S bottom that experienced a breakout gap above its neckline earlier this month.
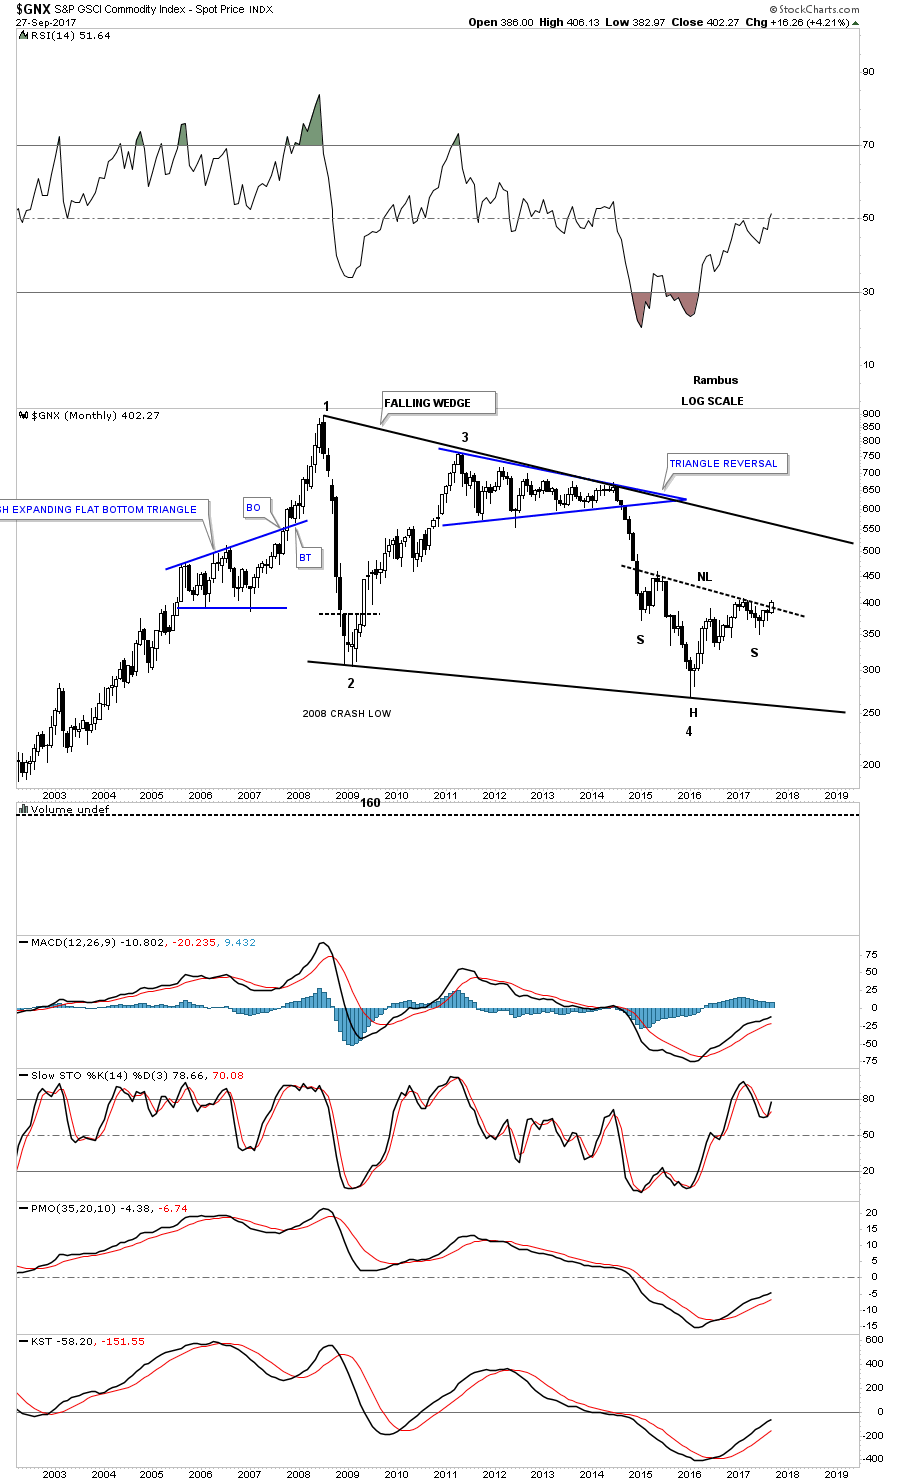
This next commodities index chart is monthly look at the $GNX which is in the process of breaking out above its neckline. Note how this H&S bottom is forming at the 4th reversal point in its 10 year falling wedge.
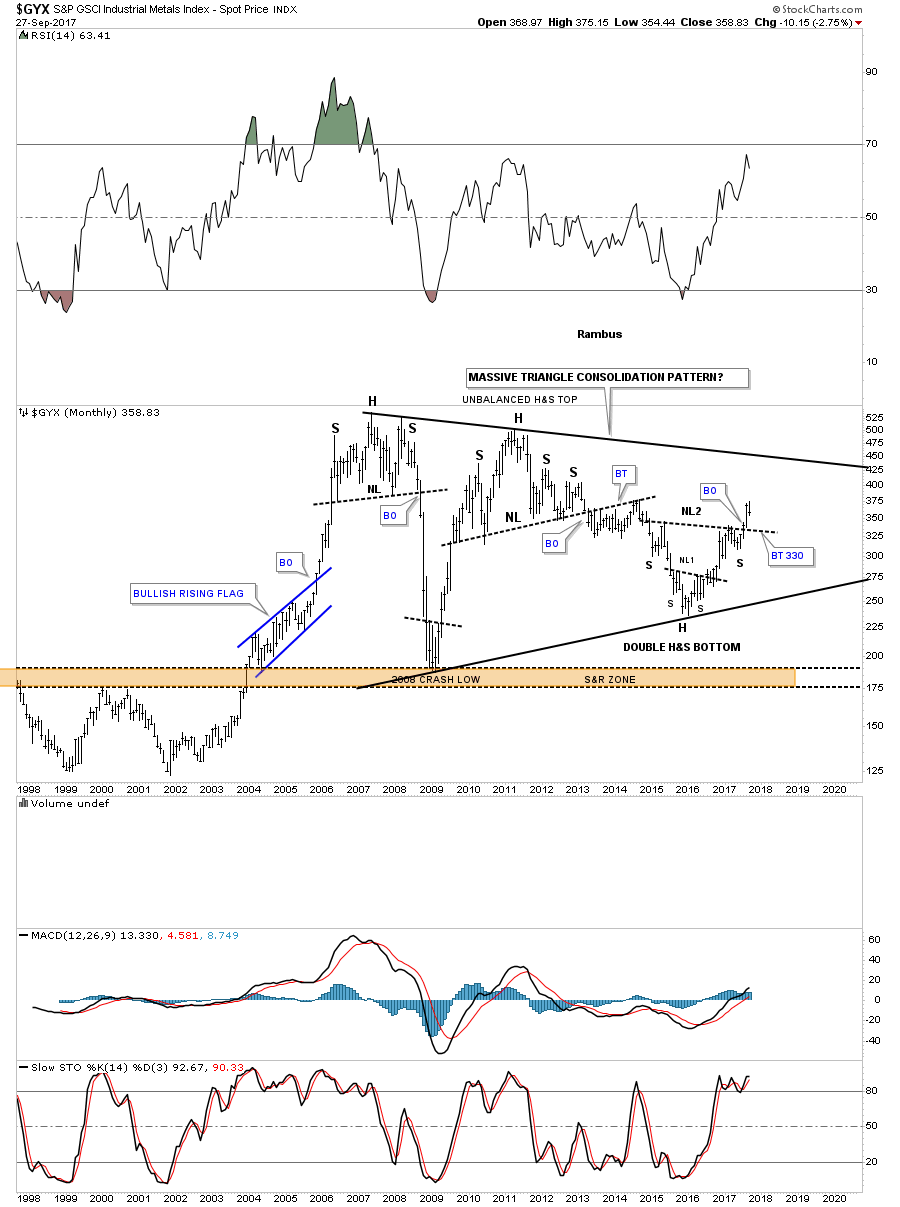
The $GYX, industrial metals index, is building out a double inverse H&S bottom at the 4th reversal point in its 10 year triangle. A backtest to the neckline would come in around the 320 area which should be expected, but not necessary.
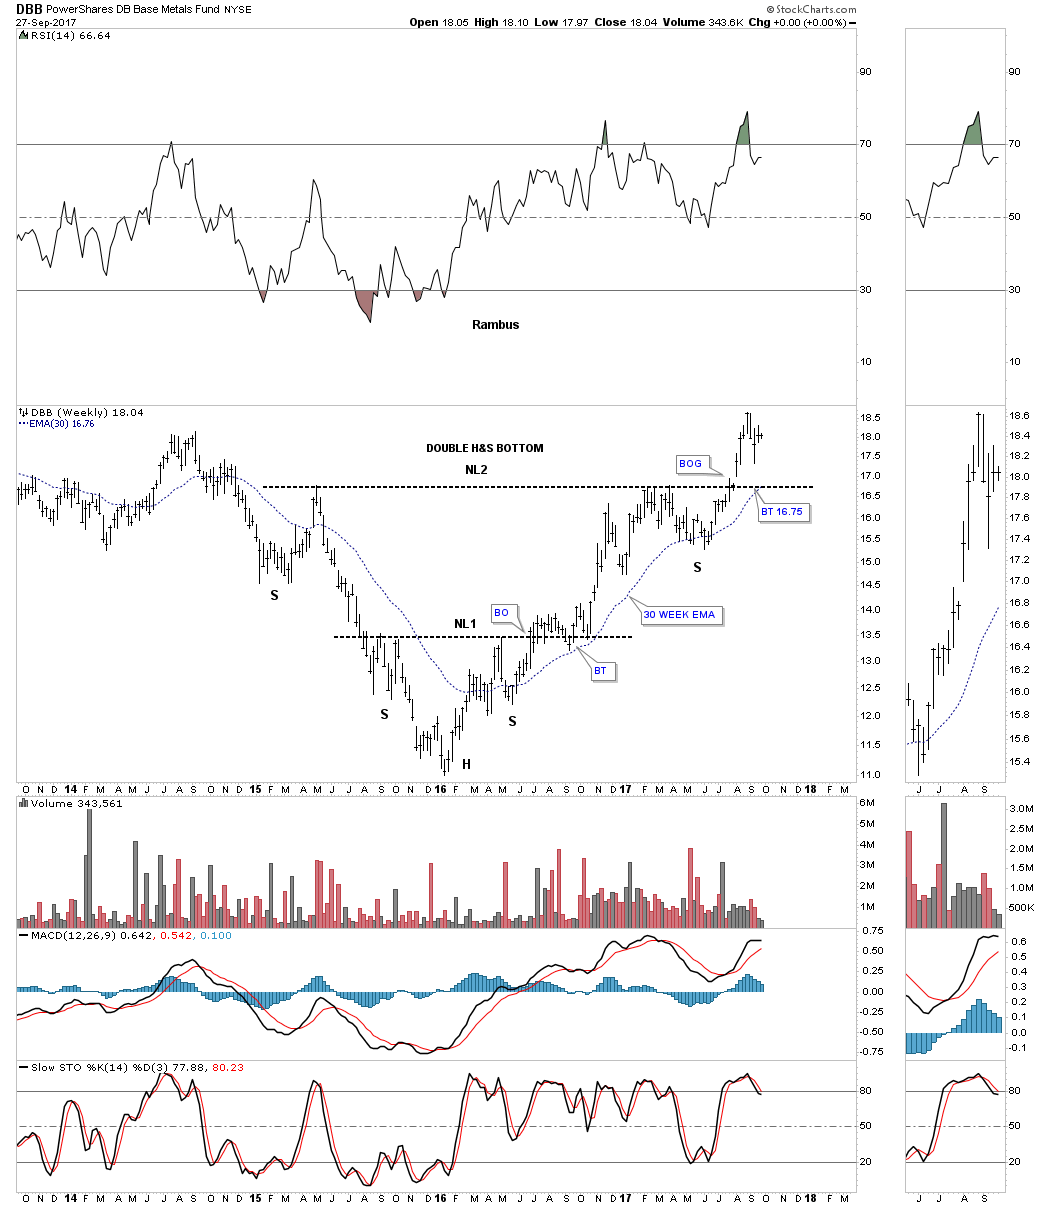
Another base metals index is the DBB which broke out of a double H&S bottom about 8 weeks ago with a breakout gap. A backtest to the neckline would come in around the 16.75 area along with the 30 week ema.
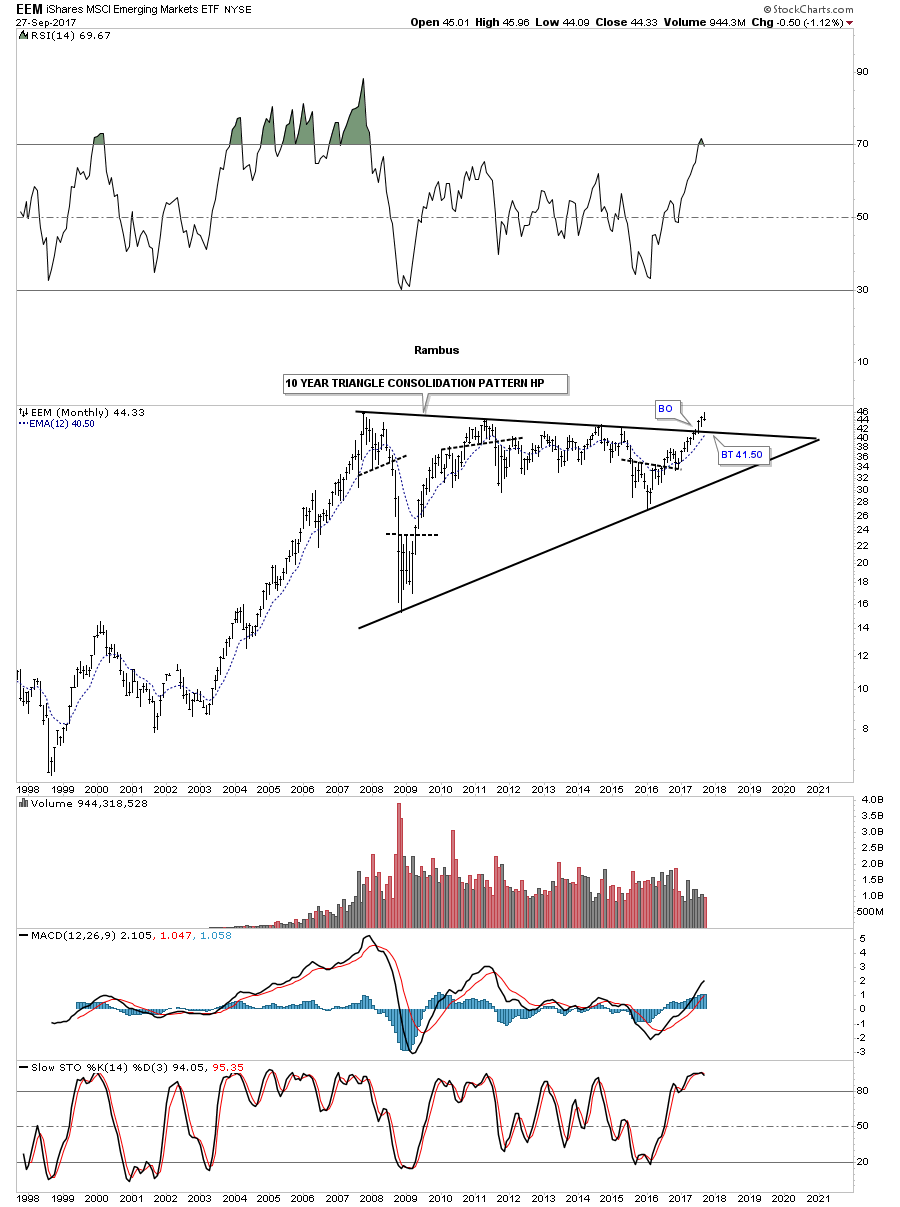
Now lets turn our attention to the emerging markets which is generally affected by the US dollar. The rule of thumb is that when the US dollar is weak it’s good for the emerging markets and vice a versa. Below is a 10 year look at the EEM, emerging market etf, which broke out of a massive 7 year expanding falling wedge. A backtest to the top rail would come in around the 41.85 area along with the 30 week ema.
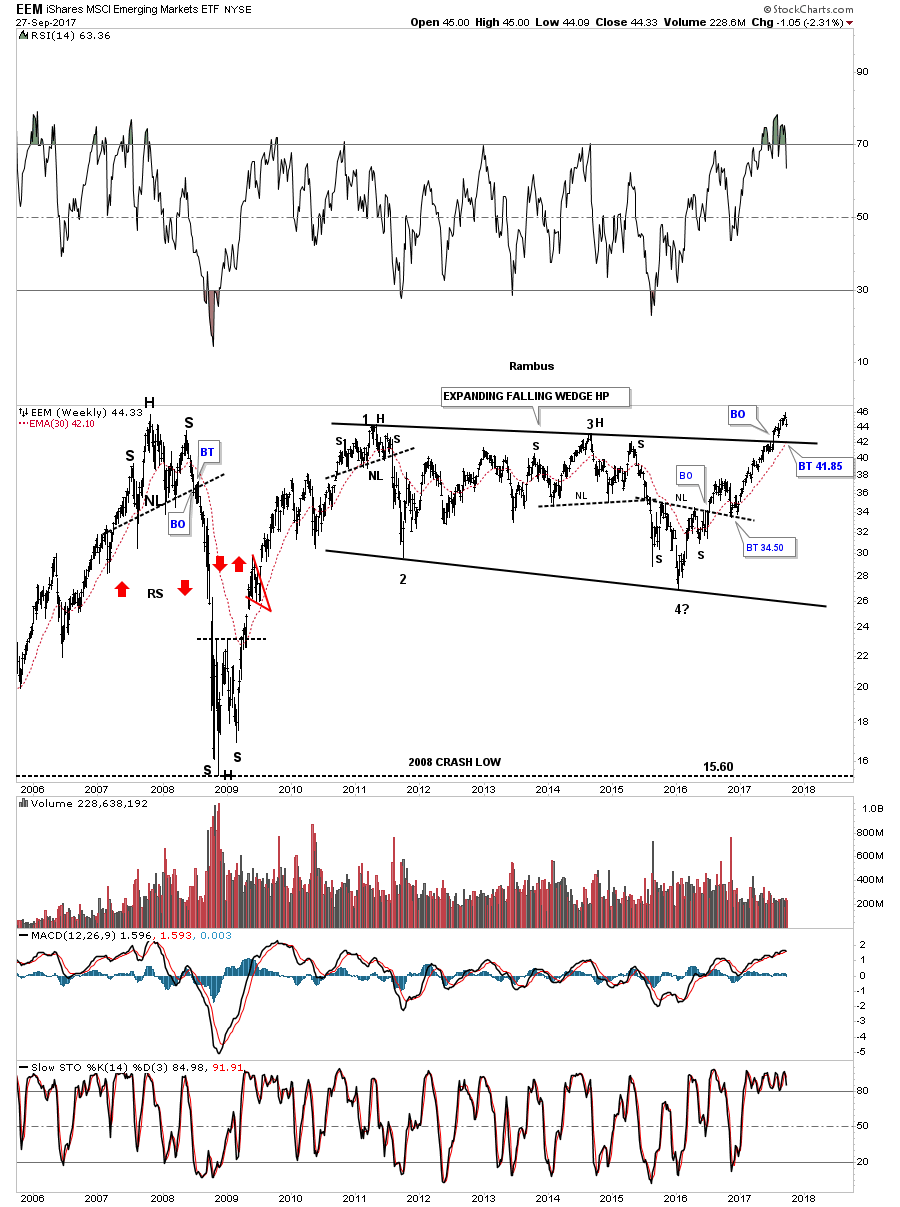
Believe it or not there is an even a bigger chart pattern building out on the EEM which is a 10 year triangle consolidation pattern. As you can see the breakout occurred 3 months ago with the possible backtest to the top rail in progress.
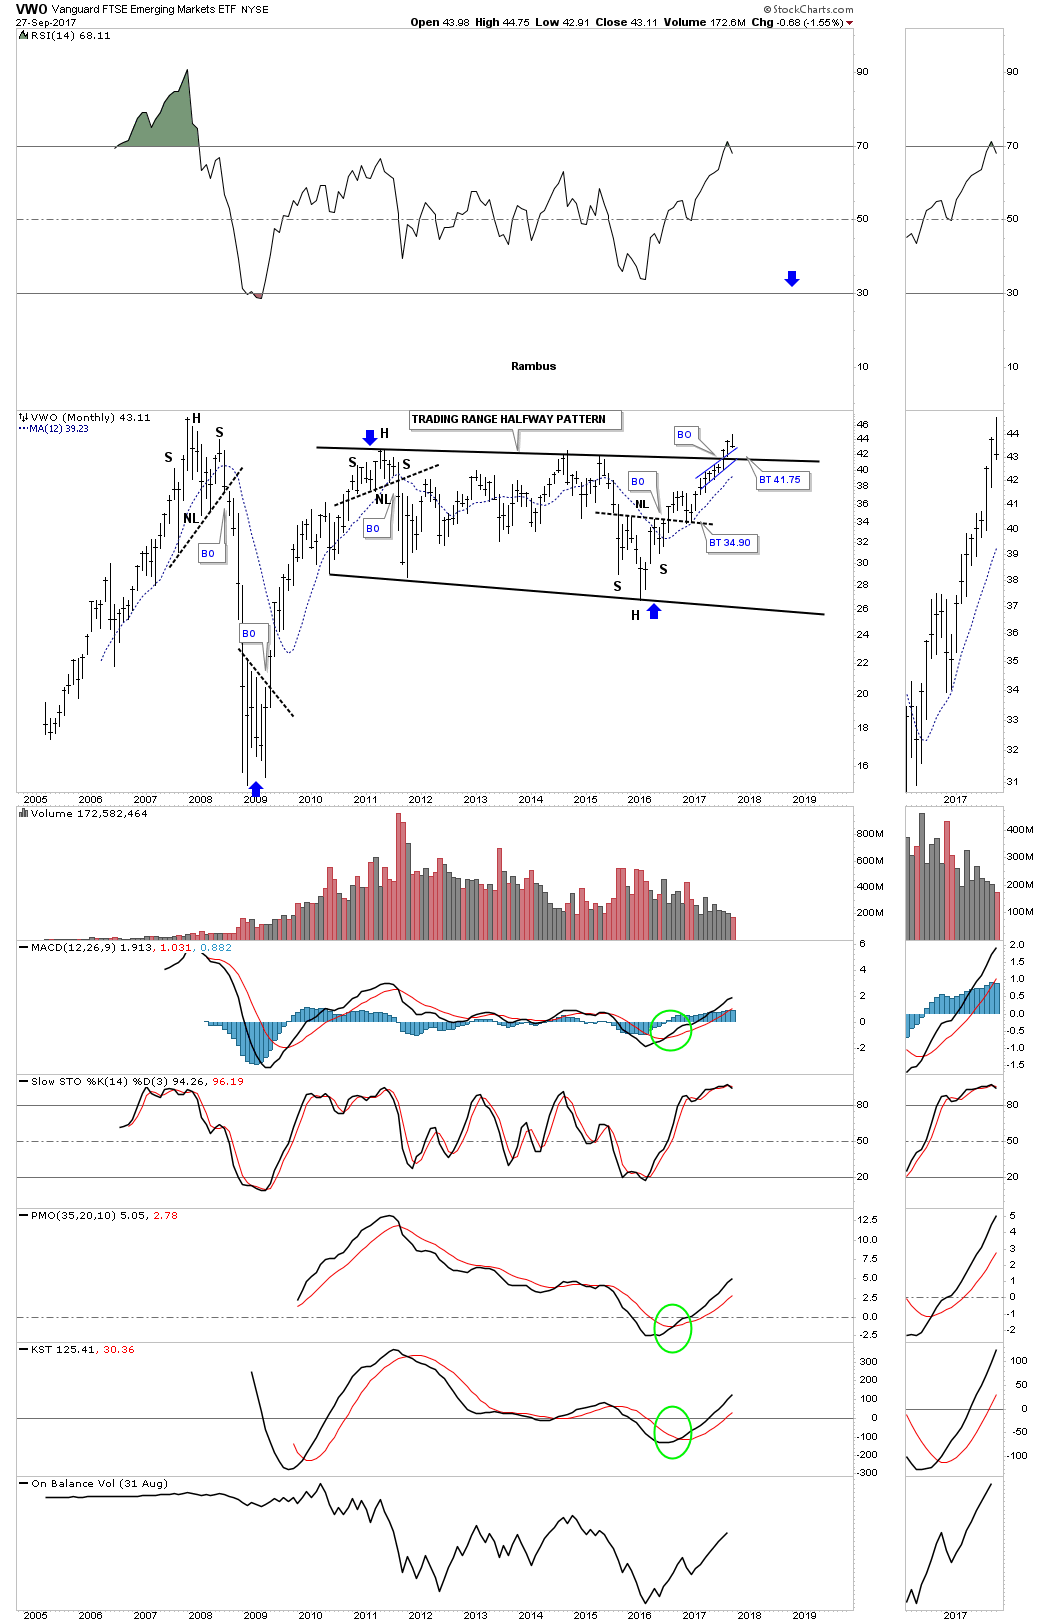
There is another emerging market etf I follow which is the VWO that broke out from its 6 year flat top expanding triangle and is now in the process of backtesting the top rail. Note how the blue bullish rising wedge formed just below the to rail just before the breakout. Classic Chartology.
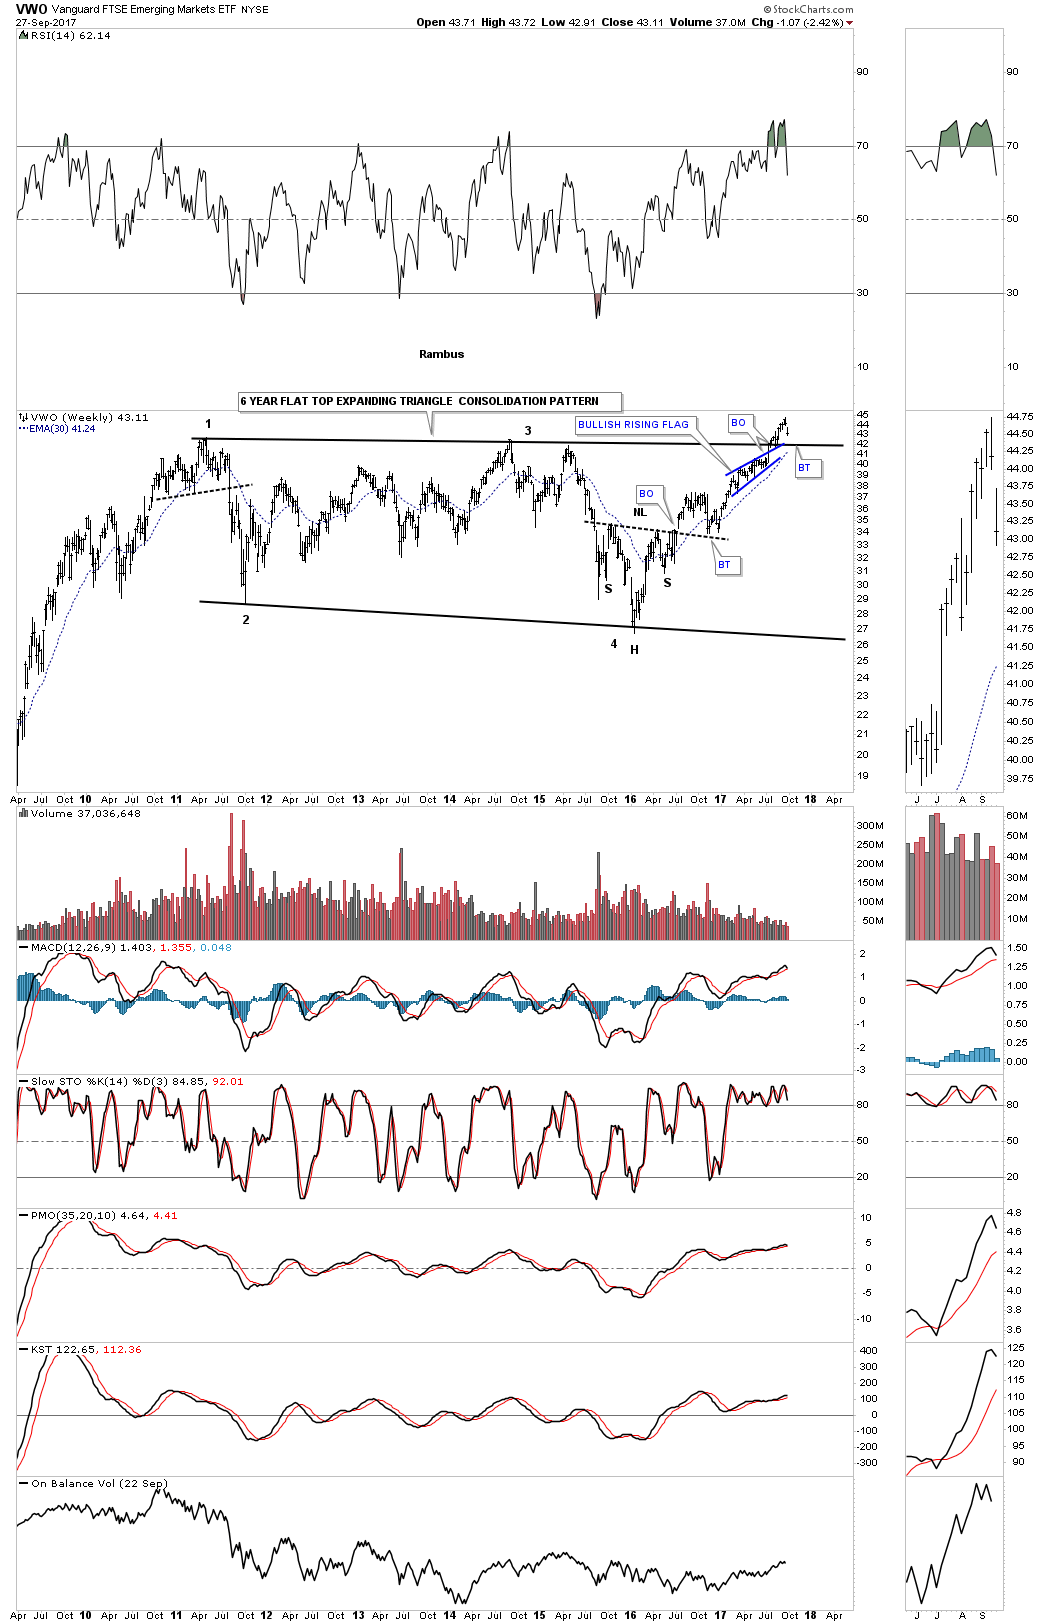
This monthly chart shows a complete backtest would come in around the 41.75 area.
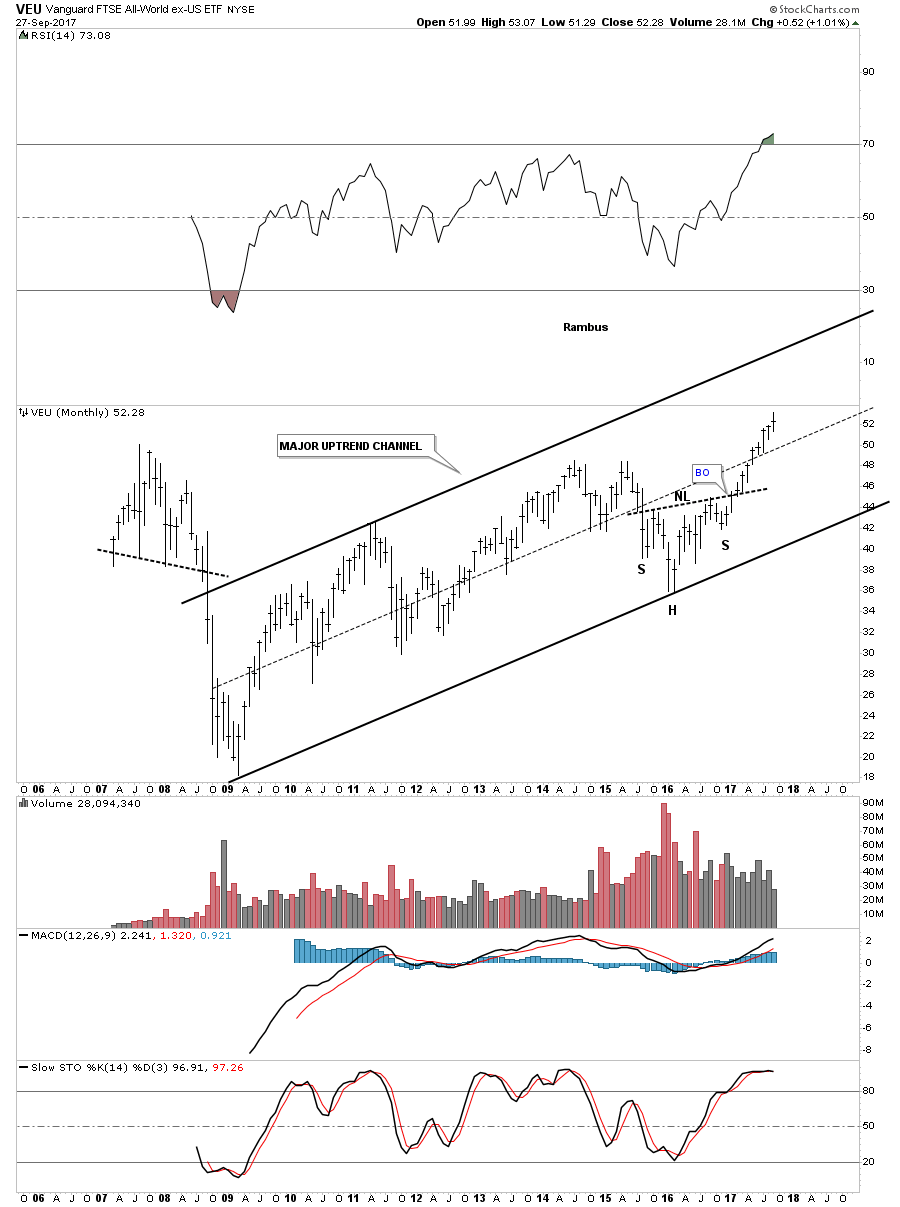
This last chart for tonight is a 10 year monthly look at the VEU which is an all world etf minus the US stock market. This chart gives you a good idea of how the rest of the world is doing, which looks very bullish as this index is making new all time highs within its 2009 bull market uptrend channel.
When looking at many of these commodity charts above you can see many H&S bottoms playing out on a large scale. Think of all the shares that had to trade by millions of investors to build out these reversal patterns. Regardless of what the US dollar is going to do these huge bottoms are going to be very difficult to change into something bearish. Trying to figure it all out from a fundamental point of view will be harder still. The patterns are there and until something changes these pattern, they are what they are. All the best…Rambus
 Like yesterday when the big story was the jump in the USD ahead of Yellen’s (rather hawkish) speech, so today the greenback’s levitation has continued, this time propelled by today’s unveiling of Trump’s tax plan.
On the eve of its unveiling, Trump said lawmakers should expect a “very, very powerful document” that would cut taxes “tremendously” for the middle class. If passed, the plan would be Trump’s first significant legislative win since taking office in January. ”The idea that Trump could be reaching across the aisle, talking about tax cuts to middle and low income households, if it comes to pass, we are talking a pretty material fiscal boost to the U.S. economy. This sort of easy fiscal policy is why the markets are reacting the way they have,” said Mark Dowding, co-head of investment grade at BlueBay Asset Management.
…also:
Premier Warns “Quebec Is Attacked, Quebec Will Resist” As US Slaps Massive Tariff On Bombardier Jets


For new investors, getting into the business of buying, selling, and renting homes may seem pretty ambitious.
But like any other area of personal finance expertise, real estate investing boils down to some simple basics. With the right strategies, patience, and a willingness to learn, it’s a discipline that can help you make strides on the path to financial independence.
STRATEGIES FOR REAL ESTATE INVESTING
Today’s infographic comes to us from Offer Climb and it dives into four timeless real estate investing strategies worth knowing.
Whether you aim to do a quick “lipstick” flip or you’d prefer to generate passive income over time, here are the details and resources needed to execute on each strategy.

Although buying and holding is the most common and traditional strategy used for real estate investing, there is actually a variety of different strategies used. Some of these are simple and can be executed in just days, while others can be used on an ongoing basis to create long-term value.
HOW DOES EACH STRATEGY WORK?
The appropriateness of each strategy below depends on your goals, risk tolerance, and local housing market. For the average investor, it is obvious that some of these strategies would also not likely be suited for booming markets like San Francisco, New York City, Vancouver, or Toronto, where multi-million dollar prices are the norm, and bubble risk is higher.
1. The “Lipstick” Flip
The first impression of a house is incredibly important. The “Lipstick” flip involves buying a house that can be easily improved, and then making minimal cosmetic improvements and repairs to sell for a better price.
For the right property, taking the time to fix small issues with flooring, walls, landscaping, and paint can pay off almost immediately.
2. Buy and Hold
This is one of the oldest strategies in the book, and it’s designed for long-term passive income.
By purchasing a property and leasing it to tenants, it creates a stream of monthly cash flows, and even offers potential tax benefits for the owner.
3. Wholesale
This has similarities to flipping, but involves finding a buyer for a seller and taking a percentage off the sale. If done right, this can be done quickly and with minimal risk.
4. Buy, Renovate, Rent, Refinance, and Repeat
Likely the most complex strategy in real estate investing for beginners to follow, this can ultimately be used to provide benefits in both the short and long term.
It involves four steps: buying a property, renovating it, renting the property out to tenants, and then refinancing the mortgage later on. Then the process repeats itself.
Of course, this strategy works best in places where property values are rising fast.

-
I know Mike is a very solid investor and respect his opinions very much. So if he says pay attention to this or that - I will.
~ Dale G.
-
I've started managing my own investments so view Michael's site as a one-stop shop from which to get information and perspectives.
~ Dave E.
-
Michael offers easy reading, honest, common sense information that anyone can use in a practical manner.
~ der_al.
-
A sane voice in a scrambled investment world.
~ Ed R.
Inside Edge Pro Contributors

Greg Weldon

Josef Schachter

Tyler Bollhorn

Ryan Irvine

Paul Beattie

Martin Straith

Patrick Ceresna

Mark Leibovit

James Thorne

Victor Adair