
Asset protection
The other day, I had an interesting question thrown my way: What’s the single most dangerous investing trend you’re seeing out there right now? What could people be doing that’s a surefire way to just go flat broke?
My answer is probably not what you would expect – after all, today and every day, I’m “Opposite Guy.”
So I’m going to give you the answer you didn’t expect. But it’s the right answer historically.
It’ll help you along your path to becoming a successful, independent, self-directed, and, above all, wealthy investor.
And the best part is, the answer is going to save you a ton of money and heartbreak…
Conventional Wisdom Only Gets You So Far
Here’s something else you probably weren’t expecting from Opposite Guy: You can always follow the conventional wisdom… if you want.
That, however, will only help you in a bull market, when the conventional wisdom is usually right and can stay right for a long time.
Bull markets are when cable talking heads can set themselves up as mystical profit prophets just by hawking the FANG stocks – Facebook Inc. (Nasdaq: FB), Amazon.com Inc. (Nasdaq: AMZN), Netflix Inc. (Nasdaq: NFLX) and Google/Alphabet Inc. (Nasdaq: GOOG) – to the credulous masses.
 See? Bull markets are easy.
But bear markets do come along every so often, and when they do, the conventional wisdom that’s made you bull market gains will lose you a lot of money – fast.
Here’s where I’d bet you were expecting me, Opposite Guy, to say that buying the FANGs is the most dangerous trend.
After all, that’s what all the bears have been saying – and I have a bit of an undeserved reputation as a permabear. I’m supposed to agree that buying the FANGs at these extreme valuations is insane and a surefire way to go broke.
Trouble is, I’m not a permabear. I’m a trend identifier. I use liquidity and technical analysis to signal, identify, and confirm trends, as well as indicate likely turning points. That’s why my analysis has, in fact, been mostly bullish for years. You can follow my liquidity work over at Sure Money and my technical work in the Wall Street Examiner Pro Trader.
Lately, I have been warning that the forces of liquidity that establish market context and drive trends will soon turn bearish, and this week, they started to. My short-term LAMPP indicator, which you can follow at Sure Money, turned red this week.
If you’re not making gains like this… you could be cheating yourself out of tens of thousands of dollars.
That’s a big distinction – and an expensive one if you’ve been following constant doomsayers.
The biggest problem with the permabears is they’ve been saying that the FANGs are about to crash for years. They’ve been very wrong for a very long time.
What’s worse, some of them have been recommending the purchase of puts or outright short sales of these stocks. Those recommendations have been disastrous. If you followed them, you would have been wiped out over and over.
But, like the proverbial busted clock that’s right twice in 24 hours, the permabears will be right one day, and my liquidity analysis suggests that day is probably not far off.
So, for regular investors, the question becomes: Will these stocks crash, or should they be held through thick and thin?
Let’s take a look at one stock in particular – a company chronically hated on (and often disastrously shorted) by permabears – one of the FANGs.
I mean Amazon.com, of course…
Forget the Permabears – Look at the Data
Amazon was one of the high flyers of the dot-com era (turned dot-com bubble).
It started life in 1998 at a split adjusted price of around $1.50/share. It peaked in December 1999 at $113…
BUBBLE!
In 2001, it fell to $5.51 per share…
CRASH!
![]() True, you would not want to have bought it at $113 and ridden it to $6. But let’s be real: A simple trend-following system like the one I’ve developed for Lee Adler’s Sure Money readers would have triggered a sell signal around $68.
True, you would not want to have bought it at $113 and ridden it to $6. But let’s be real: A simple trend-following system like the one I’ve developed for Lee Adler’s Sure Money readers would have triggered a sell signal around $68.
You’d be wounded, but not dead.
Where is AMZN today? $942.
There are those who argue today that Amazon is another crash in the making. The problem is the boy-who-cried-wolf syndrome. Permabears in general, and Amazon bears in particular, have been complaining about the price of the stock ever since it began to recover in late 2001. The company has never earned a profit, they said, for years.
Now they just say that its valuation is insane.
It’s all fact.
But here’s another fact: AMZN is still in an uptrend.
Would I buy the stock up here? No. Hell no – we’re getting very close to the end of this bull market.
But would I sell it? The simplest tools of technical analysis – trend lines, support, and resistance say “not yet.”
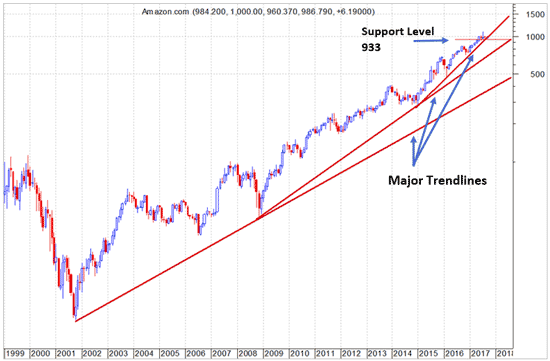
There’s an obvious level on this chart that would make me want to at least start taking some of my money off the table if I owned the stock. That’s $933, the monthly lows of the range of the past three months. In fact, since I drew this chart, AMZN shares have dropped to that level over the past few days. Closing September below that would trigger my first sell signal.
That level also coincides with a two-year trend line. If that breaks, there could be a lot of selling to follow. The next trend line below that projects to around $800 at the end of this year.
So here’s what you should do – and not do…
Don’t Try to Fight the Trend
Is there profit potential on the short side there with Amazon? Not much. There’s perhaps enough for scalpers who are trading the market full time, but not enough for most people. The potential reward over the short run just isn’t worth the risk that the uptrend will resume from here.
I would not even think of shorting AMZN (or any of the other FANGs) on a longer-term basis until the stock has fallen to the second trend line around $800 and then rallied from there.
If the rally failed to exceed the current high around $1080, then I might think about shorting.
But if Amazon shares are doing that poorly, you can be sure that there will be much more interesting opportunities in other stocks.
I would look for stocks that don’t have that cult following to drive constant short-killer rallies, a.k.a. “short squeezes.” Every time a stock like Amazon drops to a major support, professional short sellers will start to cover, and dip buyers will rush in. Violent, short-term spike rallies are usually the result.
The best advice I can give bears who are tempted to short Amazon, or any of the FANGs, is to go take a nap.
It’s a lot easier to nail a 20% decline in a stock that’s in a downtrend and isn’t a cult stock than it would be to nail one in AMZN.
In general, I never short cult stocks. It’s not worth the risk. There are better choices.
Here’s why I just don’t understand serial crash-callers. First, I’ve had a long-time rule that seems obvious to me: Never sell short fad or cult stocks.
Secondly, some “fads” turn into real companies. Amazon is the poster boy for that.
Just because Amazon CEO Jeff Bezos has decided on a predatory model where he eliminates profit, or at least minimizes it, to crush all competition, does not mean that the stock is overvalued. Never short a stock just because you hate its “overvaluation.”
In the same vein, please don’t get me started on the whole concept of “valuation.” It’s a sham. One man’s trash is another man’s treasure. That’s not just true of old furniture. It applies especially to stocks. Valuation is a useless concept in my view. “Cheap” stocks can stay cheap or get cheaper, and “overvalued” stocks can stay “overvalued,” seemingly forever in some cases.
At the very least, don’t short fad stocks or “overvalued” stocks when they’re above support levels or major trend lines. It’s a sure way to lose all your money fast.
Selling short only requires that you put up 50% of the sale price as cash equity. That means that a 25% increase in the price of the stock will wipe you out. You’ll get a margin call well before that, of course. So what! You’ll be forced out with a 50% loss. Someone else will make the decision for you.
Moreover, if you put up the additional required margin, you’re just as likely to lose that. The object of short selling is to make money, not to prove that you’re right. Ultimately, you may well be, but you’ll probably lose all of your money first if you try to short the FANGs.
Always remember: The trend is your friend and don’t fight the Fed! Even with real Fed tightening, now beginning (with the euphemistically named program of balance sheet “normalization”), the market trend hasn’t turned down yet. Respect that. Be patient. Don’t short fad or cult stocks. Don’t buy puts on them. You could still lose it all, regardless of the fact that they are overvalued- or not.
Besides, the time is coming when there will be lower risk opportunities to make money on the short side. Meantime, the safest play is to honor the trend until it’s no longer the trend.

- Dead malls spring back to life
- The start of a huge rally?
- Plus: The best names in cheap retail
The retail apocalypse is a lie.
Don’t get me wrong — the stock losses racked up by the big mall anchors are very real. We’ve spent most of 2017 digging into troubling numbers posted by the prominent brick and mortar retailers. They aren’t pretty. Everyone knows that the first half of the year was a disaster for the mall anchors, with no relief is in sight for some of these troubled companies.
But there’s more to the “death of retail” story than these struggling stores. Watching iconic brands close locations across the country has warped our brains. We see pictures of vacant malls on the news and assume the American shopper has taken his business online for everything from big screen TVs to socks and underwear.
Will we ever leave our homes for the local shopping center again?
Absolutely.
If you dig into the numbers, you’ll find that aside from the high-profile closings, brick and mortar retail is expanding this year. According to IHL Group, U.S. retailers will open 1,326 more locations than they will close in 2017.
Despite popular belief, every single retailer in the country isn’t about to declare bankruptcy. As we’ve said from the start, the best businesses will adapt and survive, whether we’re talking online start-ups or brick and mortar retailers.
The market’s finally starting to catch onto this idea…
For starters, the retail sector halted its nasty year-to-date plunge last month. It’s now quietly on the cusp of breaking out of the downtrend that has held the sector hostage all year.
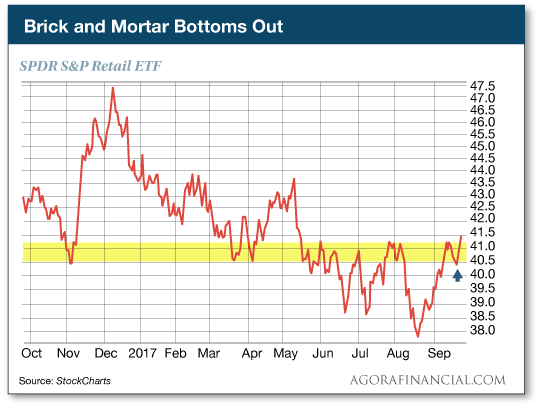
The failed breakdown in late August appears to have sealed the downtrend’s fate. The bears have overplayed their hand and are now susceptible to a face-ripping rally if these poor little retail names can catch a little momentum…
In fact, we’ve already seen select retail stocks rise from the rubble.
Just check out the extreme discounters and dollar stores. We’ve been bulled up on the “cheap junk” sector for a while now. Our theory is that these lean dollar store operations have what it takes to survive alongside Amazon. They fill an important retail niche and don’t have to worry about price-matching gimmicks the big box retailers use to compete.
As you can probably guess, extreme discounters and dollar stores are anything but fancy. But they’re growing. That’s a big deal in the Age of Amazon.
Take Dollar General Corp. (NYSE:DG) New locations are popping up all over rural America. The company is planning to open 1,000 stores before the year is finished. That’s an aggressive expansion plan—especially when you have Amazon breathing down your neck.
Investors are rewarding the effort. DG stock is posting new 2017 highs this week. The same goes for one of its main competitors: Dollar Tree Inc. (NASDAQ:DLTR). Shares are up more than 25% off its summer lows as they push to new year-to-date highs.
The formula is simple. Good deals in small stores make it easy for shoppers to get in and out. That’s why dollar stores are bucking the trend and expanding in this dismal retail environment.
Sincerely,
Greg Guenthner

A quick look at any of the US majors will show most investors that the markets have recently been pushing upward towards new all-time highs. These traditional market instruments can be misleading at times when relating the actual underlying technical and fundamental price activities. Today, we are going to explore some research using our custom index instruments that we use to gauge and relate more of the underlying market price action.
What if we told you to prepare for a potentially massive price swing over the next few months? What if we told you that the US and Global markets are setting up for what could be the “October Surprise of 2017” and very few analysts have identified this trigger yet? Michael Bloomberg recently stated “I cannot for the life of me understand why the market keeps going up”. Want to know why this perception continues and what the underlying factors of market price activity are really telling technicians?
At ATP provide full-time dedicated research and trading signal solution for professional and active traders. Our research team has dedicated thousands or hours into developing a series of specialized modeling systems and analysis tools to assist us in finding successful trading opportunities as well as key market fundamentals. In the recent past, we have accurately predicted multiple VIX Spikes, in some cases to the exact day, and market signals that have proven to be great successes for our clients. Today, we’re going to share with you something that you may choose to believe or not – but within 60 days, we believe you’ll be searching the internet to find this article again knowing ATP (ActiveTradingPartners.com) accurately predicted one of the biggest moves of the 21st century. Are you ready?
Let’s start with the SPY. From the visual analysis of the chart, below, it would be difficult for anyone to clearly see the fragility of the US or Global markets. This chart is showing a clearly bullish trend with the perception that continued higher highs should prevail.

Additionally, when we review the QQQ we see a similar picture. Although the volatility is typically greater in the NASDAQ vs. the S&P, the QQQ chart presents a similar picture. Strong upward price activity in addition to historically consistent price advances. What could go wrong with these pictures – right? The markets are stronger than ever and as we’ve all heard “it’s different this time”.

Most readers are probably saying “yea, we’ve heard it before and we know – buy the dips”.
Recently, we shared some research with you regarding longer term time/price cycles (3/7/10 year cycles) and prior to that, we’ve been warning of a Sept 28~29, 2017 VIX Spike that could be massive and a “game changer” in terms of trend. We’ve been warning our members that this setup in price is leading us to be very cautious regarding new trading signals as volatility should continue to wane prior to this VIX Spike and market trends may be muted and short lived. We’ve still made a few calls for our clients, but we’ve tried to be very cautious in terms of timing and objectives.
Right now, the timing could not be any better to share this message with you and to “make it public” that we are making this prediction. A number of factors are lining up that may create a massive price correction in the near future and we want to help you protect your investments and learn to profit from this move and other future moves. So, as you read this article, it really does not matter if you believe our analysis or not – the proof will become evident (or not) within less than 60 days based on our research. One way or another, we will be proven correct or incorrect by the markets.
Over the past 6+ years, capital has circled the globe over and over attempting to find suitable ROI. It is our belief that this capital has rooted into investment vehicles that are capable of producing relatively secure and consistent returns based on the global economy continuing without any type of adverse event. In other words, global capital is rather stable right now in terms of sourcing ROI and capital deployment throughout the globe. It would take a relatively massive event to disrupt this capital process at the moment.
Asia/China are pushing the upper bounds of a rather wide trading channel and price action is setting up like the SPY and QQQ charts, above. A clear upper boundary is evident as well as our custom vibrational/frequency analysis arcs that are warning us of a potential change in price trend. You can see from the Red Arrow we’ve drawn, any attempt to retest the channel lows would equate to an 8% decrease in current prices.

Still, there is more evidence that we are setting up for a potentially massive global price move. The metals markets are the “fear/greed” gauge of the planet (or at least they have been for hundreds of years). When the metals spike higher, fear is entering the markets and investors avoid share price risks. When the metals trail lower, greed is entering the markets and investors chase share price value.
Without going into too much detail, this custom metals chart should tell you all you need to know. Our analysis is that we are nearing the completion of Wave C within an initial Wave 1 (bottom formation) from the lows in Dec 2016. Our prediction is that the completion of Wave #5 will end somewhere above the $56 level on this chart (> 20%+ from current levels). The completion of this Wave #5 will lead to the creation of a quick corrective wave, followed by a larger and more aggressive upward expansion wave that could quickly take out the $75~95 levels. Quite possibly before the end of Q1 2018.

We’ve termed this move the “Rip your face off Metals Rally”. You can see from this metals chart that we have identified multiple cycle and vibrational/frequency cycles that are lining up between now and the end of 2017. It is critical to understand the in order for this move to happen, a great deal of fear needs to reenter the global markets. What would cause that to happen??
Now for the “Hidden Gem”…
We’ve presented some interesting and, we believe, accurate market technical analysis. We’ve also been presenting previous research regarding our VIX Spikes and other analysis that has been accurate and timely. Currently, our next VIX Spike projection is Sept 28~29, 2017. We believe this VIX Spike could be much larger than the last spike highs and could lead to, or correlate with, a disruptive market event. We have ideas of what that event might be like, but we don’t know exactly what will happen at this time or if the event will even become evident in early October 2017. All we do know is the following…
The Head-n-Shoulders pattern we first predicted back in June/July of this year has nearly completed and we have only about 10~14 trading days before the Neck Line will be retested. This is the Hidden Gem. This is our custom US Index that we use to filter out the noise of price activity and to more clearly identify underlying technical and price pattern formations. You saw from the earlier charts that the Head-n-Shoulders pattern was not clearly visible on the SPY or QQQ charts – but on THIS chart, you can’t miss it.
It is a little tough to see on this small chart but, one can see the correlation of our cycle analysis, the key dates of September 28~29 aligning perfectly with vibration/frequency cycles originating from the start of the “head” formation. We have only about 10~14 trading days before the Neck Line will likely be retested and, should it fail, we could see a massive price move to the downside.

What you should expect over the next 10~14 trading days is simple to understand.
_ Expect continued price volatility and expanded rotation in the US majors.
_ Expect the VIX to stay below 10.00 for only a day or two longer before hinting at a bigger spike move (meaning moving above 10 or 11 as a primer)
_ Expect the metals markets to form a potential bottom pattern and begin to inch higher as fear reenters the markets
_ Expect certain sectors to show signs of weakness prior to this move (possibly technology, healthcare, bio-tech, financials, lending)
_ Expect the US majors to appear to “dip” within a 2~4% range and expect the news cycles to continue the “buy the dip” mantra.
The real key to all of this is what happens AFTER October 1st and for the next 30~60 days after. This event will play out as a massive event or a non-event. What we do know is that this event has been setting up for over 5 months and has played out almost exactly as we have predicted. Now, we are 10+ days away from a critical event horizon and we are alerting you well in advance that it is, possibly, going to be a bigger event.
Now, I urge all of you to visit our website to learn more about what we do and how we provide this type of advanced analysis and research for our clients. We also provide clear and timely trading signals to our clients to assist them in finding profitable trading opportunities based on our research. Our team of dedicated analysts and researchers do our best to bring you the best, most accurate and advanced research we can deliver. The fact that we called this Head-n-Shoulders formation back in June/July and called multiple VIX Spike events should be enough evidence to consider this call at least a strong possibility.
If you want to take full advantage of the markets to profit from these moves, then join today at www.ActiveTradingPartners.com and become a member.

 The Canadian government isn’t quite done meddling with the housing market. Instead of focusing on those putting less than 20% down like most of the changes over the past decade, this will be hitting borrowers who have more than 20% equity. Although there is not 100% certainty on what guidelines will change, the most commonly discussed option is for the government to apply the “stress test” to all mortgages funded by federally regulated lenders.
Last October the stress test was announced which requires all borrowers putting less than 20% down to qualify at the benchmark rate which is currently 4.84%. Previously only variable rate mortgages or mortgages with terms of less than 5 years had to qualify at the benchmark rate, so taking a 5yr fixed was a commonly chosen option to qualify. The change reduced borrower eligibility for those who would be taking a 5yr fixed by 20%. Currently with 20% taking a 5yr fixed rate is still a way to qualify at the actual rate, not the benchmark. The government is looking to likely close this option which will reduce borrowing power by 20%. This will reduce incentive for borrowers to take 5yr fixed rate mortgages and enter more variable rate contracts as there is no qualification incentive to take the perceived “safer” option of the longer term rate.
We have heard from a few lenders that they worry the next round of changes will impact some of their lending products. One lender in particular has a “net worth” program which allows borrowers to not need an income to qualify for a mortgage, which has been a dying breed in today’s lending climate as lenders fear government auditing and wrist slapping for non-income qualifying loans. It is possible that this next wave of changes brings about further restricting lenders to lend based on their comfort level and pushes more borrowers to seek more expensive alternative lenders.
There is a possible reconsideration of launching these guidelines however. Toronto’s market has dropped considerably over the summer and most other markets in Canada has been fairly flat over the past few months. It is possible that they tap the brakes on launching new guidelines for fear of sending some markets like Toronto is a more aggressive tailspin.
What should you do?
If you are looking to buy with 20% down or want to refinance to unlock equity to invest, you may want to look at doing this sooner rather than later. The government has been more apt to moving swiftly once changes are made so policies may come into effect quickly.
Also, consider that Credit Unions are provincially regulated, not federally regulated. Over the past few years this has given them a few competitive advantages when it comes to qualification guidelines. Further government changes may widen this gap and give Credit Unions a larger piece of the mortgage pie, if they want it.
 Michael Campbell interviews Martin on this Saturday’s Money Talks.
Martin Armstrong is a controversial market analyst who correctly predicted the 1987 crash, the top of the Japanese market, and many other market events … more or less to the day.
Three years ago, Armstrong was laughed at when he predicted the Dow would exceed 25,000. Since that prediction the Dow has gone steadily up closing at 22340 Wed Sept. 27th. The push behind US stocks is the steady decline of Europe, which is driving huge amounts of capital flooding into the U.S, creating a giant U.S. stock market bubble. The rush of cash into the US has little place to go but equities. The bubble would be indicated when we exceed the 23,000 level on the Dow.
Armstrong has also predicted that the government bond market has peaked. Armstrong said it’s better to move out of government debt and into private debt. Specifically, when governments default, you get nothing. But when private companies default, there are still some tangible assets to be divvied up. He suggested buying AA or AAA blue chip corporate debt
They do not understand that sometimes governments go bust and when that happens, you get strange results that do not mirror 1929.
They have this view that if they can eliminate cash, they can get whatever they want in taxes out of you. You have no way of doing a bank run … there’s no money.
In terms of negative interest rates in Europe, Armstrong said that European banks just sent cash to their American affiliates, who then parked excess reserves at Fed. So European banks weren’t subject to negative rates. Instead, they got paid by Fed to park their money.
And Armstrong says that the economic system is broken because politicians are motivated to ignore the real world so they can continue manipulating things for their own benefit:
Economists line up with their hands out looking for money and spin wonderful stories about how government can manipulate the world to its benefit. Whatever the governments pays them to suggest!
Government has no interest in Laizzez-faire economics for that maintains that the economy is far too complex for government to interfere. Governments embrace Marx and Keynes because they gave politicians the idea that they can manipulate the world for their political gain.


-
I know Mike is a very solid investor and respect his opinions very much. So if he says pay attention to this or that - I will.
~ Dale G.
-
I've started managing my own investments so view Michael's site as a one-stop shop from which to get information and perspectives.
~ Dave E.
-
Michael offers easy reading, honest, common sense information that anyone can use in a practical manner.
~ der_al.
-
A sane voice in a scrambled investment world.
~ Ed R.
Inside Edge Pro Contributors

Greg Weldon

Josef Schachter

Tyler Bollhorn

Ryan Irvine

Paul Beattie

Martin Straith

Patrick Ceresna

Mark Leibovit

James Thorne

Victor Adair