
Energy & Commodities

Recently, I had the privilege of appearing on “Countdown to the Closing Bell,” Liz Claman’s program on Fox Business. When asked if I was nervous that stocks are heading too high, I said that I’m very bullish. All around the world, exports are up, GDPs are up and the global purchasing manager’s index (PMI) is up.
Oil prices continue to remain low, however, thanks in large part to the ingenuity of Texas fracking companies. As I told Liz, this has served as a multibillion-dollar “peace dividend” that has mostly helped net importing markets, including “Chindia”—China and India combined, where 40 percent of the world’s population lives—Japan and the European Union.

I can’t emphasize enough how impressive it is that Texas shale oil producers continue to ramp up output even with crude remaining in the $50 per barrel range.
This underscores their efficiency and innovation in drawing on oil reserves that were largely out-of-reach as recently as 10 or 12 years ago. What’s more, common law property rights here in the U.S. benefit mining companies in ways that simply can’t be found in Latin America and other parts of the world that operate under civil law.
According to the Energy Information Administration’s (EIA) most recent report on drilling productivity, total U.S. shale oil output is expected to climb above 6 million barrels a day for the first time in September. The biggest contributors are Texas shale oilfields, which will exceed 4 million barrels a day. West Texas’ Permian Basin alone represents nearly 400 percent of these gains, according to research firm Macrostrategy Partnership.
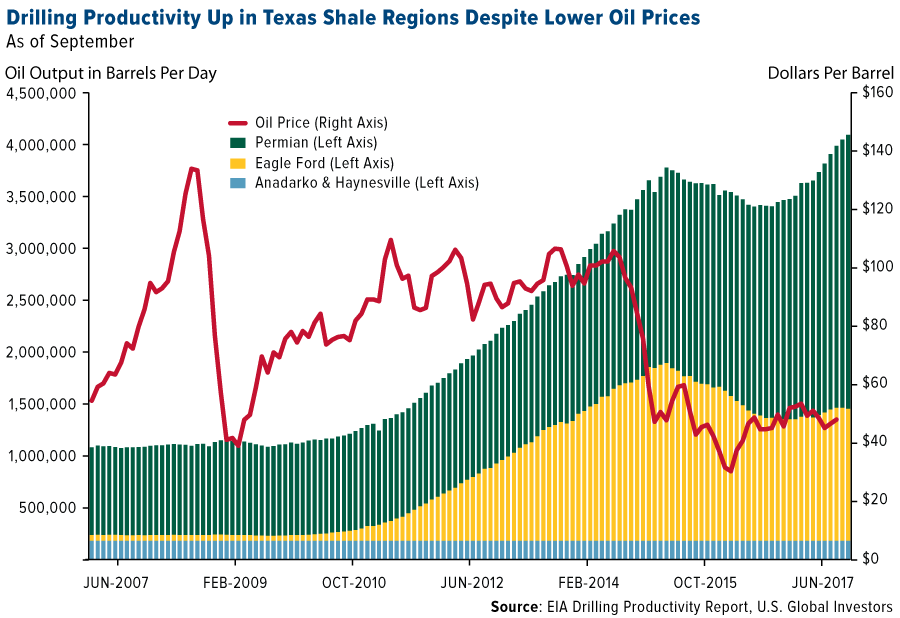
The typical Permian well remains very profitable even with $50-a-barrel oil, according to Bloomberg New Energy Finance. The research group estimates that oil would need to drop below $45 a barrel for some Permian wells to become unprofitable.
Christi Craddick, the Texas Railroad Commissioner, praised the Texas fracking industry in her address at the annual Panhandle Producers and Royalty Owners Association (PPROA) meeting last week. She noted how essential shale oil producers are to the Texas economy, adding that despite the downturn in oil prices, “the Texas oil and gas industry has shown extraordinary resilience.”
“When times were tough, the industry did what it does best—innovate,” she said. “Because of your ingenuity, we’re seeing industry growth today despite the price of oil.”
Again, it’s this ingenuity that’s kept oil prices relatively low, which in turn has helped strengthen GDPs in oil-importing emerging markets and squeeze the revenue of exporters such as Russia, Qatar, Saudi Arabia and others.
Texas-based oil and gas exploration company Anadarko Petroleum was one of the top performing natural resource stocks last week, gaining more than 12 percent. The surge came on the heels of the company’s announcement that it approved a $2.5 billion stock buyback program.
Explore investment opportunities in oil and other natural resources!
Coming Together as a Community
A month after the Texas Gulf Coast was devastated by the unprecedented wind and rains of Hurricane Harvey, the cleanup and rebuilding continues. As I shared with you in an earlier post, the Texas economy is one of the strongest in the world, and its residents are committing to rebuilding Houston and other affected areas better than ever before. As a proud Texan by way of Canada, I can say that it’s in our culture to come to one another’s aid in times of need and help rebuild.
Synchronized Global Growth Is Finally Here: OECD

I believe that my bullishness was validated last week with the release of the Organization for Economic Cooperation and Development’s (OECD) quarterly economic outlook. According to the Paris-based group, synchronized global growth is finally within sight, with no major economy in contraction mode for the first time since 2008. World GDP is expected to advance 3.5 percent in 2017—its best year since 2011—and 3.7 percent in 2018.

This news comes only a couple of weeks following the release of the August global manufacturing PMI, which shows that manufacturing activity around the world accelerated to its highest level in over six years. Not only is the index currently above its three-month moving average, but it’s also now held above the key 50 threshold for a year and a half, indicating strong, sustained industry expansion.

As I’ve shown before, the global PMI has been a good indicator of exports and commodity prices three to six months out, so I see this as very positive.
Where to Invest in the Global Bull Run
World markets seem to agree. Not only are domestic averages closing at record highs on a near-daily basis, but global stocks continue to head higher as well. The MSCI World Index, which tracks equity performance across 23 developed countries, is up 14 percent so far this year as of September 20. And just so we’re clear that emerging countries aren’t being left out, the MSCI Emerging Markets Index has gained close to 30 percent over the same time period.
One of the most attractive regions to invest in right now is Asia, specifically the China region, which has outperformed both the American and European markets year-to-date. The Hang Seng Index has advanced more than 27 percent, driven mostly by financials and tech stocks such as Tencent and AAC Technologies.
In addition, Asian stocks look very cheap, trading at only 13.97 times earnings. The S&P 500 Index, by comparison, is currently trading at 21.44 times earnings.
A Rebalance of Monetary and Fiscal Policies Needed for Sustainable Growth
But back to the OECD report. The group points out that the good times could easily come to an end if world governments don’t make efforts to balance monetary and fiscal policies, something I’ve been urging for years now.
Central banks are eyeing the stimulus exit door, with the Federal Reserve planning to begin unwinding its $4.5 trillion balance sheet as early as next month. The European Central Bank (ECB) ready to reduce its monthly bond-purchasing program sometime in early 2018, and the Bank of England (BOE) isexpected to raise interest rates in November for the first time since 2007.
As such, governments need to strengthen business investment, global trade and wage growth. The OECD adds that “more ambitious structural reforms” in emerging economies “are needed to ensure that the global economy moves to a stronger and more sustainable growth path.”
Only then can this new period of synchronized global growth be sustained in the long term.
All opinions expressed and data provided are subject to change without notice. Some of these opinions may not be appropriate to every investor. By clicking the link(s) above, you will be directed to a third-party website(s). U.S. Global Investors does not endorse all information supplied by this/these website(s) and is not responsible for its/their content.
The J.P. Morgan Global Purchasing Manager’s Index is an indicator of the economic health of the global manufacturing sector. The PMI index is based on five major indicators: new orders, inventory levels, production, supplier deliveries and the employment environment.
The MSCI World Index is a free-float weighted equity index. It was developed with a base value of 100 as of December 31, 1969. The index includes developed world markets, and does not include emerging markets. The MSCI EM (Emerging Markets) Index is a free-float weighted equity index that captures large and mid-cap representation across Emerging Markets (EM) countries. The index covers approximately 85% of the free float-adjusted market capitalization in each country. The Hang Seng Index is a free-float capitalization-weighted index of a selection of companies from the Stock Exchange of Hong Kong. The components of the index are divided into four subindices: Commerce and Industry, Finance, Utilities, and Properties. The index was developed with a base level of 100 as of July 31, 1964. The S&P 500 Index is a capitalization-weighted index of 500 stocks. The Index is designed to measure performance of the broad domestic economy through changes in the aggregate market value of 500 stocks representing all major industries. The index was developed with a based level of 10 for the 1941-43 based period.
Holdings may change daily. Holdings are reported as of the most recent quarter-end. The following securities mentioned in the article were held by one or more accounts managed by U.S. Global Investors as of 6/30/2017: Tencent Holdings Ltd., AAC Technologies Holdings Inc.


![]()
In This Week’s Issue:
- Stockscores Webinar – How to Profit from the Stockscores Indicators
- Stockscores’ Market Minutes Video – Risk Management Matters
- Stockscores Trader Training – Return on Capital
- Stock Features of the Week – Opportunities in ETFs
Stockscores Webinar – How to Profit from the Stockscores Indicators
There are a number of unique indicators offered through the Stockscores Market Scan and for use on Tradestation. During the presentation, Stockscores founder Tyler Bollhorn will demonstrate their use and power, and provide the back story on how they came to be. http://www.stockscores.com/trader-training/upcoming-events/#events
Stockscores Market Minutes – Risk Management Matters
It is more important to manage risk on your trades than it is to make the right trades. You won’t be right all of the time so it is essential to limit the size of your losses. When you have a winner, let it run since the winning trades have to pay for the losers. Trade of the week on $FDX. Click Here to Watch
To get instant updates when I upload a new video, subscribe to the Stockscores YouTube Channel
Trader Training – Return on Capital
A Stockscores user asked me a question that I think many people have, “If you have more trade opportunities than capital, how do you pick which trades to take?”
The short and simple answer is to take the trades that give you the most bang for your buck. Let me explain.
We size our trade positions based on the risk of the trade. The risk of the trade is the difference between the entry price and the stop loss price. Divide the risk in to your risk tolerance amount and you have the number of shares you can buy.
Consider two trade possibilities, each with strong charts that show the same potential for price appreciation. The first has an entry price of $5 with support, and therefore our stop loss point, at $4.50. That means there is $0.50 of downside, or the potential for a 10% drawdown.
The second trade has an entry price of $20 with a $19 support price and stop loss point. On this trade, if wrong, we stand to lose $1 per share or 5% drawdown, since $1/$20 is 5%.
If we are willing to risk $500 on each trade, we will buy 1000 shares of the $5 stock for a total cost of $5,000 and 500 shares of the $20 stock for a total cost of $10,000. Each trade has the same amount of risk but the second trade requires more capital because the stock is less volatile. That also means the expectation for percentage gain on the second position is also less. The price volatility on the entry signal is a good predictor of what price volatility will be in the trend.
Clearly, the first trade gives more bang for the buck. We can use less capital for the same profit potential. We may believe both trades have the potential to make $1000 but the first trade will do it with half as much money invested. For a trader with limited capital, the first trade is the one to take.
Generally, lower priced stocks will be more volatile on a percentage basis, making them a source of greater percentage gain potential. You can place less capital in to a low priced stock to get the same dollar upside as a higher priced stock trade.
I did a quick survey of this week’s best gainers to confirm this fact. I ranked the 2000 most actively traded stocks in the US last week by percentage gain and focused on the top 20 gainers. Of the top 20, 17 were under $10. The other 3 were under $20.
The lesson here is to focus on lower priced stocks if you have less capital to trade with. Many will argue that these lower priced stocks are riskier and maybe dangerous for a risk averse trader. They are actually not riskier, they are more volatile. That means you have to take a smaller position size in them so that the risk of the trade does not exceed your risk tolerance.
By adjusting position size based on the difference between the entry price and stop loss price, you can make every stock trade have the same amount of risk. If the stock is volatile buy less. If your amount of capital is insufficient for all the trades you find, focus on the lower priced stocks.
There is one caveat to this style of risk management. Lower priced stocks tend to have an added element of risk because they have a greater potential for price gaps. Lower priced stocks tend to have less established or diversified businesses which means a problem with one of their businesses can have a major impact on share price. It is much easier for a small Biotech stock to gap down 30% on bad news than it is for Pfizer to. That means the low priced stocks you trade could blow through your stop loss point if bad news brings a big price gap.
That makes it important to not put all of your capital in to just a few low priced stocks. If you are going to focus on relatively cheap stocks then you must own a number of them so that a larger than expected loss on one of them does not bring your portfolio performance down significantly.
If you have less capital to trade with than what you would like, focus on the lower priced stocks. You can adjust your Stockscores Market Scans to include a price filter for stocks under $10 or even lower if you like. Just remember to size your positions based on the volatility of the stock, the difference between the entry price and support on the chart, where you will put your loss limit. By doing that, you can match the risk of the trade to your risk tolerance and use less capital to gather the same dollar profit potential.
![]()
I am working on a developing a new strategy for investors who want to trade Exchange Traded Funds. This will utilize weekly charts and seek abnormal action through trendlines. Here is a sneak peak at the sort of ETFs that this strategy will seek out, using either the Stockscores Market Scan on the Stockscores indicators for Tradestation.
1. T.XIU
T.XIU is an ETF based on the TSX 60 index. This market has underperformed the US but the action last week indicates that T.XIU is ready to catch up to its south of the border peers. Support at $22.

2. T.XEG
T.XEG is another recent underperformer, the Canadian Energy sector ETF may finally be turning higher after drifting lower the past 7 months. Support at $10.80.

References
- Get the Stockscore on any of over 20,000 North American stocks.
- Background on the theories used by Stockscores.
- Strategies that can help you find new opportunities.
- Scan the market using extensive filter criteria.
- Build a portfolio of stocks and view a slide show of their charts.
- See which sectors are leading the market, and their components.
Disclaimer
This is not an investment advisory, and should not be used to make investment decisions. Information in Stockscores Perspectives is often opinionated and should be considered for information purposes only. No stock exchange anywhere has approved or disapproved of the information contained herein. There is no express or implied solicitation to buy or sell securities. The writers and editors of Perspectives may have positions in the stocks discussed above and may trade in the stocks mentioned. Don’t consider buying or selling any stock without conducting your own due diligence.

The risk to the precious metals market is that the dollar may have formed an intermediate cycle bottom and the euro an intermediate cycle top. The euro is up against a major resistance level which is unlikely to be broken on its first try. This video explains why it is risky to press the long trade in precious metals at this time.
https://blog.smartmoneytrackerpremium.com/

“The Wall of Worry is Gone”
– Zero Hedge, September 15, 2017.
“Every bull market climbs a wall of worry and with a rush of enthusiasm, leaps over only to find ‘Murphy’ waiting.”
– Institutional Advisors, at the peaks in 2007 and 2000. As well as now.
Through the summer we received questions about how the stock market could roll over after registering high momentum and sentiment readings on the surge into June. Then in August, the DJIA soared to accomplish the same excesses. And as we have been noting if this arose in 2017, the action could set a cyclical peak, rather than another trading high as in 2015. Our target since the April Springboard Buy has been that New York could accomplish the final surge of the bull market into September.
The Zero Hedge chart provides fresh and vivid indication of excess – at a key time.
Of course, the stock exchange is a market of individual stocks, and Wall Street has been doing its best in suggesting individual stocks represents attractive value. No need to change investor’s behavior.
Maybe this could soon be criticized.
Checklist for a Top
With buoyant action into September it is appropriate to review our “Checklist”.
Is the market up when it should be? Yes. The action has been likely to accomplish a final thrust into September and perhaps into early October.
Are there signs of speculation? Yes. This piece provides outstanding examples.
How sound is the fundamental story? The prospect of a pro-business administration is now in the market but has yet to be achieved.

As reviewed above, P/E valuations can be made attractive by generous estimates on earnings. Whether to use trailing or anticipated earnings has always been debatable.
However, by charting the S&P against the average wage reduces the ability to improve one side of the valuation equation. Will the average wage increase by some 15 percent over the next year?
Not likely, and the number is materially higher than reached in the Dot-Com Mania that climaxed in March 2000.

The stock market is remarkably overvalued and, again, accomplishing dynamic excesses close to the time when the action could peak.
Wikipedia has a good review of “Murphy’s Law”.

While it may be by only by a hair, the Equal Weighted index is still below the July high. There hasn’t been an outright bearish divergence since October 2007.

BOB HOYE, INSTITUTIONAL ADVISORS – WEBSITE: www.institutionaladvisors.com


-
I know Mike is a very solid investor and respect his opinions very much. So if he says pay attention to this or that - I will.
~ Dale G.
-
I've started managing my own investments so view Michael's site as a one-stop shop from which to get information and perspectives.
~ Dave E.
-
Michael offers easy reading, honest, common sense information that anyone can use in a practical manner.
~ der_al.
-
A sane voice in a scrambled investment world.
~ Ed R.
Inside Edge Pro Contributors

Greg Weldon

Josef Schachter

Tyler Bollhorn

Ryan Irvine

Paul Beattie

Martin Straith

Patrick Ceresna

Mark Leibovit

James Thorne

Victor Adair