
Stocks & Equities

![]()
In This Week’s Issue ending September 19, 2017
- Stockscores Webinar – How to Create a Trading Strategy
- Stockscores’ Market Minutes Video – Beware of Parabolic Trends
- Stockscores Trader Training – The Economics of Trading
- Stock Features of the Week – Abnormal Breaks
Stockscores Free Webinar – How to Create a Trading Strategy
Stockscores Founder Tyler Bollhorn will show the steps and thought process to create a new trading strategy, whether you are looking to day, swing or position trade.
Click here to register. http://www.stockscores.com/trader-training/upcoming-events/#events
Stockscores Market Minutes – Beware of Parabolic Trends
This week, a look at what a parabolic trend is in stocks or markets, and the importance of understanding how they affect your trading. Plus, my weekly market analysis and my trade of the week on Ballard Power ($BLDP).
To get instant updates when I upload a new video, subscribe to the Stockscores YouTube Channel
Trader Training – The Economics of Trading
I am often asked, “How much money can you make day trading the stock market?” I understand why people ask the question but it is a question that is hard to answer because there are so many variables. It is like asking, “How much money can you make playing hockey?” For some, it is millions, for others, it only costs them money.
Of course, trading skill is the most important factor. Trading is not complicated, in fact, it is the simple things that work the best. This is not to say that trading is easy; it is actually quite hard but not because it is intellectually demanding. It is just hard for most people to disconnect themselves from their emotional attachment to money.
The rules for most of my trading strategies could be written down on the back of a napkin – they are simple. Executing them properly takes practice and emotional control. For some, that is not too hard. For others, it can be close to impossible.
You do not have to be exceptionally smart to be a good stock trader; I think most people are smart enough. It does take more determination and hard work than a lot of people are willing to invest but the great thing about both of those things is that neither is exclusive. No matter what your age, gender, looks, intelligence, nationality or social status, hard work and determination are achievable.
Before I go in to the economics of trading, let me first explain a few important concepts. The first is risk, the difference between the price you buy a stock and the stop loss point. If you buy a stock at $20 and have a stop loss at $19, you are risking $1 a share.
The reward is the difference between the entry price and the profitable exit price, assuming you are not stopped out with a loss. That stock you bought at $20 has a reward of $5 if you sell it at $25.
The reward for risk is the reward divided by the risk. In this example, the reward for risk is 5 since the profit was $5 for a risk of $1. How much you actually make depends on what your risk tolerance is.
If you are willing to lose $500 on a trade then you would have bought 500 shares in this example. $500 of risk tolerance divided by $1 of risk demands you buy 500 shares. With an exit at $25, you earn $2500 or five times your risk.
How much money did it take to make the $2500? 500 shares of a $20 stock costs you $10,000, assuming you only use your capital. If you use leverage, which most brokerages will give you at 2 to 1 and some brokers will give you at 3 to 1, you lower the capital requirement. With 2 to 1 leverage, you need $5000 to make the $2500 profit. With 3 to 1, you only need $3333. With more leverage, the percentage return goes up but so too does the potential percentage loss.
Now, what can you expect to make in terms of reward for risk? This is where there are variables outside your control that have a big effect on performance. If the market is hot, it is much easier to find winning stocks and the size of those winners will be greater than if the stock is dead. No matter how hard you work or how skilled you are as a trader, you cannot control how many opportunities the stock market is going to give you.
As a general guideline, I think that a skilled trader in a reasonable market can earn an average of 10 times risk in a week. So, if you risk $500 on each trade, you should be able to make $5000. I want to stress, however, that your skill and the state of the market are two very important variables in this calculation.
The final question is how much capital do you need to risk $500 on each trade? Again, the state of the market is an important part of this equation. There are times when the hot sector of the market is the low priced stocks. The size of your position in these stocks tends to be smaller because these stocks are more volatile. You may be able to take $500 or risk with a $5000 position (which with leverage may require less than $2000 of your capital).
In a market where the large cap stocks are the hot area you could need 10 times as much capital to achieve the same amount of risk.
As a general rule, take your risk tolerance and multiply it by 100 to get the required capital, before leverage. So, if you risk $500 you will need $50,000 of capital to take the trades that come to you. If the stocks you trade are smaller, more volatile names, that amount could be a lot less.
Above all else, none of this works if you are a person who approaches the market with a gamblers mentality. Losses are part of trading and you have to be prepared to take the small loss when the market leads you astray. When you get a winner you have to be willing to let the profit run so that the winners can pay for the losers and still leave you some overall profit.
![]()
This week, I ran Abnormal Breaks US scan in search of stocks making strong price gains that were breaking long term downward trend lines. Here are two that look like they may be reversing their downward trends.
1. LLNW
LLNW is breaking out from a short consolidation and should continue its long term upward trend from here. Support at $3.64.

2. DHT
DHT breaking its long term downward trend with strong volume and price action. Support at $3.89.

References
- Get the Stockscore on any of over 20,000 North American stocks.
- Background on the theories used by Stockscores.
- Strategies that can help you find new opportunities.
- Scan the market using extensive filter criteria.
- Build a portfolio of stocks and view a slide show of their charts.
- See which sectors are leading the market, and their components.
Disclaimer
This is not an investment advisory, and should not be used to make investment decisions. Information in Stockscores Perspectives is often opinionated and should be considered for information purposes only. No stock exchange anywhere has approved or disapproved of the information contained herein. There is no express or implied solicitation to buy or sell securities. The writers and editors of Perspectives may have positions in the stocks discussed above and may trade in the stocks mentioned. Don’t consider buying or selling any stock without conducting your own due diligence.

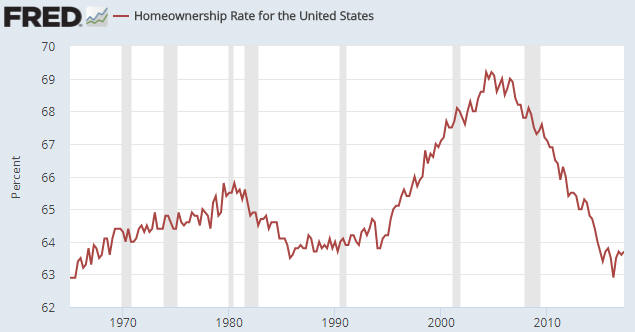
In a 2015 blog post titled “Unintended Consequences” I explained that policies implemented by the Clinton and Bush administrations to boost the rate of home ownership not only had unintended consequences, but the opposite of the intended consequence. This post is a brief update on the US home ownership situation.
As evidenced by the following chart, the government was initially successful in its endeavours. The home-ownership rate sky-rocketed during the second half of the 1990s and the first half of the 2000s as it became possible for almost anyone to borrow money to buy a house. As also evidenced by the following chart, the home-ownership rate subsequently collapsed. The collapse was an inevitable consequence of people throughout the economy first responding to the Fed’s and the government’s incentives to take on excessive debt and then finding themselves in drastically-weakened financial situations.
The home ownership rate ended up bottoming in Q2-2016 at a 50-year low.
No one in the government or at the Fed has ever admitted culpability for the mortgage-related debt binge that led to the spectacular rise and equally-spectacular fall in the US home-ownership rate. Apparently, it was a market failure.

 A brief look over time at periods of extreme volatility in the stock market shows us that many of these periods are associated with unpredictable, large-scale disruptions, often termed as “black swan” events. We have experienced these events within our own lifetime – the 2011 tsunami in Japan, the collapse of Lehman Brothers in 2008, and the unforgettable 9/11 terrorist attacks in 2001.
The origin of the term “black swan” dates back historically to a time when swans were only believed to be only white in colour. At that time, a black-coloured swan was seen as an impossibility. More recently, former Wall Street analyst and Chicago options exchange trader Nassim Nicholas Taleb redefined a black swan event to be an outlier which has an extreme impact but, due to human nature and rationalization, becomes explainable.
A look back over time shows that black swan events occur fairly frequently. They may have a significant short-term impact on the financial markets, but oftentimes do not create any long-lasting impact. These abrupt market-changing events often cause discomfort and, due to human nature, often pressure investors to hastily react. However, in hindsight, after these black swan events are over and things have returned to normal, the simple act of staying-the-course may also be a viable defense.
Are there any pre-emptive measures that you can take to prepare for a black swan event? Here are some practical investment tactics that you might consider to help you to black swan-proof your investment portfolio.
- Diversifying – Having a diversified portfolio may extend beyond ensuring investments across different industries, geographies or asset classes. Consider a strategy that combines various types of risk. Shorter term bonds may be one way to manage interest-rate risk. Inflation-protected investments may help to manage purchasing-power risk.
-
Rebalancing – If one of your shares has gone up so much that its value makes up a greater proportion of your overall portfolio, it may be a good time to consider selling to restore balance. By selling high (and buying low!), the basic idea here is to ensure that proper diversification is maintained through balanced allocations.
-
Hedging – Annuities offer guaranteed income streams and options, such as calls, may help to provide downside price protection to mitigate risk. However, over time hedging a portfolio may be costly and should be managed carefully.
-
Upgrading – More speculative holdings may be replaced with shares of larger, more established companies to form the basis for your portfolio as these companies may have greater stability and be able to better withstand a downturn.
-
Dollar Cost Averaging – By engaging in the practice of buying at regular intervals regardless of market conditions, you purchase greater shares when prices are low and fewer shares when prices are high, lowering the overall cost of shares purchased over time.
Brent Woyat, CIM, CMT
Investment Advisor, Portfolio Manager
Canaccord Genuity Wealth Management
T: 604.699.0869 | F: 604.643.1802
![]()
Canaccord Genuity Wealth Management


Co-authored by Simon Black & Tim Price via SoverignMan
In the late spring of 1720, Sir Isaac Newton decided to sell his stocks.
Newton had been an investor in the South Sea Company, a famous enterprise which effectively commanded a trading monopoly with South America.
The investment had already made Newton a lot of money, he was up more than 100% in a very short time.
In fact, investors were clamoring to buy up the South Sea Company’s stock, and the share price kept climbing. And climbing.
Newton sensed that the market was getting overheated. It no longer made sense to him. So he sold.
There was only one problem: the share price of the South Sea Company kept climbing.
All of Newton’s friends were getting rich. So, against his better judgement, Newton went back in, repurchasing shares at more than three times the price of his original stake.

The market then collapsed, and he lost virtually all his life savings.
The experience is said to have given rise to his bemused response:
“I can calculate the movement of stars, but not the madness of men.”
It’s now been roughly ten years since the Global Financial Crisis began.
In the time-honoured manner of regulators, they waited until the battle was largely over, then waded onto the battlefield and shot the survivors.
The decade since has seen unprecedented monetary stimulus, i.e. central bankers have expanded their various money supplies by trillions upon trillions of dollars, giving rise to a massive bubble in asset price worldwide.
Stocks are at all-time highs. Bonds are at all-time highs. Property prices are at all-time highs. Many alternative assets like private equity and collectibles are at all-time highs.
Yet asset prices keep climbing.
Perhaps desperate to avoid the mistakes of Isaac Newton, Scotsman Hugh Hendry, founding partner of Eclectica Asset Management, has recently announced that he is closing his hedge fund.
Hendry is a famous critic of this monetary absurdity and consequent asset bubble.
“It wasn’t supposed to be like this.. markets are wrong,” Hendry told investors.
Of course, the market is under no obligation to be right. Ever.
Hendry’s view is accurate– nearly every objective metric shows that the market is incredibly overpriced.
Clint Eastwood’s infamous character Dirty Harry once remarked that a man needs to know his limitations. We think we know at least some of ours: we can’t time markets.
And the only thing we know with any certainty, as sure as night follows day, is that there are always corrections– both booms AND busts.
A decade’s worth of QE and ZIRP has fuelled a runaway train, and at some point there will be a correction.
Does it make sense to stand in front of the train? Or is it better to, as Isaac Newton did, leap aboard for some final thrills?
We prefer neither.
Instead we’re diversifying as pragmatically as we can, working diligently to find undervalued companies run by honest, talented managers.
It requires more hard work and patience than buying some overpriced index fund or whatever the popular investment du jour happens to be.
But nobody ever said this investing business was supposed to be easy.
Earlier this year my publishers invited me to write the foreword to their definitive edition of Reminiscences of a Stock Operator, a thinly disguised biography of the legendary trader Jesse Livermore.
Livermore was extraordinary. Born in 1877, Livermore ran away from home as a child and soon began trading stocks.
By the time he was 20, he had already amassed a fortune of $3 million, more than $75 million in today’s money.
Livermore sold short, i.e. bet that stock prices would fall, just prior to the 1907 crash, as well as the 1929 crash.
His bets were so lucrative that, going into the Great Depression, Livermore had a fortune of more than $100 million, or about $1.4 billion today.
But Livermore wasn’t just great at making money from overheated markets. He was also a master of losing money.
This book is widely and rightly regarded as an investment classic. It is also crammed with valuable observations about the practice of speculation and successful trading.
Among them, the importance of being patient and disciplined:
“After spending many years in Wall Street and after making and losing millions of dollars I want to tell you this: It never was my thinking that made big money for me. It was always my sitting.”
Sitting. As in, doing nothing. As in… neither standing in front of the train, nor jumping on board.
Hedge fund managers like Hugh Hendry don’t have this option. They have to be invested. They have to report to their investors every quarter… and if they’re not making money, investors bail.
But as an individual, you are not accountable to anyone but yourself.
So you are free to sit… and patiently wait for the safe, compelling investments that will arise once market conditions return to sanity.
To your freedom,
Simon Black
Founder, SovereignMan.com
[Editor’s note: This letter was co-written with Tim Price, co-founder of the VT Price Value portfolio and editor of Price Value International.]
PS –
To see exactly what Tim is recommending readers do with their money, I’d encourage you to sign up for his investing service, Price Value International.You can learn more here…

-
I know Mike is a very solid investor and respect his opinions very much. So if he says pay attention to this or that - I will.
~ Dale G.
-
I've started managing my own investments so view Michael's site as a one-stop shop from which to get information and perspectives.
~ Dave E.
-
Michael offers easy reading, honest, common sense information that anyone can use in a practical manner.
~ der_al.
-
A sane voice in a scrambled investment world.
~ Ed R.
Inside Edge Pro Contributors

Greg Weldon

Josef Schachter

Tyler Bollhorn

Ryan Irvine

Paul Beattie

Martin Straith

Patrick Ceresna

Mark Leibovit

James Thorne

Victor Adair