
Gold & Precious Metals
In China, nearly all physical gold supply flows through the Shanghai Gold Exchange (SGE). Likewise, nearly all gold demand in China is met by physical gold withdrawals from the Shanghai Gold Exchange’s nationwide network of precious metals storage vaults.
Therefore, using the broadest definition of gold demand, SGE gold withdrawals are a suitable proxy for overall gold demand in China. This gold demand can be labelled as “Chinese Wholesale Gold Demand” and comprises two main categories, namely, consumer gold demand and institutional gold demand. Consumer gold demand generally refers to gold jewellery fabrication demand, retail physical gold bar and coin demand, and in some cases also includes industrial fabrication demand. Institutional demand can be viewed as individual and institutional investor purchases of gold bullion directly on the SGE trading bourse, and withdrawal of this gold from the SGE vaults.
SGE gold withdrawals for 2016 totalled 1970 tonnes. Although this was 24% lower than 2015’s record 2596 tonnes of SGE gold withdrawals, it was still in line with 2014’s total of 2102 tonnes of gold withdrawals
Contents
Highlights
-
The vast majority of overall gold demand in China is met by gold withdrawals from the Shanghai Gold Exchange (SGE).
-
This ‘Wholesale’ gold demand consists of 2 main components, namely consumer gold demand and institutional gold demand.
-
Institutional gold demand is a term used to reflect direct purchases of physical gold on the SGE by both institutions and individuals with SGE trading accounts.
-
Western precious metals consultancies are infamous for only reporting consumer gold demand (gold jewellery fabrication, gold bar and coin demand, and industrial gold demand), and by and large ignoring direct purchases of gold on the SGE.
-
Western precious metals consultancies therefore vastly understate the true magnitude of gold demand in China, which, based on SGE gold withdrawals, is far larger than the consumer demand figures would suggest.
Chinese Wholesale Gold Demand
Controversially, a number of Western precious metals consultancies, such as the World Gold Council, limit their definitions of Chinese gold demand solely to consumer gold demand.
For example, for 2016, the World Gold Council (which uses gold demand data collected by consultancy Metals Focus) reported Chinese gold demand of 913.6 tonnes, comprising jewellery demand of 629 tonnes, and gold bar and coin demand of 284.6 tonnes. This total is less than half of total SGE gold withdrawals for 2016.

What these consultancies methodologies fail to take into account, however, is that direct purchases of gold by institutions and individuals with trading accounts on the Shanghai Gold Exchange represent a substantial additional component of overall Chinese gold demand above and beyond consumer gold demand.
BullionStar Gold University article “Mechanics of the Chinese Domestic Gold Market” illustrates that a series of simple equations generally hold true for gold supply and demand in the Chinese gold market, and that any comprehensive definition of true Chinese gold demand must take into account both consumer gold demand and direct purchases of gold at the SGE.
Specifically:
SGE Physical Gold Supply = SGE Gold Withdrawals = Chinese Wholesale Gold Demand
On the Supply side:
SGE Physical Gold Supply = Gold Imports + Domestic mine gold supply + Gold Scrap / Recycling + Disinvestment + Recycled Distortion
Here, disinvestment refers to the sale of gold which was previously purchased directly for investment. Recycled distortion is a term that refers to recycled gold that is not scrap and that is not disinvestment. An example would be process scrap. Recycled distortion flowing through the SGE vaults overstates both the supply and demand sides of the equation, and needs to be subtracted from SGE withdrawals since it could be scrap that re-entered the supply chain.
When Recycled distortion is subtracted from SGE withdrawals, the result can be viewed as ‘True Chinese gold demand’.
On the Demand side:
Chinese Wholesale Gold Demand = Consumer Demand + Institutional Demand + Recycled Distortion
where Institutional Demand = Direct Gold Purchases At The SGE
SGE Gold Withdrawals – Recycled Distortion = “True Chinese gold demand”
and “True Chinese Gold Demand” = Consumer Demand + Institutional Demand
As a reminder, standard gold ingots and bars are VAT exempt when sold on the SGE but not when sold outside the SGE (off SGE). In contrast, non-standard gold is VAT exempt when sold outside the SGE, and non-standard gold cannot be traded on the SGE.
Standard gold refers to gold ingots of 1 kg, 3 kg (both 999.9 fine), and 12.5 kg (995 fine) weights, and also gold bars of 0.1 kg and 0.05 kg (both of which 999.9 fine). An example of non-standard gold would be a 0.2 kg (200 gram) gold bar.
Direct Gold Purchases at the SGE
Given that ‘True Chinese Gold Demand’ comprises both consumer demand and institutional demand, it’s important to look beyond the consumer demand categories of gold jewellery fabrication, gold bar and gold coin demand and industrial fabrication, and to also examine the ‘institutional demand’ category, i.e. a category which really refers both individual and institutional direct purchases of gold on the SGE.
The following bar chart graphically captures both the supply side and demand side components of the domestic Chinese gold market. The gold supply side comprises gold mine output, gold imports, scrap, disinvestment and recycled distortion. The gold demand side comprises jewellery demand, coin and bar demand, and industrial demand (all of which are consumer related), a recycled distortion component which is the same size as on the supply side, and also direct gold buying on the SGE (institutional demand).

From the above bar chart, it can be seen that the main reason why annual gold demand, as defined by precious metals consultancies, is far lower than the size of SGE withdrawals each year is because these consultancies only estimates consumer gold demand and ignores institutional demand.
By ignoring institutional demand, which is essentially investment demand, the consultancy data is vastly underestimating investment demand for gold in China. The Western consultancy data is therefore incomplete and is not an accurate representation of full gold supply and demand in China
On a cumulative basis from January 2007 to September 2016, the difference between SGE gold withdrawals and GFMS gold demand reaches a massive 5922 tonnes of gold, as can be seen in the following chart:

It’s interesting to note that the China Gold Association (CGA) defines the difference between Chinese total gold demand and Chinese consumer gold demand as ‘Net Investment’. i.e.:
Net Investment = SGE Withdrawals – Consumer Demand
Net Investment = Institutional Demand + Recycled Distortion
The composition of ‘Direct Purchases on the SGE‘ is also illuminating. In China, anyone can open an account and buy gold directly on the Shanghai Gold Exchange. This includes individual citizens and wholesale enterprises such as jewelry manufacturers and bullion banks. About 50% of SGE gold withdrawals are from wholesale gold manufacturers/fabricators. The other 50% of SGE gold withdrawals are from individual and institutional customers who purchase gold on the SGE and then withdraw it from the SGE vault network.
Chinese Commercial Bank Balance Sheets
According to Macquarie Research, by the end of 2016, there were over 3000 tonnes of gold accumulated on the balance sheets of Chinese commercial banks.
Although there is little transparency into why these commercial banks are holding gold on their balance sheets, these banks do, to various extents, report gold holdings in their accounts, although the reporting is not generally granule in nature. It is also not clear how much these commercial bank gold activities influence SGE gold withdrawals.
Koos Jansen of BullionStar has analysed a number of these bank statements, and reveals that some reasons for holding this gold on their balance sheets is as follows:
- Gold savings belonging to banks’ customers
- Gold inventory held for banks’ retail gold businesses
- Gold held as part of gold leasing operations
- Gold held for hedging purposes
- Gold held outside China
The first component, gold savings or gold deposits, represents customer gold held in Gold Accumulation Plans (GAPs) operated by these the banks. Bank customers have a claim on this gold and so it is a liability of the bank, but the bank also records the same gold as an asset on its balance sheet. Some of the banks offering GAPs in China include ICBC, China Construction Bank, and Bank of China. For example, as of the end of 2014, ICBC held GAPs representing more than 250 tonnes of gold, and GAP customers in excess of 1 million.
In the second component, since Chinese banks offer an array of retail gold investment products through their branch networks and also via the internet, these banks need to hold their own gold inventory held to back up these activities. This is also reflected on Chinese bank balance sheets as an asset.
Thirdly, Chinese banks, such as Bank of Communications and Shanghai Pudong Development Bank, are involved in the gold leasing market, and they record this gold leasing / and gold interbank lending activity on their balance sheets. As to how much of this gold leasing business represents SGE gold withdrawals is unclear, but much of the interbank leased gold probably stays within the SGE vaulting network.
References and Links
1.^ “An update on SGE Vault Withdrawals and SGE Price Premiums”, BullionStar blog, May 2017 https://www.bullionstar.com/blogs/ronan-manly/update-sge-vault-withdrawals-price-premiums/
2.^ “Spectacular Chinese Gold Demand 2015 Fully Denied By GFMS And Mainstream Media”, BullionStar blog, August 2016 https://www.bullionstar.com/blogs/koos-jansen/spectacular-chinese-gold-demand-2015-fully-denied-by-gfms-and-mainstream-media/
3.^ “Mechanics of the Chinese Domestic Gold Market”, BullionStar Gold University https://www.bullionstar.com/gold-university/the-mechanics-of-the-chinese-domestic-gold-market
4.^ “The Great Physical Gold Supply & Demand Illusion”, BullionStar, October 2016 https://www.bullionstar.com/blogs/koos-jansen/the-great-physical-gold-supply-demand-illusion
5.^ “Reconciliation and discrepancies of gold flows into China”, Maquarie Research presentation to LBMA, October 2016 http://www.lbma.org.uk/assets/events/Conference%202016/S4_Turner.pdf
6.^ “What Are These Huge Tonnages In “Precious Metals” On Chinese Commercial Bank Balance Sheets?” BullionStar blog, August 2016 https://www.bullionstar.com/blogs/koos-jansen/what-are-these-huge-tonnages-in-precious-metals-on-chinese-commercial-bank-balance-sheets/

 Back in mid-July, we called for the market to top within 3 weeks between 2487-2500. And, 3 weeks later, the market topped at 2490SPX within one day of the topping date we expected. And, since we struck that high, the market has followed through in an almost textbook fashion for the entire month of August, as we caught just about every twist and turn during the month.
Coming into the last week of August, we were expecting the market to drop down to support within the 2425-2430SPX region, and then rally back towards the 2465-2475 region, before it set up to drop back down to the 2400SPX region. As we now know, dropped hard and bottomed early that week at 2428SPX, and then rallied back to 2480SPX. When the market topped out at 2480 on September 1st, our expectation was that we would see a drop down to the 2400SPX region next.
While the market dropped 34 points from that level within the next trading day, when it came back up through 2460SPX I posted to all our members that we now have opened the door to the 2500-2510SPX region, rather than an immediate continuation down to the 2400SPX region. The main reason was that when the market did not follow through on our Fibonacci Pinball set up towards 2400SPX and came back up through the 2460SPX region, the market provided us with a strong warning that the downside follow through was much less likely. As of Friday, we have finally struck the 2500SPX region.
As I write my weekly articles about how one should ignore exogenous factors such as news or geo-political events when analyzing the markets, I always get a number of people who will argue with me. They see a single news event coincide with a directional move in the market and are absolutely convinced that the particular news event was the “obvious” cause of that market move. They then extrapolate this experience and believe that news and geo-politics are always what drives the markets.
Yet, I remain steadfast in my belief that maintaining such expectations is intellectually dishonest, as it requires you to ignore the many times that markets do not act in the manner most would believe based upon the news or geo-political events.
When the market was whipsawing around in August, and we were catching most of the turns, many of these commenters would proclaim:
“in this instance there is no doubt the driver here is Korea”
“Korea matters”
These people, who believe the market is driven by exogenous factors, have a real problem today.
If you were paying attention over the last two weeks since the market broke back over 2460SPX, we have had two of the worst weather events in recent times, which have caused damage estimating over $200 billion dollars. To put the true extent of this damage into perspective, this is reportedly about half of the combined costs of all hurricanes over the past 50 years, including Katrina ($133 billion), Sandy ($75 billion) and Andrew ($46 billion).
Moreover, during the past two weeks, we have faced further terrorist attacks along with further provocation by North Korea. Yes, the same North Korea that is “no doubt the driver” of the market.
To be more specific, not only did the hours between the Thursday evening market close and Friday morning market open see another North Korean rocket fire over Japan, we also witnessed yet another terrorist attack in London.
For those counting, that is two major negative geo-political events occurring while the market was closed before its Friday morning open. And, anyone that was so certain that “there is no doubt the driver here is Korea” was likely looking for a major red opening on Friday morning, especially when you couple it with the terrorist attack occurring before the open too.
Yet, what did the market do after it opened on Friday morning? You got it! We rallied to hit new all-time highs, and finally eclipsed the 2500SPX mark.
Again, those that believe in exogenous causation for market moves must be stumped. How can this be possible? Surely, the market must be manipulated, right? I mean, this really can’t happen in real life!?
So, allow me to remind you about some studies I like to post every now and then:
In a 1988 study conducted by Cutler, Poterba, and Summers entitled “What Moves Stock Prices,” they reviewed stock market price action after major economic or other type of news (including major political events) in order to develop a model through which one would be able to predict market moves RETROSPECTIVELY. Yes, you heard me right. They were not even at the stage yet of developing a prospective prediction model.
However, the study concluded that “[m]acroeconomic news . . . explains only about one fifth of the movements in stock market prices.” In fact, they even noted that “many of the largest market movements in recent years have occurred on days when there were no major news events.” They also concluded that “[t]here is surprisingly small effect [from] big news [of] political developments . . . and international events.” They also suggest that:
“The relatively small market responses to such news, along with evidence that large market moves often occur on days without any identifiable major news releases casts doubt on the view that stock price movements are fully explicable by news. . . “
In August 1998, the Atlanta Journal-Constitution published an article by Tom Walker, who conducted his own study of 42 years’ worth of “surprise” news events and the stock market’s corresponding reactions. His conclusion, which will be surprising to most, was that it was exceptionally difficult to identify a connection between market trading and dramatic surprise news. Based upon Walker’s study and conclusions, even if you had the news beforehand, you would still not be able to determine the direction of the market only based upon such news.
In 2008, another study was conducted, in which they reviewed more than 90,000 news items relevant to hundreds of stocks over a two-year period. They concluded that large movements in the stocks were NOT linked to any news items:
“Most such jumps weren’t directly associated with any news at all, and most news items didn’t cause any jumps.”
But, I can assure you that the great majority will simply shrug this off for whatever reason they want to believe. They will don their blinders, and simply ignore the actions over the last few weeks, since it does not fit their overall perspective about markets. In other words, they will continue to fool themselves. After all, Ben Franklin put it quite well when he noted:
“So convenient a thing is it is to be a reasonable creature, since it enables one to find or to make a reason for everything one has a mind to do.”
If these past few weeks were not enough to convince you that exogenous factors to not drive the market, about a month ago, I provided you with a list of all the “reasons” most market participants have been expecting the stock market to crash:
Brexit – NOPE
Frexit – NOPE
Grexit – NOPE
Italian referendum – NOPE
Rise in interest rates – NOPE
Cessation of QE – NOPE
Terrorist attacks – NOPE
Crimea – NOPE
Trump – NOPE
Market not trading on fundamentals – NOPE
Low volatility – NOPE
Record high margin debt – NOPE
Hindenburg omens – NOPE
Syrian missile attack – NOPE
North Korea – NOPE
Yet, the market has clearly had other ideas. As you can see, none of these reasons have mattered, as the market has simply melted up towards our longer-term target of 2500SPX, which we pointed towards several years ago, despite much disbelief.
So, either you learn the lessons clearly taught by Mr. Market over the last several years, or, continue donning those blinders while muttering to yourself “it just can’t be.”
I believe the coming week will present the market with an important short-term test. If the 2507/10SPX region holds as resistance, and we turn down to break 2480SPX, I believe we will drop to retest the 2400SPX region again. And, this is my preference at this point in time. However, if we are unable to turn down at 2507/10SPX, or if we are unable to strongly break below 2480SPX, then the market is sending us a message that it wants to head to at least the 2545SPX region, and potentially even a bit higher before wave (3) completes.
See charts illustrating the wave counts on the S&P 500.
Avi Gilburt is a widely followed Elliott Wave technical analyst and author of ElliottWaveTrader.net (www.elliottwavetrader.net), a live Trading Room featuring his intraday market analysis (including emini S&P 500, metals, oil, USD & VXX), interactive member-analyst forum, and detailed library of Elliott Wave education.

1.10 – 19:03 – Jim Dines, author of The Dines Letter has been ranked #1 several times by Timers Digest. He joins Mike to discuss the best growth areas in the market along with why the boom in marijuana stocks is just beginning. Plus his latest on gold and silver.
….also Michael’s Editorial: BC and Alberta Have Upped The Cost of Cutting Emissions


In the financial world, there are “analysts”… and then there are legends.
And this man is a LEGEND.
Over the past 70 years (!) James Dines has consistently made accurate, and profitable, predictions about the financial world. His list of accomplishments can be seen in his Biography.
In a rare engagement, at 90 plus years old James Dines joins Michael Campbell on Money Talks this Saturday Sept. 16th. for a very special interview.
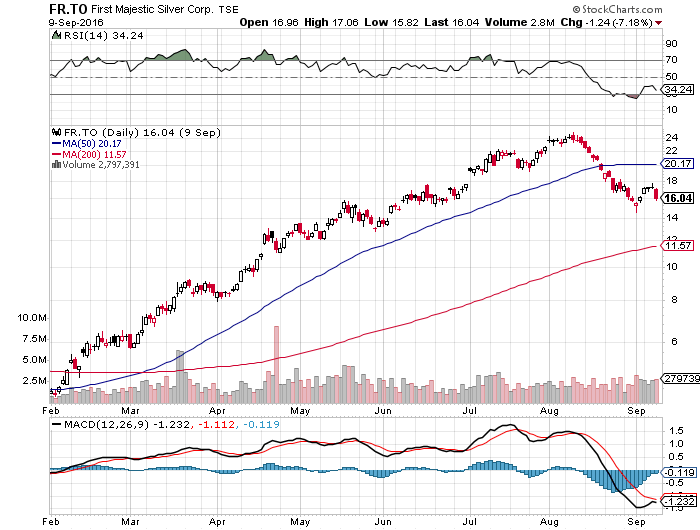
Last interviewed by Mike on Sept. 10th 2016 – Dines major profitability at that point had been gained in the Gold and Silver Stocks. Dines went bullish on Gold & Silver on Feb 13 2016 just two days before before Gold & Silver stocks erupted. Doubles, triples even a 4 bagger on:
First Majestic FR.TO which went from 5.75 to 24 in the next 6 months as illustrated in the chart below:
(Chart Dated Feb 1st 2016 to Sept. 10th 2016)
But that is not all.
The XAU Gold Stock Average ran from 55 to its peak of 115 6 months later on August 8th 2016. The junior Gold Market Average GDXJ ran from 22 to 50 on August 8th.
Dines said “he has never experienced a gold and silver rally so steep before”. Extremely bullish Gold and Silver, the power of the initial rally has a long term meaning. Right now Jim thinks the present rally, because of the power of the 2016 rally might be the first step of the 3rd wave he has been looking for. The first step was the rally $35 – $800 in the 1980’s, the second step rally was from April 2001 @ $255 to $1850 in 2011). James believes that the 3rd step would take gold to long term target of $3000 – $5000 an ounce.
Now with Gold & Silver rallying for the first time since James was last with us Sept 10th 2016, Mike has persuaded Jim to come back and tell us why he predicts in this 3rd wave an astonishing move in Silver to $300 to $500 an ounce.
Don’t miss this wonderful opportunity to hear this legend tomorrow on Money Talks. It may well be the most important interview you will hear for some time to come.
Listen to Money Talks Live HERE @ 8:30 am – 10:00 am PST Saturday Sept. 16th
The S&P 500 has had quite a run since the early 2016 lows, not experiencing even a slight pullback of 5% or more, leading many to believe that the market would wobble during the seasonally weak period of August and September. Over the last twenty years, the market has rallied only 55% of the time during August and only 50% of the time during September, losing on average 1.0% and 0.80%, respectively, in those two months before strengthening into the final three months of the year.


-
I know Mike is a very solid investor and respect his opinions very much. So if he says pay attention to this or that - I will.
~ Dale G.
-
I've started managing my own investments so view Michael's site as a one-stop shop from which to get information and perspectives.
~ Dave E.
-
Michael offers easy reading, honest, common sense information that anyone can use in a practical manner.
~ der_al.
-
A sane voice in a scrambled investment world.
~ Ed R.
Inside Edge Pro Contributors

Greg Weldon

Josef Schachter

Tyler Bollhorn

Ryan Irvine

Paul Beattie

Martin Straith

Patrick Ceresna

Mark Leibovit

James Thorne

Victor Adair