Currency
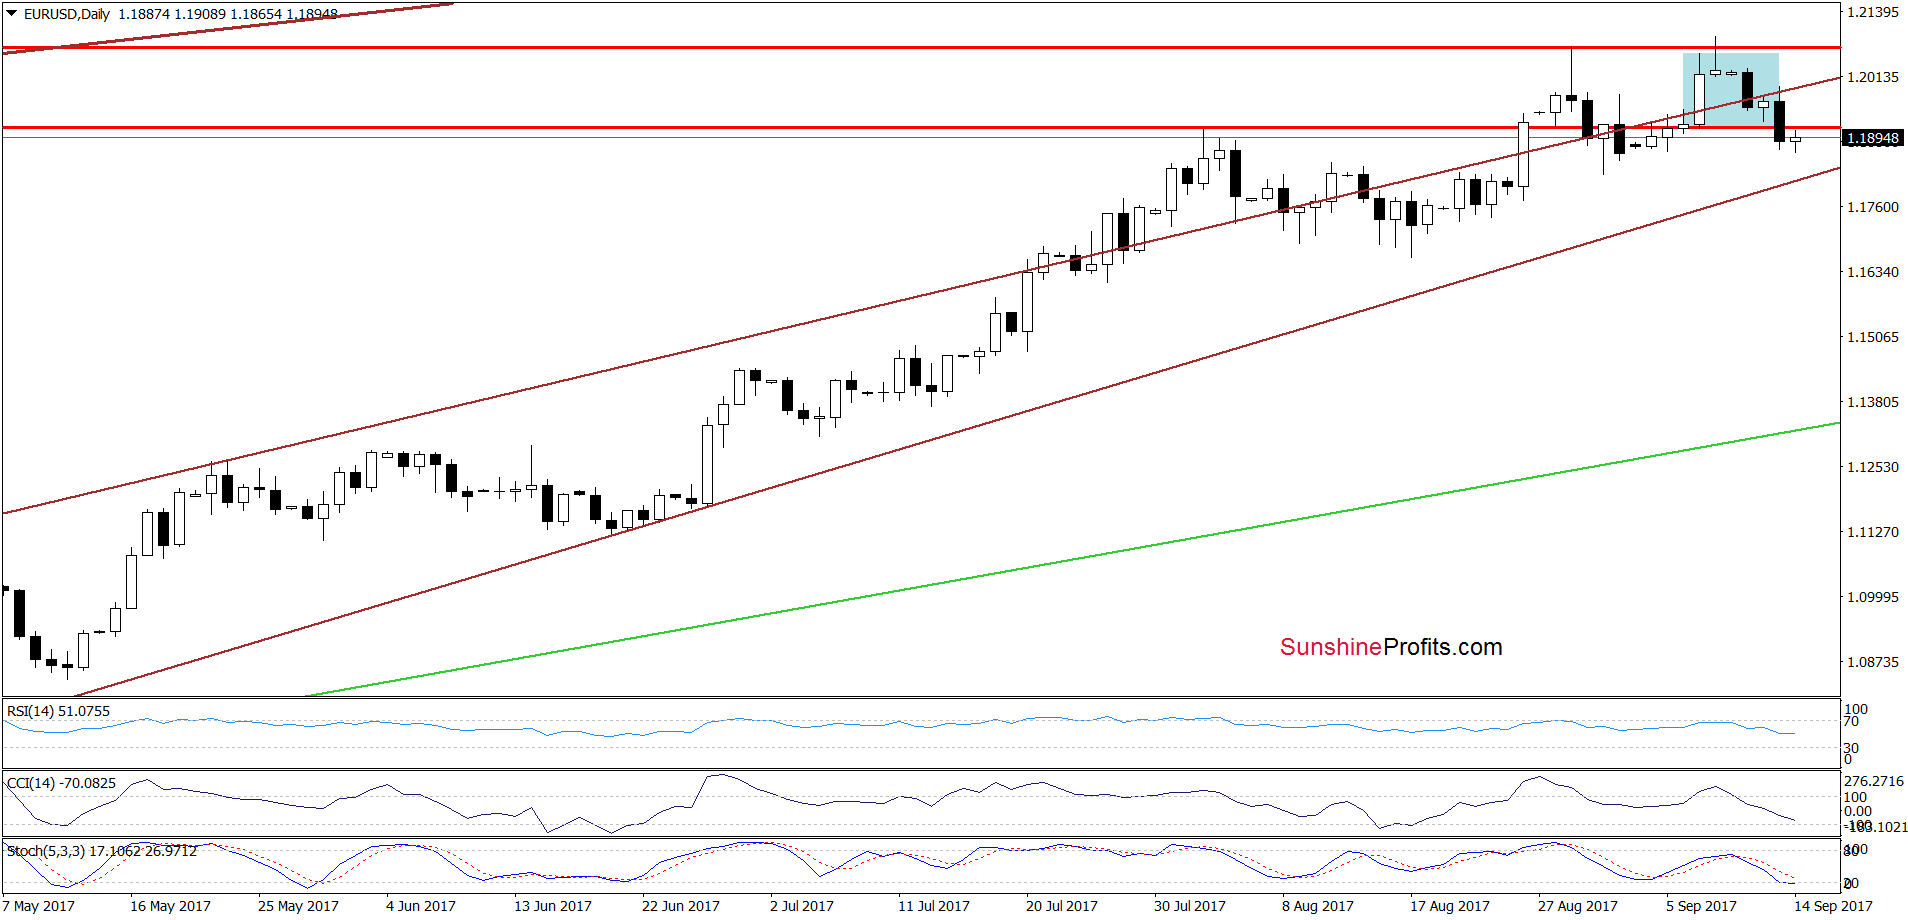
Yesterday, EUR/USD verified the breakdown under the upper border of the trend channel and declined, closing the day below the early August peak. What does it mean for the exchange rate?
EUR/USD
On Tuesday, we wrote the following:
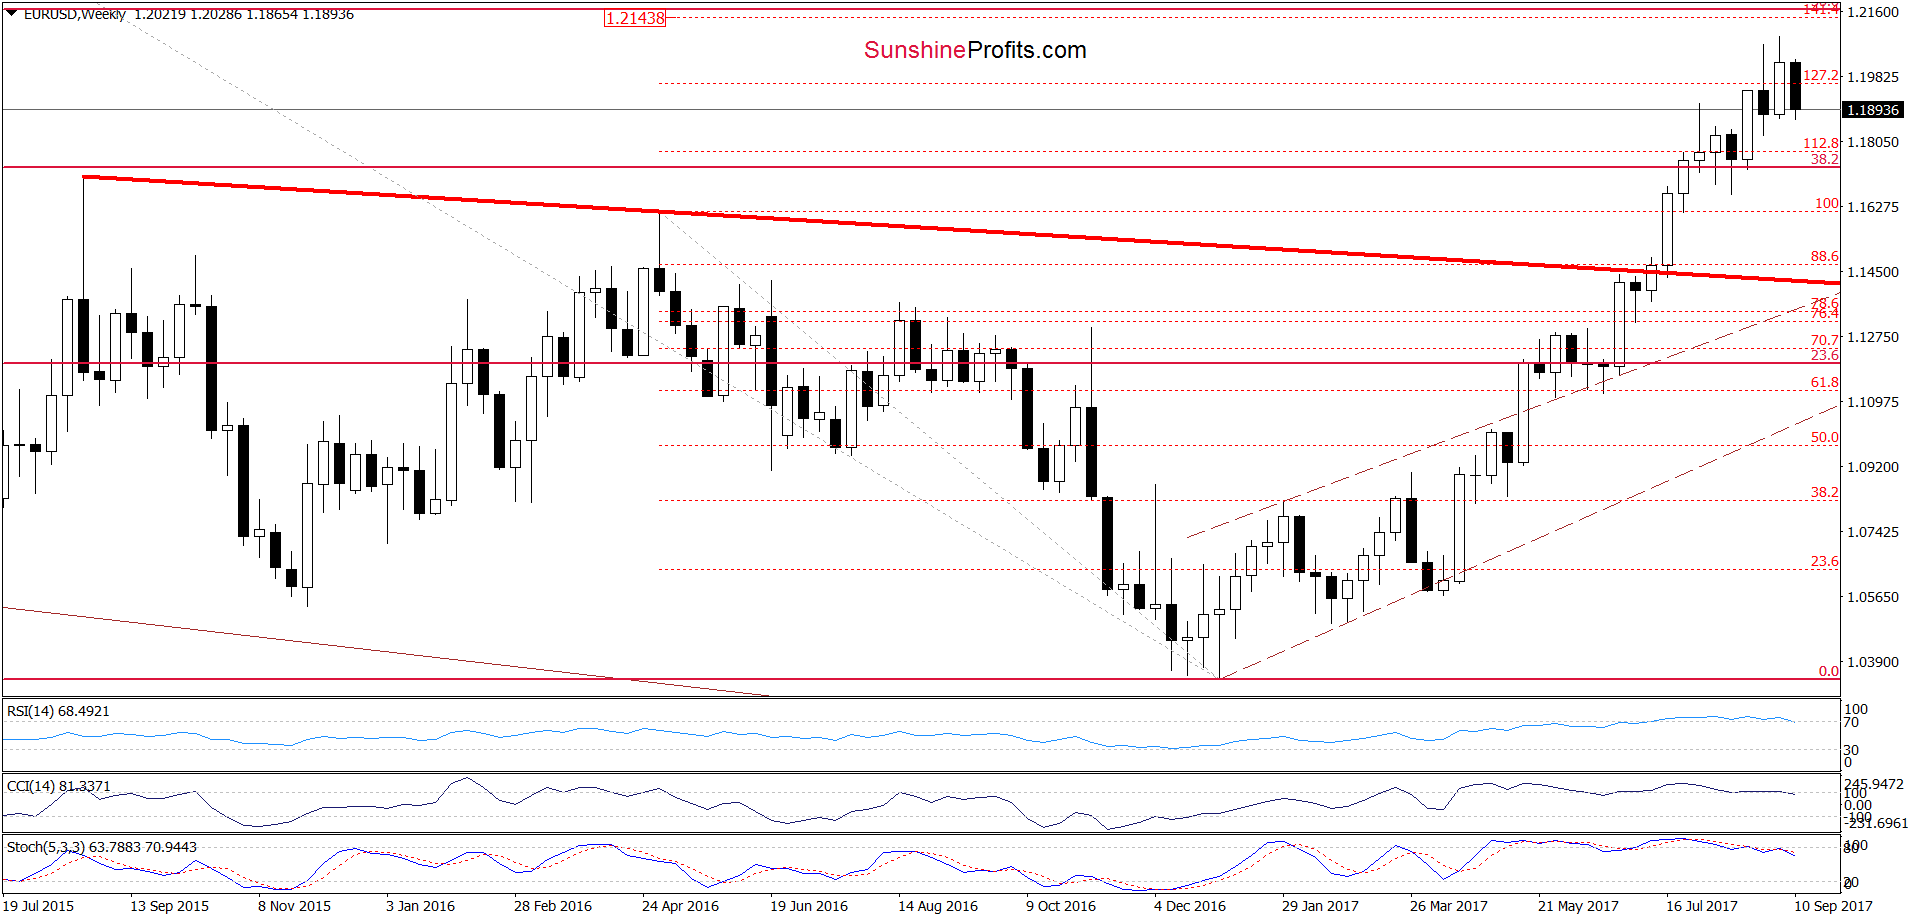
(…) on the long-term chart, we see that EUR/USD is still trading in the orange resistance zone. Additionally, indicators increased to the highest levels since April 2014. Back then, such high readings of the CCI and Stochastic Oscillator preceded bigger move to the downside, which suggests that we may see a similar price action in the coming week(s).
(…) on the medium-term chart (….), we can see that the CCI and Stochastic Oscillator already generated the sell signals, supporting currency bears. (…) we also see that the exchange rate is quite close to invalidating the earlier breakout above the 127.2% Fibonacci extension.
On top of that, (…), EUR/USD slipped below the upper border of the brown rising trend channel, invalidating the earlier breakout.
(…) the pair rebounded slightly, but taking into account all the above-mentioned factors and the sell signals generated by the daily indicators, we think that it’s nothing more than a verification of yesterday’s breakdown. If this is the case, we’ll see reversal and further deterioration in the very near future.
From today’s point of view, we see that the situation developed in line with the above scenario and EUR/USD declined after the verification of the earlier breakdown under the upper border of the brown rising trend channel marked on the daily chart. Thanks to yesterday’s drop the pair also slipped below the early August high and the 127.1% Fibonacci extension, invalidating the breakouts (additional bearish developments). Taking these facts into account and combining them with the current position of the monthly weekly and daily indicators, we believe that further deterioration is just around the corner. Therefore, if the pair extends losses from today’s levels, the next target for currency bears will be the lower border of the brown rising trend channel (currently around 1.1810). If this support is broken, the way to lower levels will be open.
Very short-term outlook: bearish
Short-term outlook: mixed with bearish bias
MT outlook: mixed
LT outlook: mixed
GBP/USD
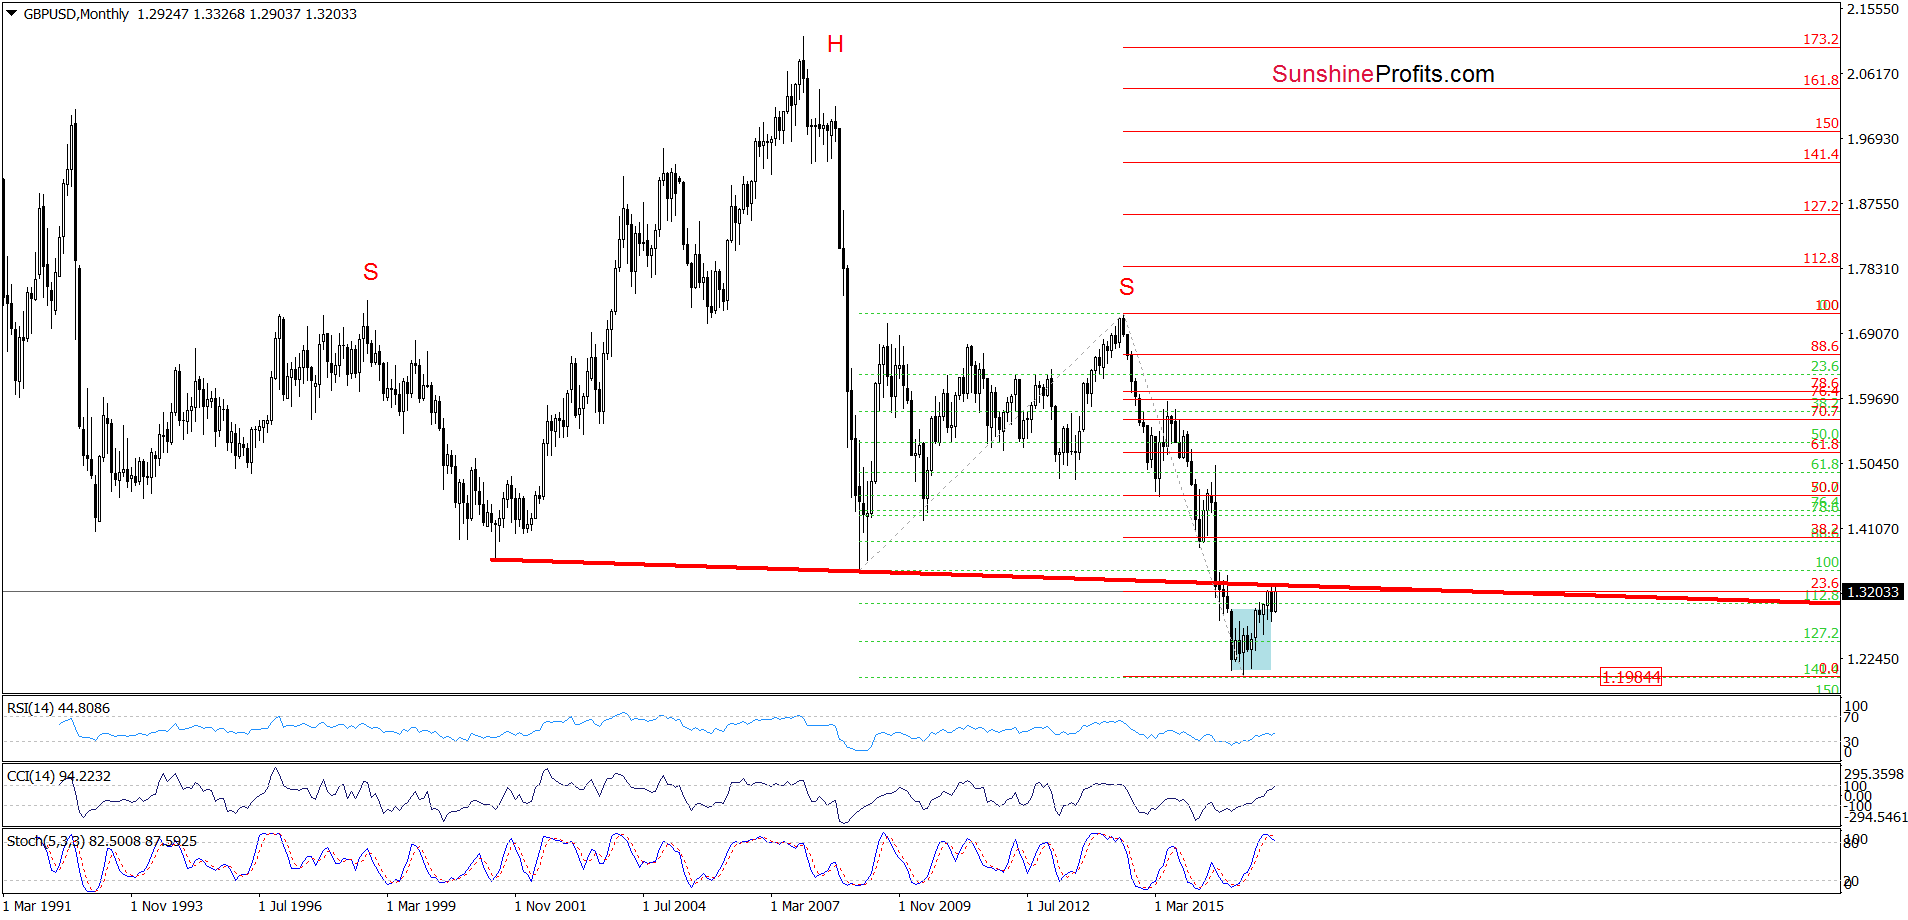
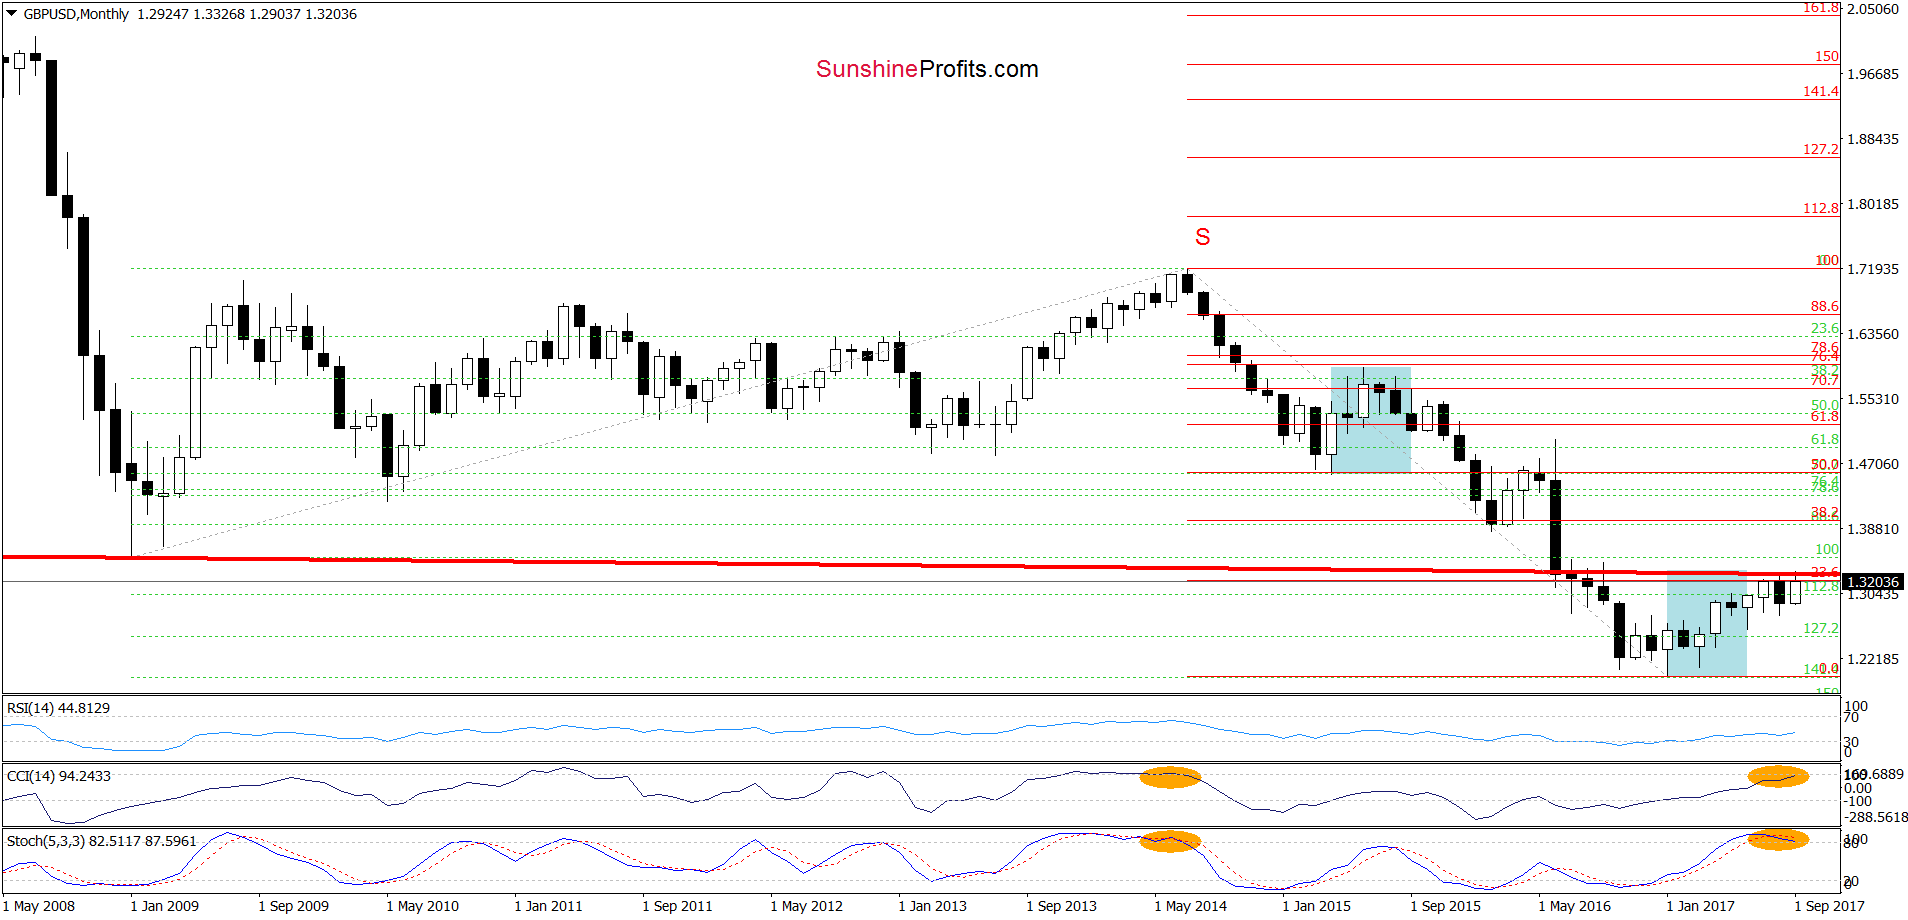
Looking at the monthly chart of GBP/USD, we see that the pair increased to the 23.6% Fibonacci retracement based on the entire July 2014-January 2017 downward move and the previously-broken neck line of the long-term head and shoulders formation once again. As you see the combination of these resistances was strong enough to stop currency bulls in the previous month, which suggest that reversal is just around the corner.
Additionally, the CCI and the Stochastic Oscillator increased to the highest levels since July 2014. Back then, such high readings of the indicators preceded sizable declines, which suggest that we may see similar price action in the following month(s).
On top of that, when we compare the size of blue corrections, we clearly see that they are almost equal, which means that currently currency bulls are not stronger than they were between April and June 2015. In our opinion, this fact also increases the probability of another attempt to move lower.
Are there any other negative factors on the horizon, which could encourage currency bears to act? Let’s examine the daily chart and find out.
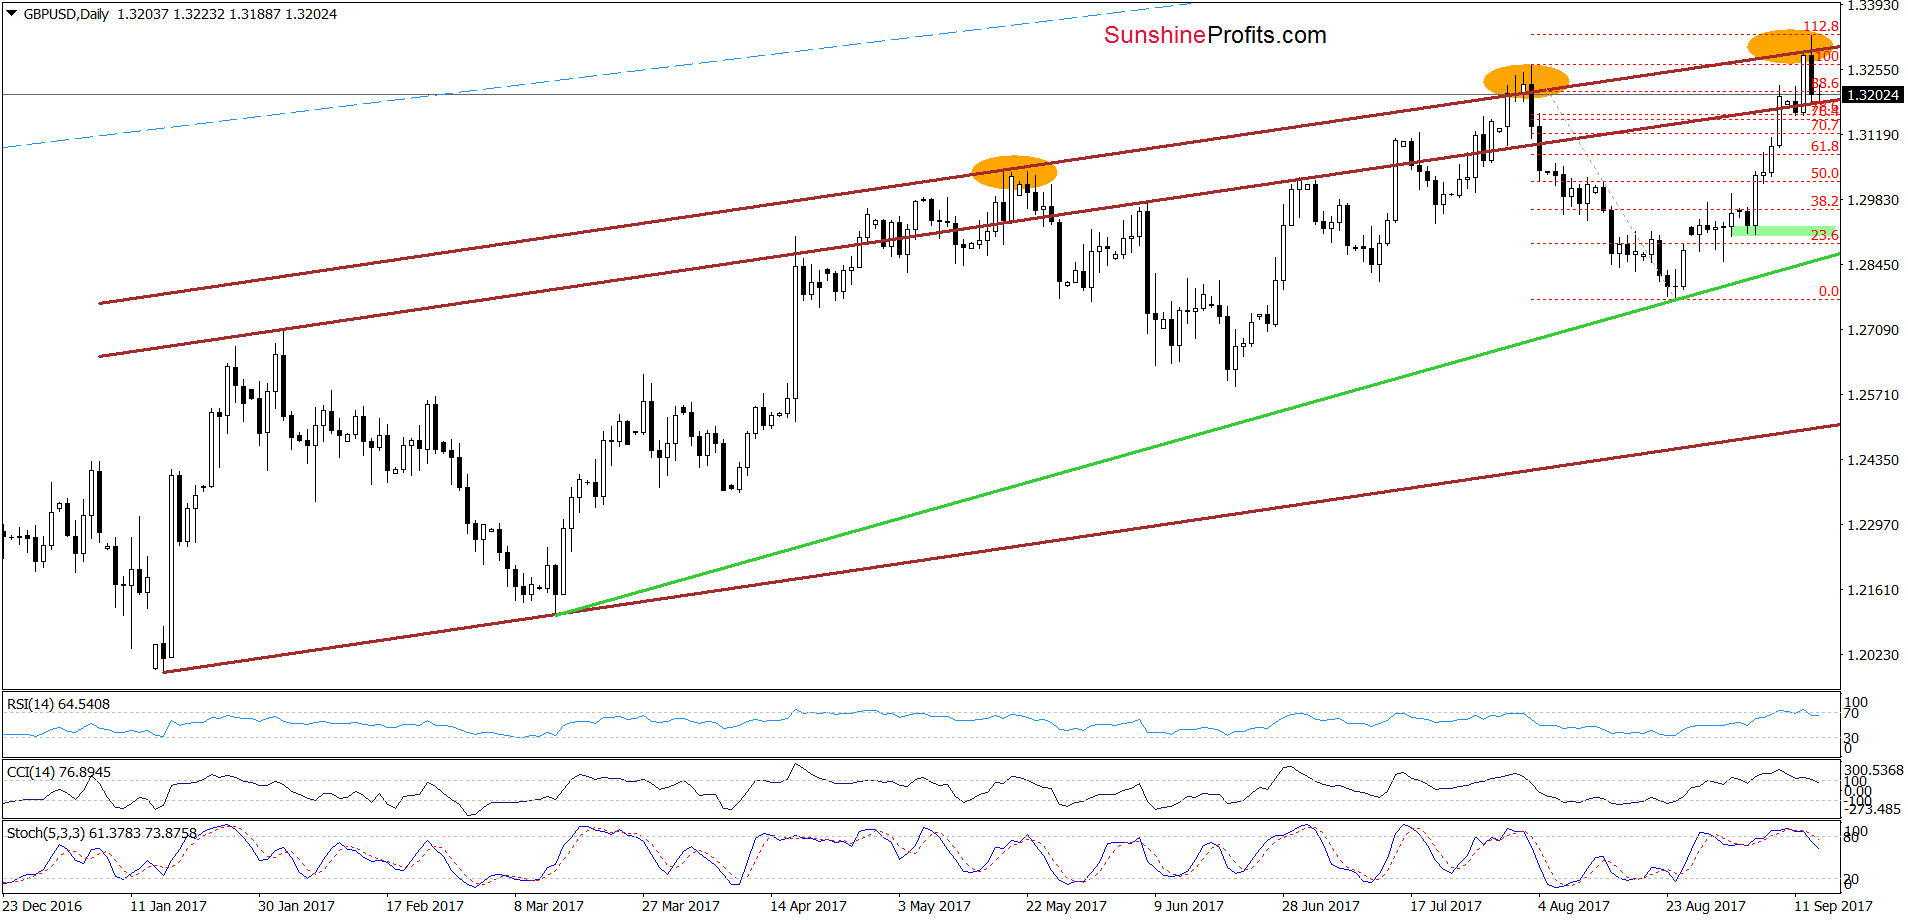
From the very short-term perspective, we see that GBP/USD increased to the upper brown resistance line (parallel to the upper border of the brown rising trend channel) once again. As you see this important resistance was strong enough to stop increases in May, August and also earlier this week, which suggests that we’ll see further deterioration in the coming days (similarly to what we saw in previous cases). Additionally, all daily indicators generated the sell signals, giving currency bears another reason to act.
How low could the pair go? In our opinion, if GBP/USD breaks below the upper border of the brown rising trend channel, we’ll see at least a drop to the green support line based on the mid-March and August lows in the following days.
Very short-term outlook: bearish
Short-term outlook: mixed with bearish bias
MT outlook: mixed with bearish bias
LT outlook: mixed
USD/CAD
On Tuesday, we wrote the following:
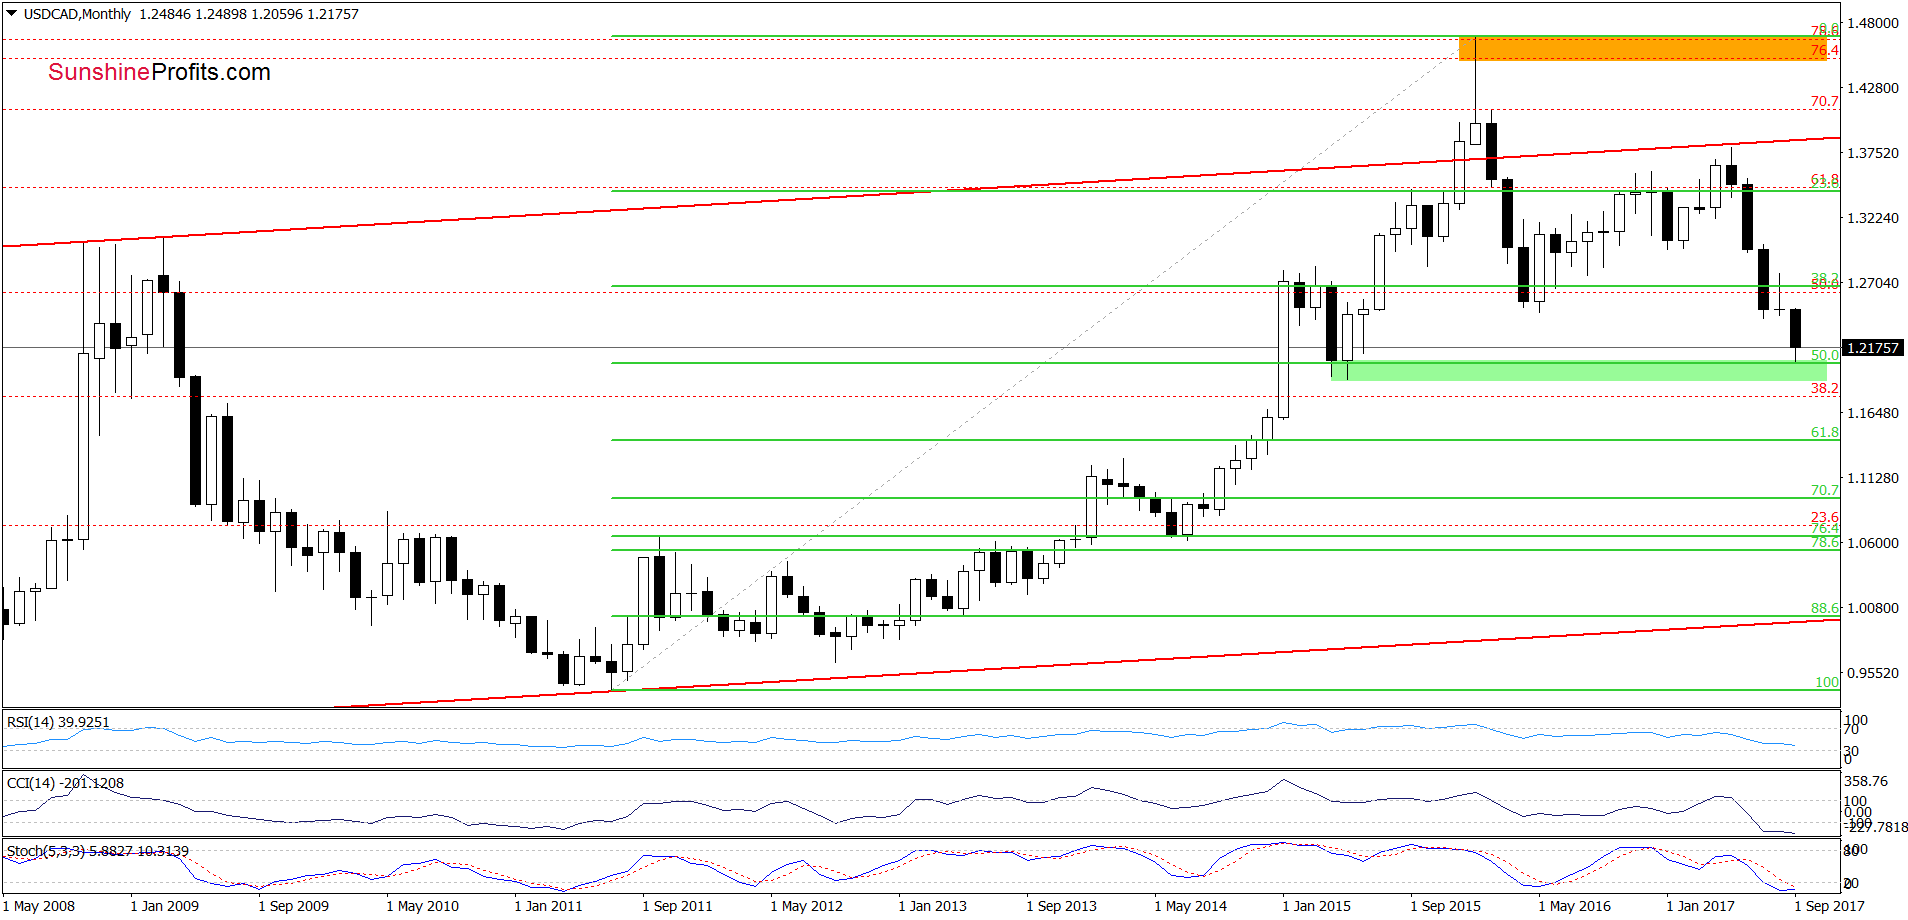
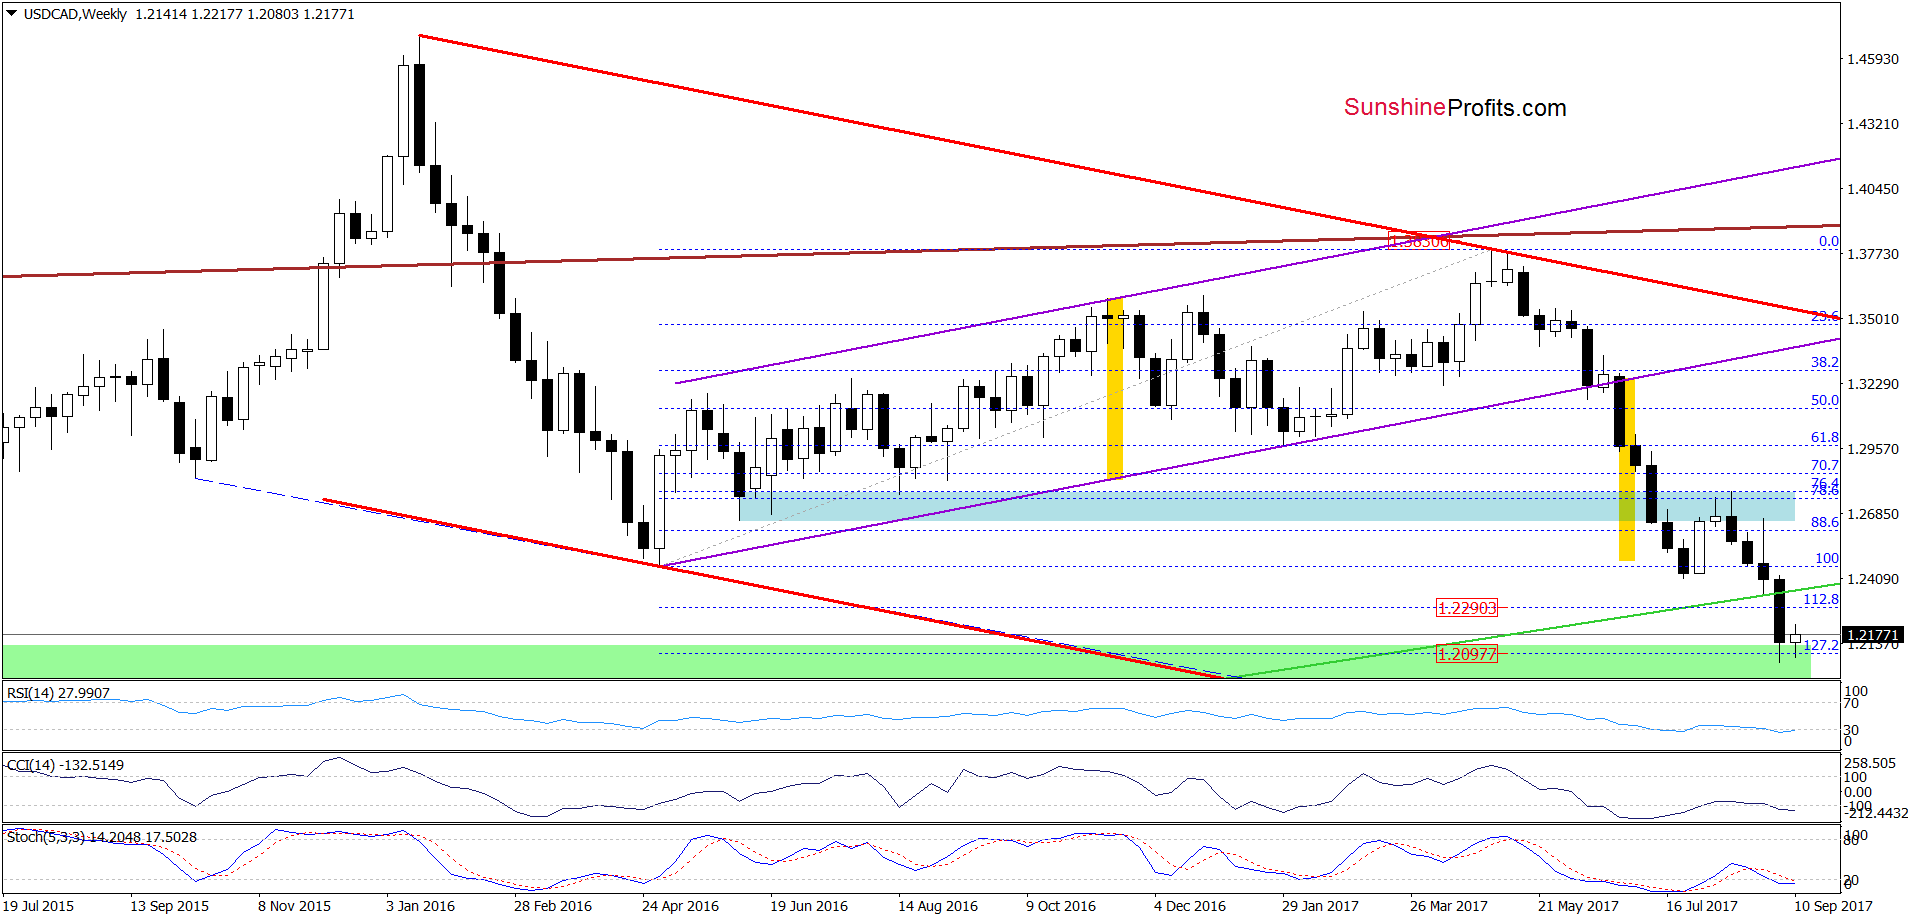
(…) although USD/CAD hit a fresh 2017 low in the previous week, the pair is still trading around the upper border of the green support zone (created by the 127.2% Fibonacci extension), which could stop currency bears in the coming week – especially when take into account the 50% Fibonacci retracement (based on the entire 2011-2016 upward move) marked on the long-term chart (…)
On the charts, we see that the above-mentioned support zone encouraged currency bulls to act (as we had expected), which resulted in a small (from the long- and medium-term perspective) rebound.
How did this move affect the very short-term picture of USD/CAD? Let’s check.
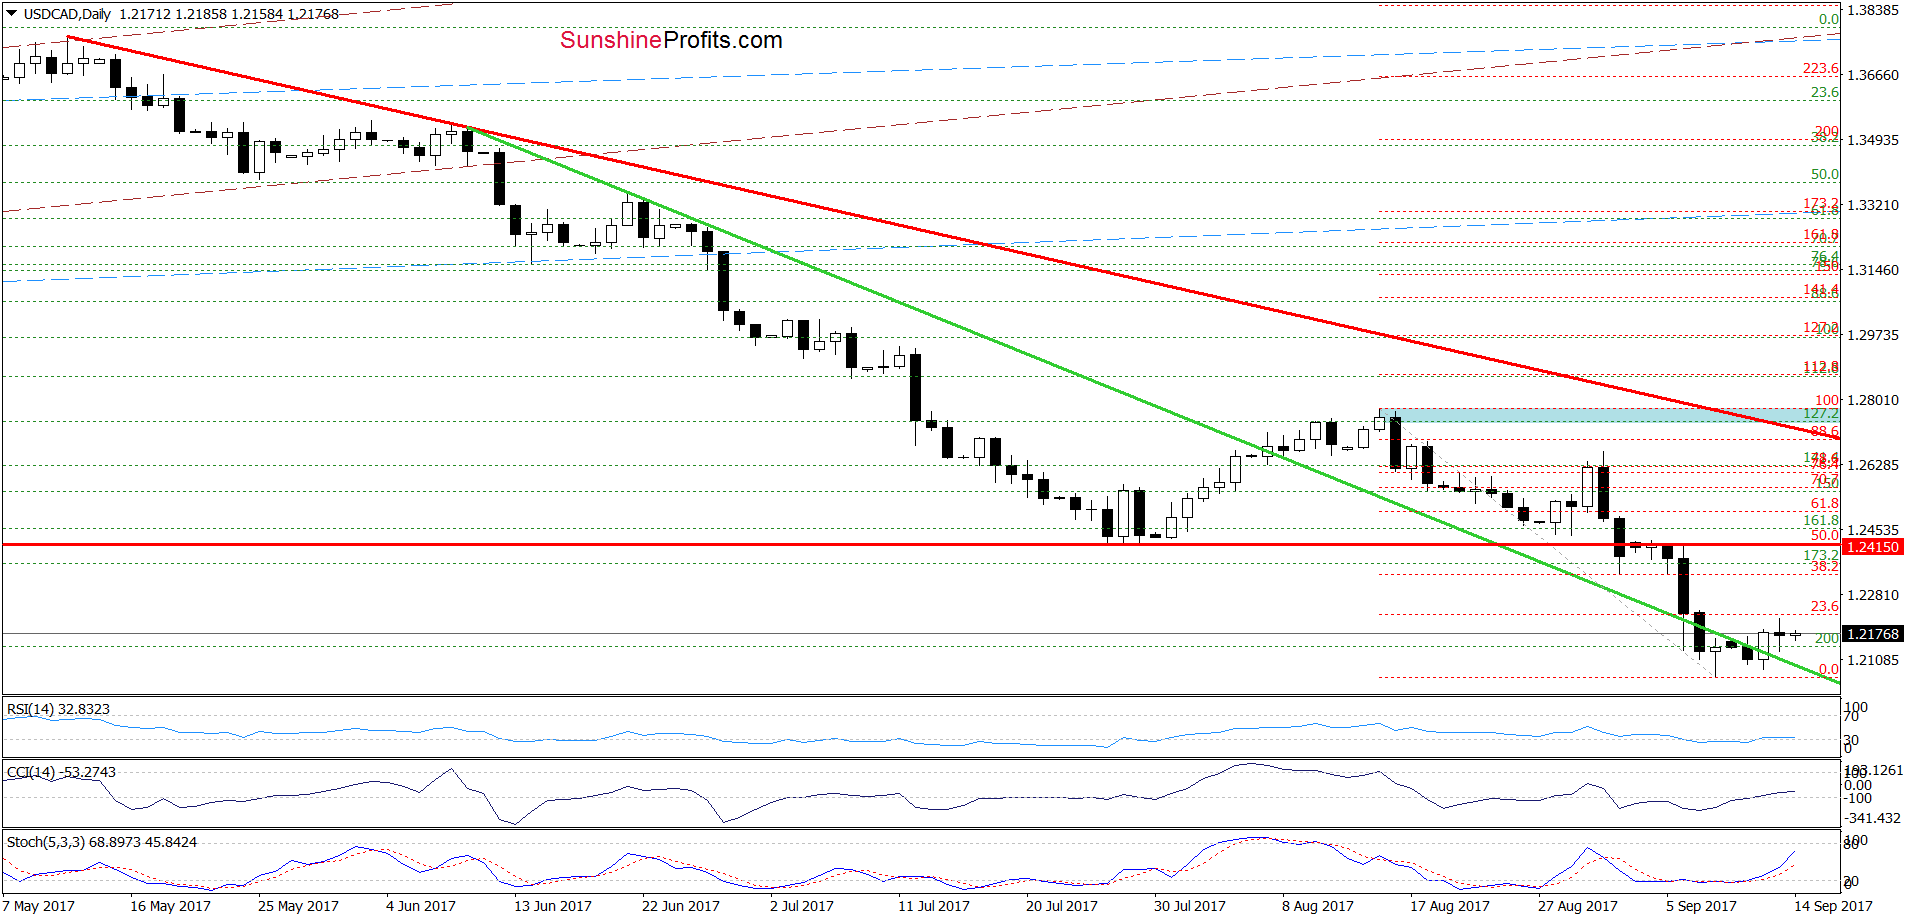
Looking at the daily chart, we see that USD/CAD climbed above the green support line and the 200% Fibonacci extension, invalidating the earlier breakdown. Additionally, the RSI, the CCI and the Stochastic Oscillator generated buy signals, suggesting further improvement.
If this is the case and the exchange rate extends gains from current levels, we’ll see an increase to the 38.2% Fibonacci retracement (based on the mid-August-September declines) or even to the red horizontal resistance line based on the July lows and the 50% retracement in the coming days.
Very short-term outlook: mixed with bullish bias
Short-term outlook: mixed with bullish bias
MT outlook: mixed
LT outlook: mixed
USD/CHF
Quoting our Tuesday alert:
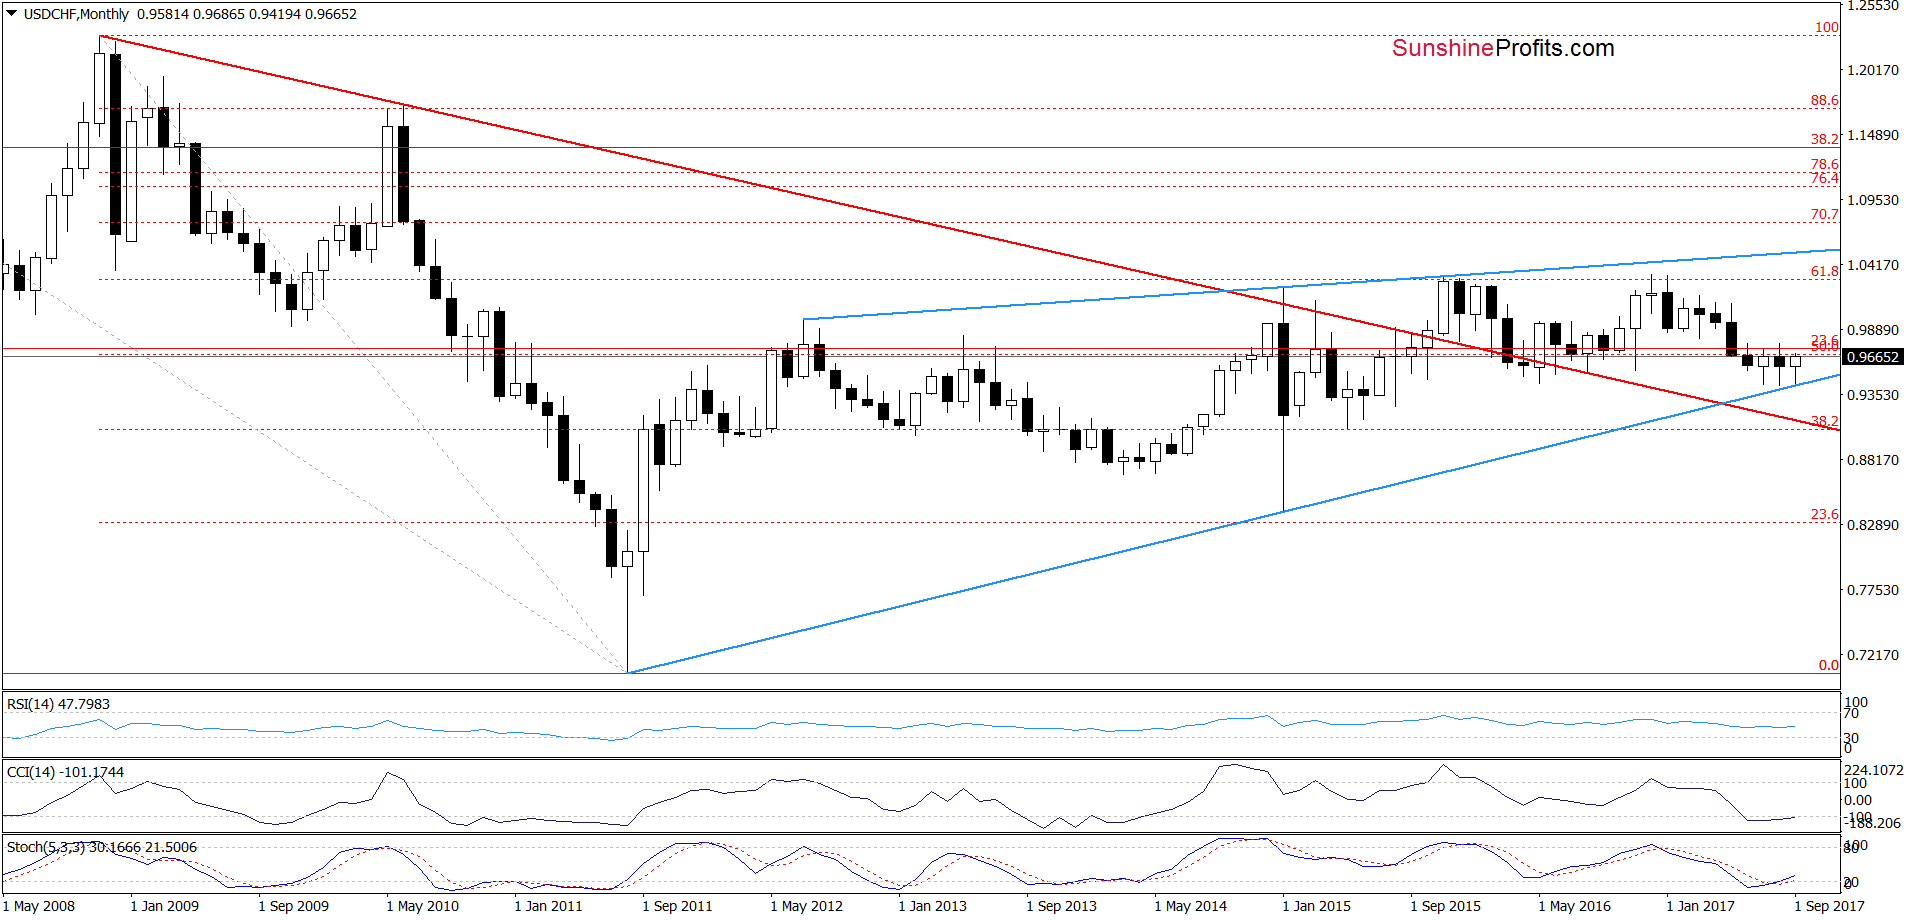
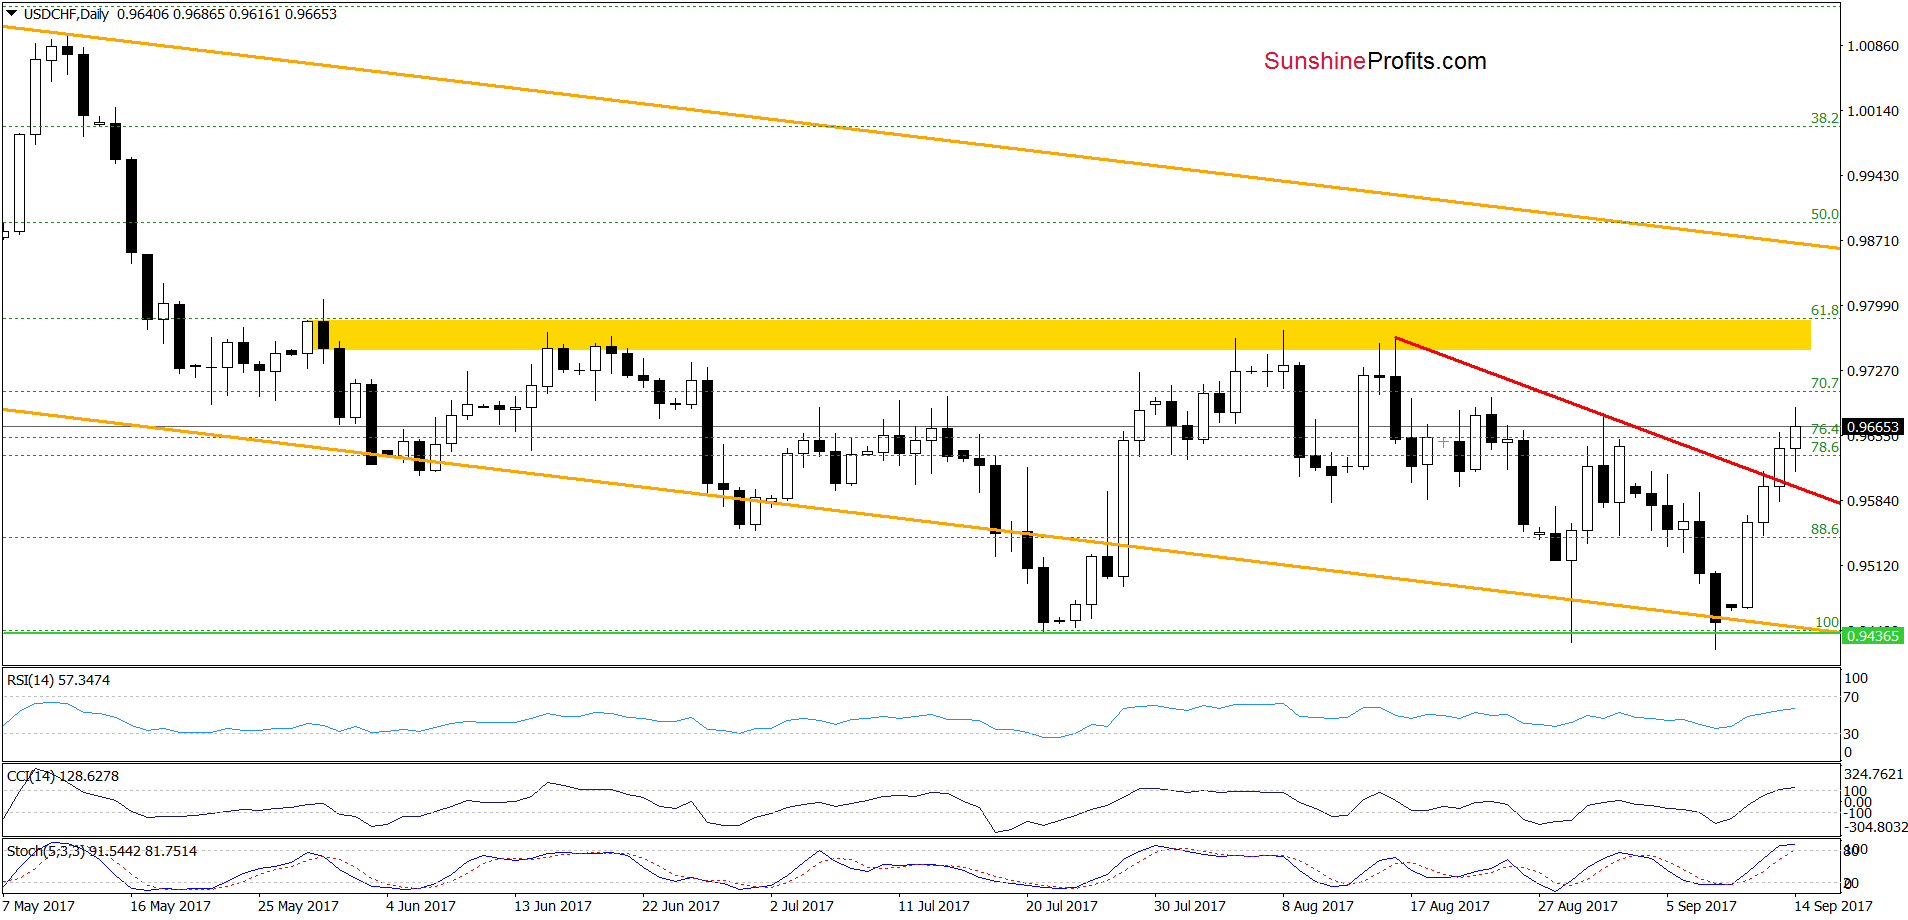
(…) USD/CHF bounced off the long-term blue rising support line seen on the monthly chart, invalidating the earlier small breakdown below the lower border of the orange declining trend channel. Taking this positive event into account and combining it with the buy signals generated by the daily (and even monthly) indicators, we think that further improvement is just around the corner. If this is the case and the pair increases from current levels, the initial upside target will be the yellow resistance zone seen on the daily chart (around 0.9751-0.9781).
From today’s point of view, we see that USD/CHF broke above the red declining resistance line based on the previous highs, which together with buy signals generated by the indictors (they are still in play) suggests that we’ll see realization of our Tuesday scenario in the coming days.
Very short-term outlook: mixed with bullish bias
Short-term outlook: mixed with bullish bias
MT outlook: mixed
LT outlook: mixed
Naturally, the above could change in the coming days and we’ll keep our subscribers informed, but that’s what appears likely based on the data that we have right now. If you enjoyed reading our analysis, we encourage you to subscribe to our daily Forex Trading Alerts.
Thank you.
Nadia Simmons
Forex & Oil Trading Strategist
Przemyslaw Radomski, CFA
Founder, Editor-in-chief, Gold & Silver Fund Manager

 For the first time since we’ve been keeping track, two separate Category 4 hurricanes struck the mainland U.S. in the same year. It should come as no surprise, then, that the combined recovery cost of Hurricanes Harvey and Irma is expected to set a new all-time high for natural disasters. AccuWeather estimates the total economic impact to top out at a whopping $290 billion, or 1.5 percent of national GDP.
With parts of Southeast Texas, Louisiana and Florida seeing significant damage, many fixed-income investors might be wondering about credit risk and local municipal bond issuers’ ability to pay interest on time. If school districts, hospitals, highway authorities and other issuers must pay for repairs, how can they afford to service their bondholders?
It’s a reasonable concern, one that nearly always arises in the days following a major catastrophe. But the concern might be unwarranted, if the past is any indication.
Lessons from Hurricane Katrina
According to credit ratings firm Moody’s Investors Service, natural disasters have not been the cause of a single default in U.S. muni bond history. Even Hurricane Katrina, responsible for a then-unprecedented $120 billion in damages, wasn’t enough to cause New Orleans to renege on its debt obligations.
The reason for this is that the affected areas normally receive substantial disaster relief from both the federal and state governments. Congress appropriated tens of billions of dollars in aid following Hurricanes Katrina and Sandy, and this year it’s already approved an initial payment of $7.85 billion. Combined with flood insurance proceeds, this has often been enough to keep municipalities solvent and day-to-day operations running.
“FEMA aid (often 75 percent or more of disaster-related costs) and flood insurance can go a long way in mitigating financial strain in the medium term,” wrote Lindsay Wilhelm, senior vice president of municipal credit research at Raymond James, in a note last week.
Texas and Florida Have Investment-Grade Credit Ratings
It’s also important to keep in mind the sheer size of Houston’s economy and its impeccable credit-worthiness. As I shared with you in a previous Frank Talk, the Texas city had a gross domestic product (GDP) of roughly $503 billion as of 2015, which is equivalent to the size of Sweden’s economy. This puts Houston, the fourth-largest city in the U.S., in a better position to handle a hurricane’s devastating aftermath than New Orleans, which had a GDP of between $69 billion and $72 billion at the time of Hurricane Katrina, according to the Federal Reserve Bank of Atlanta.
The 18 Texas counties that the Federal Emergency Management Agency (FEMA) declared a disaster all have strong, investment-grade credit ratings from Moody’s and/or Standard & Poor’s. Highest among them is Harris County, where Houston is located, which currently has the highest-possible ratings of Aaa from Moody’s and AAA from S&P. This allows it to issue debt relatively easily, which it will likely need to do more of in the years and possibly decades to come.
In addition, the State of Texas has the highest ratings possible from both firms, while Florida has a rating of Aa1 from Moody’s and AAA from S&P.
It’s too early to tell if we’ll see any credit downgrades in the wake of Harvey and Irma, but for now, I don’t expect any major changes.
Munis an Important Part of Your Portfolio
The $3.8 trillion muni market remains one of the most dependable ways U.S. cities, counties and states finance infrastructure development, and since 1913, muni investors have enjoyed tax-free income at the federal and often state level.
This becomes increasingly more desirable as you reach retirement-age and beyond. Munis might not be as sexy as tech stocks, but they have a long-standing history of performing well in volatile times,especially when those munis are investment-grade and shorter-duration.
All opinions expressed and data provided are subject to change without notice. Some of these opinions may not be appropriate to every investor. By clicking the link(s) above, you will be directed to a third-party website(s). U.S. Global Investors does not endorse all information supplied by this/these website(s) and is not responsible for its/their content.
A bond’s credit quality is determined by private independent rating agencies such as Standard & Poor’s, Moody’s and Fitch. Credit quality designations range from high (AAA to AA) to medium (A to BBB) to low (BB, B, CCC, CC to C).

 And “The Donald” said: “Open the floodgates!”
And the floodgates opened.
Less than 48 hours after Congress approved his debt ceiling suspension, more than $300 billion had flooded in.
That is the amount by which the U.S. national debt increased on Friday, September 8. By $317 billion, to be exact.
And “The Donald” said:
“It’s good.”
Tide of Debt
And it is good, but only if you are a zombie or a crony or a Deep State grifter.
The rest of us better get out our high waders and pool floats. This flood is going to drench us all.
“Deficits don’t matter,” said Dick Cheney.
Since the Reagan era, Republicans as well as Democrats have been ready to borrow money. But never, ever, did they borrow so much so fast as they did on Friday.
The feds needed cash… and they needed it fast.
So the floodgates opened. And now they are wide open… with no plausible way to close them.
The president and Congress are ready to borrow as though there were no tomorrow.
In comes a tide of debt, splashing over the sandbags put up by the old conservatives, sloshing through our banks and financial institutions, and coming to rest in the fetid waters of The Swamp.
Deficits DO Matter
If there were no tomorrow, Mr. Cheney would be right.
Why not eat tomorrow’s “seed corn” today?
There would be no reason not to reach for another dessert… or park your car in a handicapped space and tell your boss exactly what you think of him.
The trouble is there is a tomorrow. And tomorrow is when a drinking binge turns into a hangover… a bad marriage turns into a divorce… and your boss fires you.
Tomorrow is when deficits DO matter.
Yesterday, our subject was tomorrow’s political world… as “The Donald” creates his new Trumpismo movement.
Today, we look at tomorrow’s money world…
We don’t know exactly what will happen… or when. But we know the world still turns. Every boom not supported by real savings and real increases in output is phony. Tomorrow is when you find out.
Great Betrayal
Today’s prosperity, such as it is, was built on fake money, fake savings, and fake signals from the Fed.
The feds have pumped $37 trillion in “excess credit” – above and beyond the traditional relationship between debt and GDP – into the system over the last 30 years.
And now, the economy – especially the parasitic half of it run by the Deep State – depends on more and more fake money and fake credit.
That’s the one thing Republicans, Democrats, and Trumpistas agree on – nothing will be allowed to get in the way of the fake-money flow.
With the sluices open, the debt will rise. How much?
No one knows.
Credit expert Richard Duncan, who runs the Macro Watch advisory service, believes it could increase another $19 trillion before the U.S. is as deeply in debt as Japan.
Maybe.
All we know for sure is that, with nothing to stop it, you can expect it to keep going up – until the whole economy drowns in it.
That is the real meaning of Trumpismo and the Great Debt Ceiling Betrayal.
The wash of credit will continue. More spending. More debt. More mischief. More claptrap. More swindles by more scoundrels. No turning back.
Final Act
In short, this is what we’ve seen coming for the last 15 years…
Empires do not back up. The institutions that were meant to restrain them – a constitution, a bill of rights, voters, a debt ceiling – are abolished, ignored, or reshaped so the farce can continue to its final act.
Now, Congress blithers impotently. Politicians plot and connive. Deep State apparatchiks gather more power. Corporate insiders jig the figures and rig the game.
And more and more win-lose deals mean fewer and fewer win-win deals.
At some point, though, the gods stop laughing… and tomorrow comes.
Markets crash. And all the feds’ money… and all the feds’ men… can’t put them back together again. The insiders can control many things… but not everything.
Japan’s stock market took a dive 27 years ago. Investors are still down nearly 80% – more than a quarter of a century later – despite a flood tide of credit that increased government debt from 60% of GDP in 1990 to 250% today.
More to come… including what it will mean for America when the feds try to control the money system…
Regards,
Bill
Market Insight: Movie Theaters Take a Beating
Now is not a great time to be in the movie theater business.
As Bill mentioned last week, this past Labor Day weekend was the worst in terms of box office sales in nearly 20 years.
Meanwhile, the “Netflix effect” is stealing eyeballs from big movie theater companies such as AMC Entertainment Holdings and IMAX.
Today’s chart tracks the performance of shares in AMC, IMAX, and Netflix since September 2014.
 |
As you can see, over that time, AMC is down 42%… IMAX is down 29%… and Netflix is up 172%.
– Chris Lowe

Double Click Image for the Whole Story in Graphics
Complex systems are all around us.
By one definition, a complex system is any system that features a large number of interacting components (agents, processes, etc.) whose aggregate activity is nonlinear (not derivable from the summations of the activity of individual components) and typically exhibits hierarchical self-organization under selective pressures.
In today’s infographic from Meraglim we use accumulating snow and an impending avalanche as an example of a complex system – but really, such systems can be found everywhere. Weather is another complex system, and ebb and flow of populations is another example.
MARKETS ARE COMPLEX SYSTEMS
Just like in the avalanche example, where various factors at the top of a mountain (accumulating volumes of snow, weather, temperature, geology, gravity, etc.) make up a complex system that is difficult to predict, markets are similarly complex.
In fact, markets meet all the properties of complex systems, as outlined by scientists:
1. Diverse
System actors have different points of view. (i.e. bullish, bearish, long, short, leveraged, non-leveraged, etc.)
2. Connected
Capital markets are over-connected, and information spreads fast. (i.e. chat rooms, phone calls, emails, Thomson Reuters, Dow Jones, Bloomberg, trading systems, order entry systems, etc.)
3. Interaction
Trillions of dollars of securities are exchanged in transactions every day (i.e. stocks, bonds, currencies, derivatives, etc.)
4. Adaptive Behavior
Actors change their behavior based on the signals they are getting (i.e. making or losing money, etc.)
And like the avalanche example, where a single snowflake can trigger a much bigger event, there are increasing signs that the complexity behind the stock market has also reached a critical state.
MARKETS IN A CRITICAL STATE
Here are just some examples that show how the market has entered into an increasingly critical state:
Record-Low Volatility
The VIX, an index that aims to measure the volatility of the market, hit all-time lows this summer.
Bull Market Length
Meanwhile, the current bull market (2009-present) is the second-longest bull market in modern history at 3,109 days. The only bull market that was longer went from the 1987 crash to the Dot-com bust.
Valuations at Highs
Stock valuations, based on Robert Schiller’s CAPE ratio (which looks at cyclically-adjusted price-to-earnings), are approaching all-time highs as well. Right now, it sits 83.3% higher than the historical mean of 16.8. It was only higher in 1929 and 2000, right before big crashes occurred.
Market Goes Up
Investor overconfidence leads investors to believe the market only goes up, and never goes down. Indeed, in this bull market, markets have gone up 67 of the months (an average gain of 3.3%), and have gone down only 34 months (average drop of -2.6%).
Here are some additional signs of systemic risk that make complex markets less stable:
- A densely connected network of bank obligations and liabilities
- Over $70 trillion in debt added since Financial Crisis
- Over $1 quadrillion in notional value of derivatives
- Non-bank shadow finance through hedge funds and securitization make risk impossible to measure
- Increased leverage of banks in some markets
- Greater concentration of financial assets in fewer companies
In other words, there are legitimate reasons to be concerned about “snow” accumulation – and any such “snowflake” could trigger the avalanche.
In complex dynamic systems that reach the critical state, the most catastrophic event that can occur is an exponential function of scale. This means that if you double the system, you do not double the risk; you increase it by a factor of five or 10
– Jim Rickards, author of Road to Ruin
THE NEXT SNOWFLAKE
What could trigger the next avalanche? It could be anything, including the failure of a major bank, a natural disaster, war, a cyber-financial attack, or any other significant event.
Such “snowflakes” come around every few years:
1987: Black Monday
The Dow fell 508 points (-22.6%) in one day.
1994-95: The Mexican peso crisis
Systemic collapse narrowly avoided when the U.S. government bailed out Mexico using the controversial $20 billion “Exchange Stabilization Fund”.
1997: Asian financial crisis
East Asian currencies fell in value by as much as -38%, and international stocks by as much as -60%.
1998: Long Term Capital Management
Hedge fund LTCM was in extreme distress, and within hours of shutting down every market in the world.
2000: The Dotcom crash
Nasdaq fell -78% in 30 months after early Dotcom companies crashed and burned.
2008: Lehman Brothers bankruptcy
Morgan Stanley, Goldman Sachs, Bank of America, and J.P. Morgan were days away from same fate until government stepped in.
SHELTER FROM THE AVALANCHE
The Fed and mainstream economists use equilibrium theory, regressions, and correlations to quantify the markets. And while they pay lip-service to black swans, they don’t have a good way of forecasting them or predicting them.
Markets are complex – and only complexity theory and predictive analytics can help to shed light on their next move.
Alternatively, investors can seek shelter from the storm by investing in assets that cannot be digitally frozen (bank accounts, brokerage accounts, etc.) or have their value inflated away (cash, fixed-income). Such assets include land, precious metals, fine art, and private equity.
Click Image For Larger Version

 Okay, so I don’t have grandchildren yet, but I want to increase the odds you read beyond the title if you are old enough to have grandchildren. Should the investment advice we give to someone young truly be different from that given to someone old? And given where asset prices are, is it responsible to tell anyone to pile into the markets? Here are my thoughts on the topic, hopefully applicable not just for my children:
Hedge fund manager Ray Dalio likes to say he chose the first stock he ever bought because it cost less than $5 a share, given that his savings from caddying at the time were, well, five bucks. That story is a great icebreaker but also highlights with what’s wrong with our industry: when we think about investing, we immediately think about the stock market. Let’s take a step back.
My oldest recently returned back to college having completed a summer job. Thanks to our “Golden College Fund” (our kids’ college savings is in physical gold; please see this 2014 Forbes article for details), our son in the fortunate position that he doesn’t have to pay off college debt with his earnings. If he did, paying off college debt – like any other debt – is a choice of whether one expects a higher rate of return with one’s investments (after tax) than if one were to pay off the debt. It’s also a choice of risk tolerance, as a debt-free person has much less to worry about.
Talking about worrying: the advantage a college kid without debt over just about any other adult has is that he or she has no obligations, notably also no family to feed. I allege that financial stress is foremost a function of expenses, not income. As we grow older, we start piling on obligations: it starts with the indispensable mobile phone plan, might include that monthly car payment and possibly a mortgage. And if one is providing for a family, that too will take a good chunk out of the household income statement.
As such, for college students, life is comparatively simple. That said, it might be a worthy exercise for anyone in a more complex stage in their life to re-evaluate where they are. Most have “legacy” payments they make, but do you really still need that $80 a month cable TV subscription? Or, at the more expensive end of the spectrum, that vacation home that’s a money pit; should it be sold or possibly turned from an expense leader into a revenue center by making it available on Airbnb?
Have you ever noticed that if you go to a financial adviser, they’ll only recommend what they are licensed to recommend; or what their custodian can keep on their books? When it comes to investing, the first question you should ask yourself is not where to open a brokerage account, but what it is that you want to achieve. The brokerage account may merely be the means of achieving your goal.
Many say young investors can afford to invest more aggressively because they have more time to recover from market crashes; again, the emphasis is on stocks. I would like to phrase it differently: a young investor has a very high earnings potential relative to their current savings. Let’s say you make $50,000 coming out of college, with $5,000 in the bank. The way I like to look at it is that the $50,000 is a revenue stream you are getting from the investment you have made in yourself, one that’s likely to increase over time. It’s for that reason that you can be more aggressive with those $5,000. And that applies no matter what age you are: if you are an executive making hundreds of thousands, evaluate the odds of that income stream holding up, and put that into the context of your savings (which are hopefully higher at that stage in your life).
For a young person, it may be all but impossible to fill in a questionnaire about one’s target retirement age. I gather it’s difficult even for many fifty-year-olds: sure, we all dream of retiring on the beach. But many of us – I include myself here – are not dreaming of retirement: we need to keep our brains active, and the last thing we want is to become couch potatoes. Relevant for any financial planning is that in the opinion of yours truly, income derived from one’s personal labor ought to be seen as a revenue stream just like any other, with probabilities assigned as to the future course of such revenue.
If along the way, you have invested in a vacation home that you are now renting out; that is an income stream as well (net of expenses, taxes, etc.).
If one reaches the point in one’s life where one no longer wants to or is no longer able to “have a job”, well, then that income stream is cut off. Although even there, with regard to financial planning, I would like to pose the question: how healthy are you? That is, could you go back to work if you wanted or needed to? In my opinion, one you don’t often hear from financial planners, one of the better pieces of retirement investment advices is to invest in your health. If you are healthy at age 65, you have the potential to keep that revenue stream going, even if you end up choosing not to. That, in turn, improves your risk tolerance.
The beauty of one’s personal earnings power is that one can control it far better than an investment one buys with the push of a button. When you buy that hot internet company, you have no control over management (with some firms there aren’t even voting rights associated). My personal view is that the riskier an investment, the more involved you want to be. For example, to make money in frontier markets, don’t be surprised if you lose your shirt if you give someone else your money to manage; a more profitable strategy may be to roll up your sleeves and get a job working there? No, it’s not unrealistic, especially not if you are young. Isn’t it all about “experiences” for the young generation? Well, here’s your chance!
Instead, your friendly financial planner will ask you about your risk/return profile. What the heck does that mean? We all know how much upside risk we can tolerate (an infinite amount?!), but who understands the abstract notion of downside risk? Investors start to appreciate these concepts as they gain experience; and “experience” means a series of setbacks, including possibly a job loss that gets one to re-evaluate those expectations of ever higher salaries.
The concept of risk goes far beyond the standard deviation of a return stream of a security. The risk any investor faces is that the net present value of their expected future cash flows falls below a comfort level, taking into account not all investments are liquid (either because they are difficult to sell or one doesn’t want to sell, such as possibly one’s home). Here, college kids have a lot in common with the wealthy: they can go several years without income. A good time to start one’s own business may well be when one is young, as one doesn’t have to worry about dependents. It is more stressful (the risk is higher) to start a business if one has to support a family at the same time. Entrepreneurs in their 30s and 40s might have more experience, reducing the anxiety level as their odds of success increase. Yet there are successful entrepreneurs that started only in their 50s or later; the kids are usually out of the house; and they have few other obligations, so they can go all in to focus on that business armed with decades of experience.
The biggest investment we possibly make is in our own training. Another life choice investment is that of who one shares one’s life with. I’m not suggesting ‘investors’ should marry for wealth, but marriage will have an impact on one’s financial stability. Independent of whether there are one or two breadwinners in a household, a frugal spouse will reduce financial stress; also, a broken marriage can put a serious dent into anyone’s financial planning.
When we buy a gadget, many of us spend hours surveying the market until we are comfortable we are getting value for money. We should do the same with any investment. Just because we can buy something with the click of a button doesn’t mean we shouldn’t take our time before taking action.
In my view, a hallmark of successful investors is that they understand the market they are in. For the very young entrepreneur, it might be that lemonade stand. When I was in college, I bought a washing machine that I rented out to my housemates in off campus housing (great return on investment!). In the stock market, this might be as simple as buying shares in the Coca-Cola Company because they think their drinks are a good cash cow (this isn’t investment advice). But what I have a problem with is to invest in something simply because “everyone else” says it’s a good investment, even if it’s something as “obvious” as tech stocks in the late nineties or real estate in 2005.
Gradually shifting towards the markets, I do not think there’s a unique right approach. But what I think successful approaches have in common is that there’s a process. And the process is more than signing up with a robo-advisor. Don’t get me wrong: there is value in automated re-allocation, and we’ll see it transform the industry, but the first generation of rob-advisors still has some maturing to do.
Whatever we invest in, once we make the investment, the temptation is to justify the investment even as the reasons for the initial investment has changed. A prime example is one’s primary residence. Many perceive their own home to be of great value, even if prices in the neighborhood have moved to ridiculous levels. Or take that stock you purchased; you don’t want to admit you made a mistake as the price moves against you. It gets back to process; it’s also usually best to recall why you purchased something in the first place; if those conditions are no longer met, do you make the data fit the story, i.e. are you merely justifying past decisions? That’s where starting with a clean slate is a great advantage. That said, any sixty-year old investor can go through the same exercise: if I didn’t own xyz, would I buy it today? Okay, do take into account that you might have to pay substantial taxes if you liquidated an investment, does xyz make sense in your asset allocation? If not, you may have put enough money aside so that you can afford to keep a pet project around, but at least be honest about it.
Talking about pet projects: investing in venture capital is supposed to be about diversification, not about bragging rights. Just saying. While this jab is not aimed at the young investors, those of you it is aimed at might recognize it.
Lots of models show you that if you start investing early, it pays off big time, as compounding works in your favor. But that doesn’t mean you should invest in something stupid just for the sake of being invested. And looked at differently, back to the college graduate with $50,000 income / $5,000 in savings: in a world where the 10-year government bond trades at 2.162% (the yield as I write this), the $50,000 in income corresponds to a $2,312,673 bond (the annual payment from such bond is $50k). Looked at it from that perspective, your $5,000 in actual savings represents only 0.22% of your portfolio. It means, you will be all right if your first investment doesn’t pay off. It is okay to learn (read: make mistakes). But it’s also okay to be on the sidelines. The advantage of having your capital at risk, however, is that you are more likely to take an interest, that is, being in the trenches provides experience and perspective.
Now what about the stock market? For those who have followed me, I don’t like current valuations. I don’t like the lack of market breadth. Indeed, my personal investments have been geared towards benefiting from a risk off environment while being out of most stocks. I like gold (again, none of this is investment advice). Now, any “normal” person would say, who cares, you are trying to promote long-term investments and especially if you’re young, the stock market has shown to be a good place to be over the long-term. Maybe, but I cannot in good consciousness recommend to anyone to plug money into the stock market at this stage. Sure, reference the example above, at 0.22% of one’s investment allocation, it may be cheap learning.
Indeed, if someone says I’ll give a certain percentage to a robo adviser, I’m not going to object to it, even in the current environment: one good thing robo advisers do well is to rebalance a portfolio, a key step many investors forget. I have long preached that ‘doubling down’ in late 2008 was irresponsible for those who had not taken chips off the table during the good times (if you lose half your net worth, it is irresponsible to put more capital at risk), but may be quite appropriate for someone steadily investing and rebalancing their portfolio.
The reason I have shifted heavily into currency investments over the years is not that I’m in love with the euro (despite what some cynics say!), but that the currency market provides an avenue to generate uncorrelated returns. In an era where central banks have elevated asset prices into what might be bubble territory, and fostered capital misallocation, investors need new tools to have a robust portfolio for what may lie ahead. That doesn’t mean that college kids or sixty year olds should suddenly become currency traders, but it suggests to me we need to think beyond the traditional asset allocation. Gold comes up many times in these discussions; it’s not that gold is so much “better” than many other investments, but it’s much easier to grasp the potential diversification benefits and understand the risks of gold than of long/short equity or long/short currency strategy. However, in the same spirit of diversification, an investor should consider gold instead of or in addition to an investment in something completely different, say a storage business (I’m tempted; I have friends who have done it – tenants don’t complain and you can sell their stuff if the monthly lease payment doesn’t come). Did I mention my wife is developing a vineyard?
My goal here was not to get your portfolio into perfect shape, but to get you out of your comfort zone, to get you thinking. Let me know whether I succeeded. On the topic of gold, we have a webinar on Thursday, September 21 (click to register). If you believe this analysis might be of value to your friends, please share it with them. Follow me on LinkedIn or Twitter.
Axel Merk
President & CIO, Merk Investments
http://www.merkinvestments.com/index.php


