
Energy & Commodities
On Friday, crude oil moved sharply lower and lost over 3% after investors digested the EIA report and reacted to the increase in crude oil inventories. Thanks to these circumstances, light crude invalidated the earlier breakout above the resistance area and slipped well below $48. What does it mean for the commodity?
Crude Oil’s Technical Picture
Let’s take a closer look at the charts below (charts courtesy of http://stockcharts.com).
On Thursday, we wrote the following:
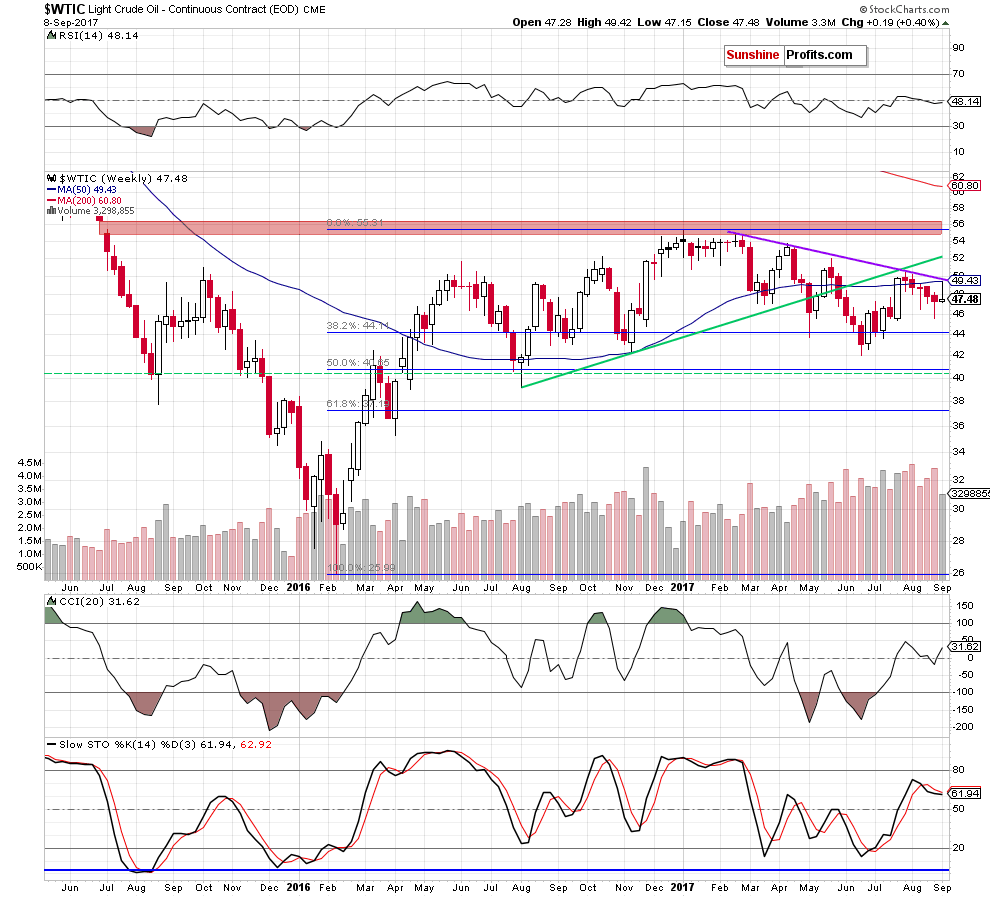
Yesterday, crude oil extended gains, but did this increase change anything? In our opinion, it didn’t. Why? As you see on the weekly chart, despite Wednesday’s move, the black gold is still trading under the purple declining resistance line based on the previous highs and the 50-week moving average, which together were strong enough to stop oil bulls in the previous months.
Additionally, the commodity increased to two important lines: the orange resistance line based on the August highs and the previously-broken lower border of the purple rising trend channel, which increases the probability of reversal – especially when we factor in the size of yesterday’s volume. (…) Wednesday’s move materialized on visibly lower volume than Tuesday’s increase, which raises some doubts about oil bulls’ strength (similarly to what we saw in mid-August).
What’s next for light crude?
(…) if the commodity increases to the lower border of the purple rising trend channel and then reverses and declines, we will see another verification of the earlier breakdown under this short-term resistance, which will give oil bears a very important reason to act in the following days.
From today’s point of view, we see that the situation developed in line with the above scenario as crude oil reversed and declined sharply on Friday. Thanks to this drop light crude created a bearish candle on the weekly chart (visibly longer upper shadow suggests a turning point), which verified the earlier breakdown below the long-term purple declining resistance line (based on the February and April highs) and the 50-week moving average once again. Taking this bearish development into account and combining it with the sell signal generated by the weekly Stochastic Oscillator, we think that further deterioration is more likely than not.
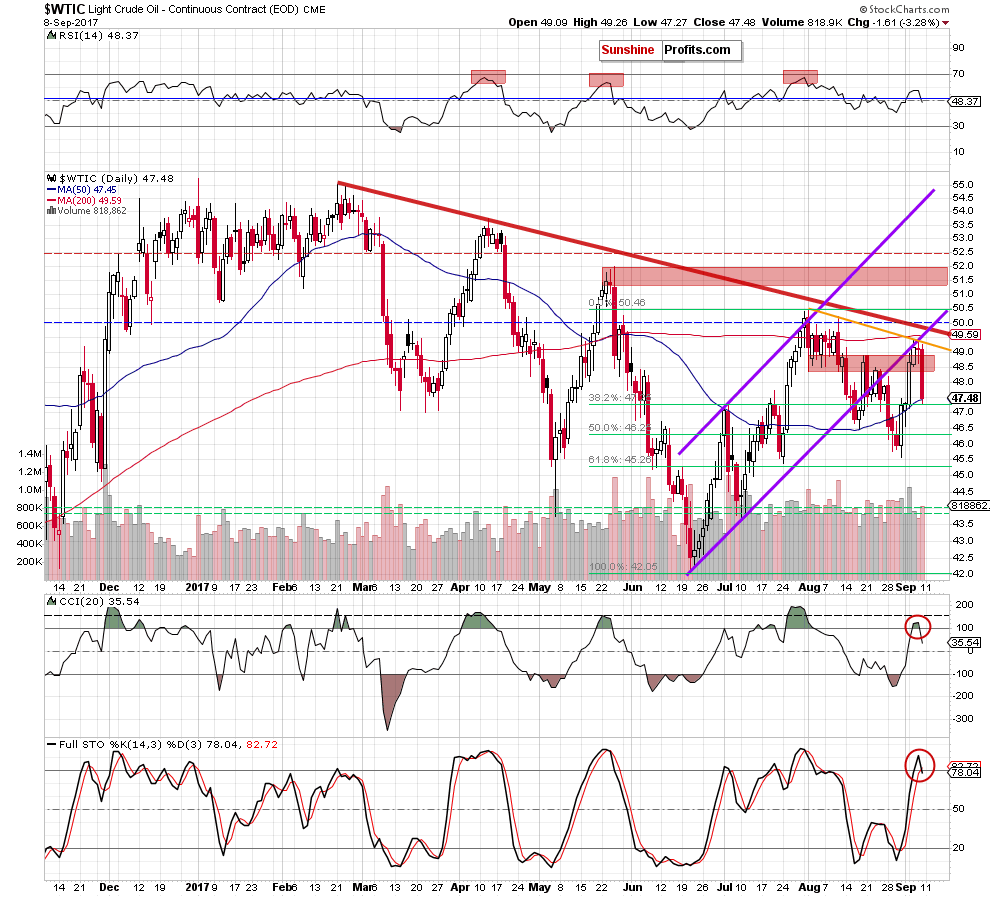
When we take a closer look at the daily chart, we can easily notice more bearish factors. As we assumed in our Thursday’s alert, crude oil reversed and declined after an increase to the lower border of the purple rising trend channel, which resulted in another verification of the earlier breakdown under this short-term resistance. Additionally, the commodity invalidated the earlier breakout above the red resistance zone and closed the day below it. On top of that, CCI and the Stochastic Oscillator generated the sell signals, supporting oil bears and further deterioration.
How low could the commodity go in the coming days?
In our opinion, if light crude declines under the Friday low of $47.27, the next downside target will the August low (around $45.58) or even the 61.8% Fibonacci retracement and the late July low (around $45.26-$45.40).
Summing up, profitable short positions continue to be justified from the risk/reward perspective as crude oil moved sharply lower after another verification of the breakdown below the medium-term purple declining resistance line based on the February and April highs, the 50-week moving average and the lower border of the purple rising trend channel. Additionally, the weekly Stochastic Oscillator and both daily indictors generated the sell signals, supporting further deterioration in the coming week.
Very short-term outlook: bearish
Short-term outlook: mixed with bearish bias
MT outlook: mixed
LT outlook: mixed
Thank you.
Nadia Simmons
Forex & Oil Trading Strategist

 The USD/CAD fell close to 1400 pips from the May 2017 highs into the July lows. In August the currency pair retraced over 350 pips topping out at 1.2777. Since the high that was struck on August 15, the USD/CAD has once again moved back under the July lows and is now trading more than 500 pips below that August 15 high.
On Wednesday, September 6, the Bank of Canada increased its benchmark interest rate to 1%. Following the announcement of this news, the USD/CAD moved lower, breaking down under a key support level at 1.2330, signaling that further follow through to the downside was likely.
Now along with the move lower in the USD/CAD, the U.S. Dollar Index (DXY) has also continued to move lower. The U.S. Dollar Index is already deep into its support zone for its potential wave 4. The USD/CAD, on the other hand, is still about 300 pips over the longer-term target zone, which comes in at the 1.1754-1.0986 area.
So, whether the USD/CAD and DXY Index will find a bottom simultaneously is still somewhat uncertain. What is more certain is that neither the DXY nor the USD/CAD have shown any signal of having formed a bottom just yet.
I have been looking for these lower levels on the USD/CAD for quite some time. In fact, ever since the pair made a large degree 5 wave move down into the May 2016 lows, I was expecting to see another large swing lower. I will note, however, that the correction from the May 2016 low into the May 2017 high took much longer than I had expected. From a price perspective, however, it has followed the pattern almost perfectly.
As noted above, the 1.2330 was a key short-term support level that I had been keeping a close eye on this week. Once that level broke to the downside, it gave us confirmation that the move down off of the August 15 high was likely to follow through down towards at least the 1.2162 level and potentially as low as the 1.1699 level.
Now that the 1.2162 support has broken, the door is open for the pair to see a fairly clear path directly down towards the 1.1699 level. We do, however, need to hold under the 1.2374-1.2238 resistance zone if we are going to see direct follow through down towards those levels. A break back above the 1.2374 level would be the initial signal that we may have formed at least a local bottom in the USD/CAD.
Although the USD/CAD has yet to reach its target zone, I am certainly becoming much more cautious to the short side continue to extend lower. With that being said, as long as the pair holds the 1.2374 level that zone is still well within reach.
See charts illustrating the wave counts on the DXY and USD/CAD.
Mike Golembesky is a widely followed Elliott Wave technical analyst, covering U.S. Indices, Volatility Instruments, and Forex on ElliottWaveTrader.net (www.elliottwavetrader.net), a live Trading Room featuring intraday market analysis (including emini S&P 500, metals, oil, USD & VXX), interactive member-analyst forum, and detailed library of Elliott Wave education.

Eventually physical demand for precious metals will swamp the games being played in the paper (i.e., futures contract) markets. So every time the commitment of traders report (COT), which tracks those paper games, turns bearish while gold and silver continue to rise, the precious metals community watches hopefully for signs that fundamentals are at long last about to ignite a massive bull run.
The past couple of months followed this script (see Lightening-Fast COT Reversal: Now Fairly Bearish For Gold And Silver) as gold and silver kept rising for a while in the face of growing resistance in the paper market.
Here’s a more detailed explanation from Hebba Investments via Seeking Alpha:
The latest Commitment of Traders (COT) report, showed another rise in speculative longs for the EIGHTH straight
week. This two-month streak with the net speculative position of gold traders rising every week, has just tied the record-longest gains streak achieved – in the history of the COT report (going back to 2006) it has never risen for NINE consecutive weeks. History for COT nerds (like myself) could be made next week if gold speculators continue their torrid streak.About the COT Report
The COT report is issued by the CFTC every Friday, to provide market participants a breakdown of each Tuesday’s open interest for markets in which 20 or more traders hold positions equal to or above the reporting levels established by the CFTC. In plain English, this is a report that shows what positions major traders are taking in a number of financial and commodity markets.
Though there is never one report or tool that can give you certainty about where prices are headed in the future, the COT report does allow the small investors a way to see what larger traders are doing and to possibly position their positions accordingly. For example, if there is a large managed money short interest in gold, that is often an indicator that a rally may be coming because the market is overly pessimistic and saturated with shorts – so you may want to take a long position.
There are many ways to read the COT report, and there are many analysts that focus specifically on this report (we are not one of them) so we won’t claim to be the exports on it. What we focus on in this report is the “Managed Money” positions and total open interest as it gives us an idea of how much interest there is in the gold market and how the short-term players are positioned.
Moving on, the net position of all gold traders can be seen below:
Source: GoldChartsRUS
The red-line represents the net speculative gold positions of money managers (the biggest category of speculative trader), and as investors can see, we saw the net position of speculative traders increase by 18,000 contracts to 250,000 net speculative long contracts. We are now approaching some of the all-time highs in gross and net speculative positions – so gold investors need to be wary.
As for silver, the action week’s action looked like the following:
Source: GoldChartsRUS
The red line which represents the net speculative positions of money managers showed an increase in the net-long silver speculator position as their total net position increased by around 10,000 contracts from a net speculative short position to a net long position of 62,000. Silver speculators are a bit further away from their all-time highs than gold speculators, but are still moving up strongly.
We have been Extremely Bearish the last few week and have been dead wrong in our short-term call. When that happens, you have to re-evaluate your call and make sure that the logic is still valid to the situation.
Our bearish thesis was primarily based on the fact that speculative positions are extremely bullish levels, while physical demand remains at some of the lowest levels seen in the last few years. Additionally, the Federal Reserve seems to be tightening monetary policy, while some of the risk-on events (North Korea, US Debt Ceiling, etc.) seem to be calming down. None of this has changed.


The above was written yesterday. And today gold and silver are getting whacked.

So, alas, it appears that the paper players will live to manipulate another day, and gold bugs will have to wait for that sustained run to $5,000. Which is okay; the longer it takes the more time there is to stack.
Dollarcollapse.com
Let’s take a closer look at recent activity in US Treasuries. The yield on the 10-year note ended the day at 2.06% and the 30-year bond closed at 2.67%, some of the lowest levels since November of 2016.
Here is a table showing the yields highs and lows and the FFR since 2007 as of today’s close.

The 2-10 yield spread is now at 0.79%.
The chart below shows the daily performance of several Treasuries and the Fed Funds Rate (FFR) since the pre-recession days of equity market peaks in 2007.

Briefly:
Intraday trade: Our Friday’s neutral intraday outlook has proved accurate. The S&P 500 index continued to fluctuate within its week-long trading range. The broad stock market is likely to open much higher today following futures contract rally after an overnight gap-up opening. We can see some short-term technical overbought conditions. Therefore, intraday short position is favored. Stop-loss is at the level of 2,490, close to early August record high. Potential profit target is at 2,455 (S&P 500 index).
Our intraday outlook is now bearish, and our short-term outlook is bearish, as we expect downward correction. Our medium-term outlook remains bearish:
Intraday outlook (next 24 hours): bearish
Short-term outlook (next 1-2 weeks): bearish
Medium-term outlook (next 1-3 months): bearish
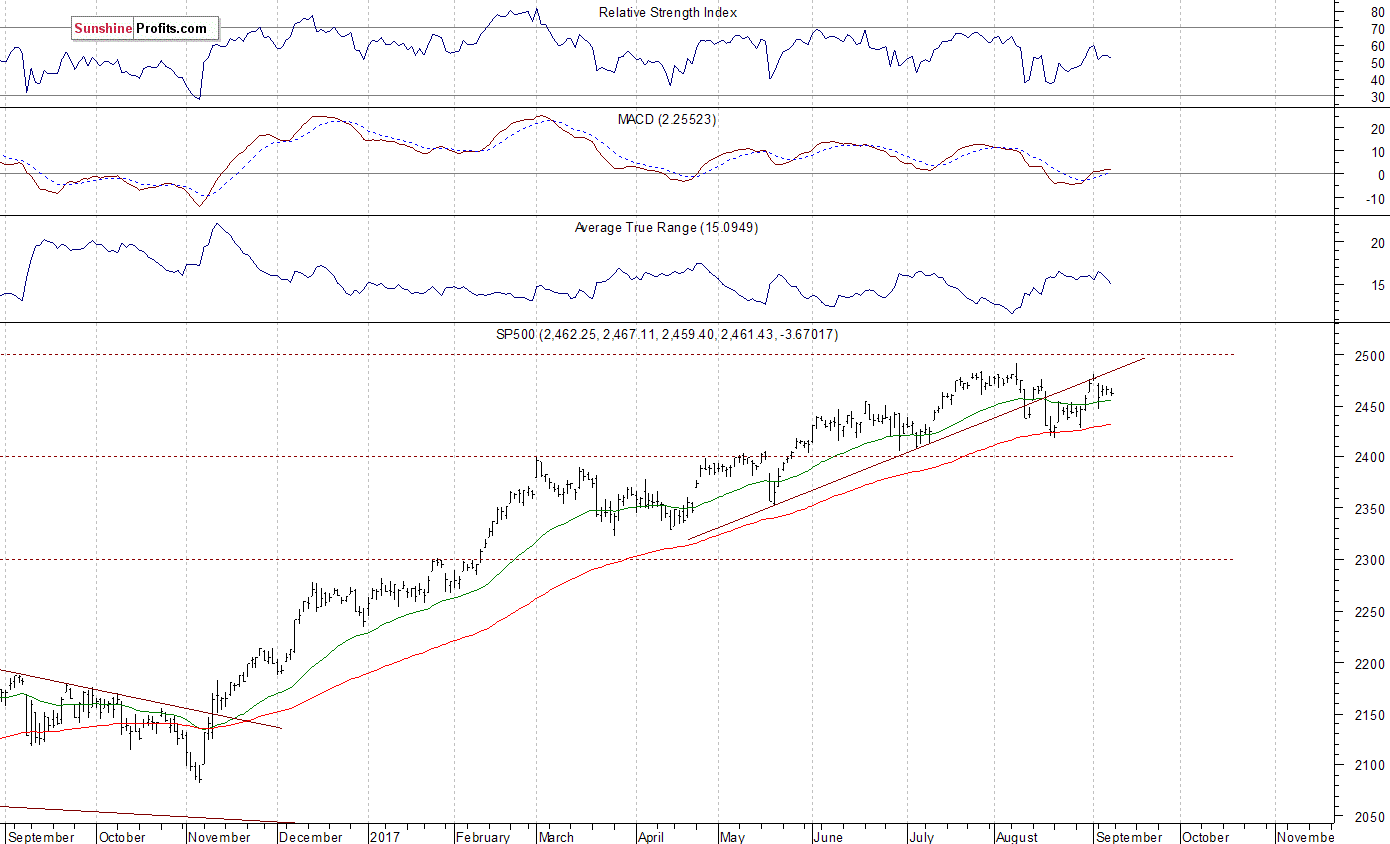
The main U.S. stock market indexes were mixed between -0.6% and +0.1% on Friday, extending their short-term fluctuations, as investors reacted to economic data announcements, news concerning hurricane ‘Irma’, among others. The S&P 500 index continues to trade around 1% below the August 8 all-time high of 2,490.87. The Dow Jones Industrial Average extended its fluctuations along the level of 21,800, and the technology Nasdaq Composite index lost 0.6%, as it fell below the level of 6,400. The nearest important level of resistance of the S&P 500 index remains at around 2,470-2,475, marked by last Tuesday’s daily gap down of 2,471.97-2,473.85. The next resistance level is at 2,480-2,490, marked by recent local high and the above-mentioned August record high. On the other hand, support level is at around 2,445, marked by last Tuesday’s daily low. The next level of support is at around 2.430-2,435, marked by the daily gap up of 2,430.58-2,433.67 and previous local low. The broad stock market continues to trade within an over-month-long consolidation following November-July uptrend. Will it continue higher? Or is this some medium-term topping pattern before downward reversal?
Very Positive Expectations
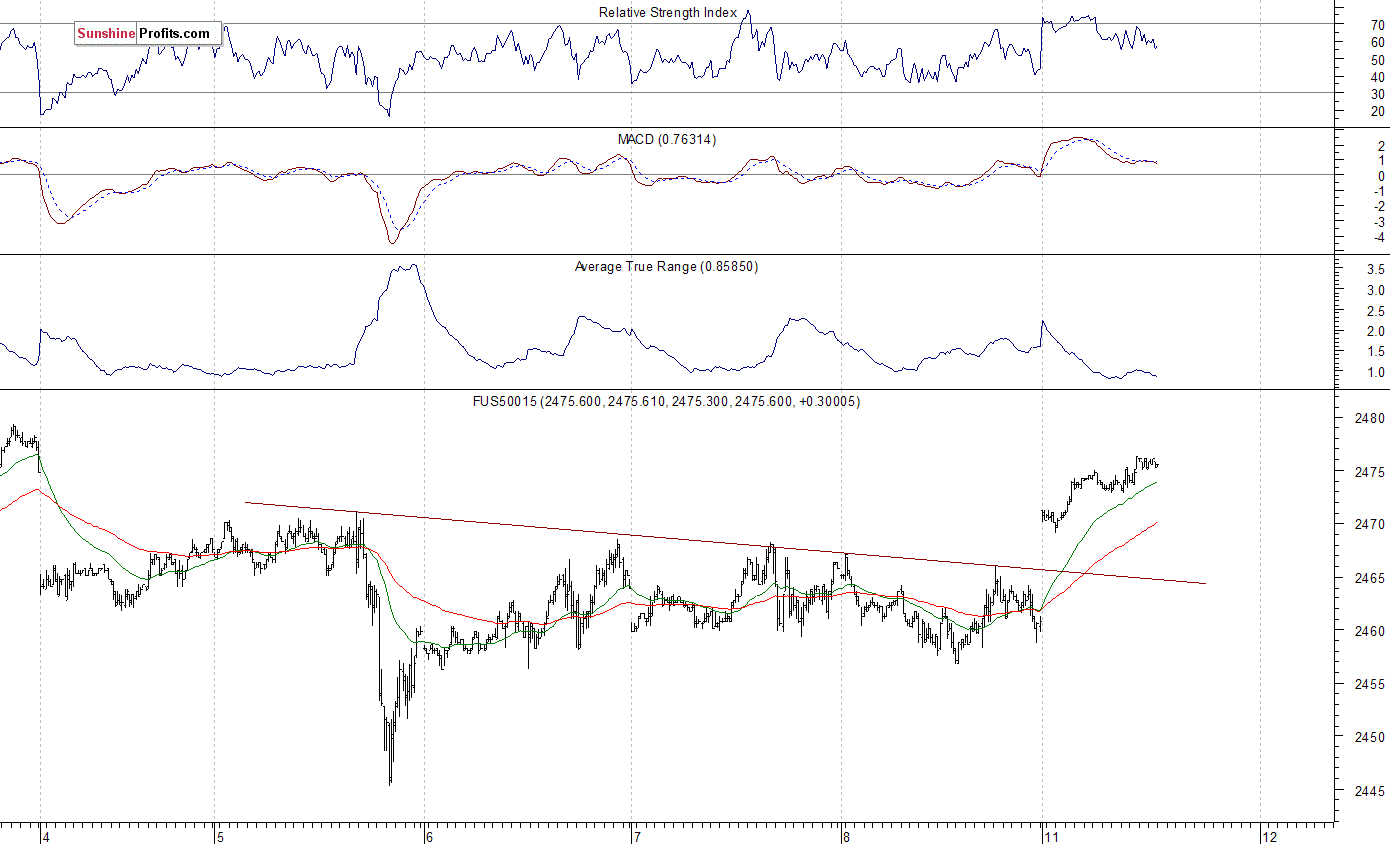
Expectations before the opening of today’s trading session are very positive, with index futures currently up between 0.6% and 0.8% vs. their Friday’s closing prices. The European stock market indexes have gained 0.5-1.2% so far. There will be no new important economic data announcements today. The S&P 500 futures contract trades within an intraday uptrend, following much higher opening of the trading session. The nearest important level of support is at around 2,465-2,470, marked by today’s daily gap up, among others. The next support level remains at 2,455-2,460, marked by short-term local lows. On the other hand, resistance level is at 2,480-2,490, marked by some local highs and the early August all-time high. The market broke above its short-term consolidation this morning. Will it continue its uptrend? There have been no confirmed negative signals so far. However, we can see some short-term technical overbought conditions:
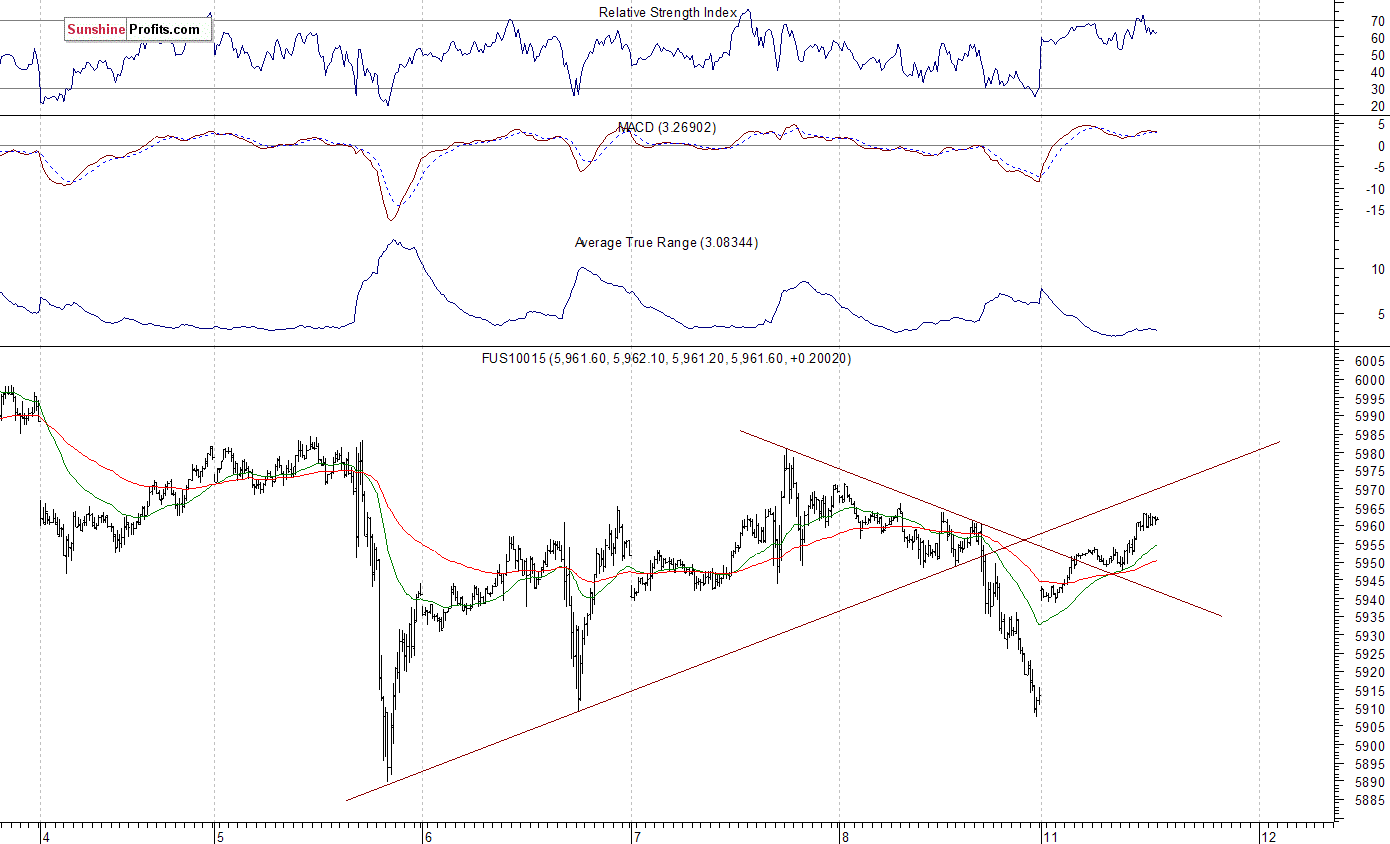
Nasdaq Relatively Stronger
The technology Nasdaq 100 futures contract follows a similar path, as it trades within an intraday uptrend. It retraces its Friday’s move down. The nearest important level of resistance is at around 5,980, marked by recent local high. The next level of resistance is at 6,000-6,020, marked by record high, among others. Will the Nasdaq resume its uptrend and break above 6,000 mark again?
Concluding, the S&P 500 index extended its short-term consolidation on Friday, as it lost 0.2%. The broad stock market will likely break above its recent trading range today following an overnight futures contract rally. Will the uptrend continue towards the level of 2,500? There have been no confirmed short-term negative signals so far. However, we still can see some medium-term overbought conditions along with negative technical divergences.
If you enjoyed the above analysis and would like to receive free follow-ups, we encourage you to sign up for our daily newsletter – it’s free and if you don’t like it, you can unsubscribe with just 2 clicks. If you sign up today, you’ll also get 7 days of free access to our premium daily Gold & Silver Trading Alerts. Sign up now.
Thank you.
Paul Rejczak
Stock Trading Strategist

-
I know Mike is a very solid investor and respect his opinions very much. So if he says pay attention to this or that - I will.
~ Dale G.
-
I've started managing my own investments so view Michael's site as a one-stop shop from which to get information and perspectives.
~ Dave E.
-
Michael offers easy reading, honest, common sense information that anyone can use in a practical manner.
~ der_al.
-
A sane voice in a scrambled investment world.
~ Ed R.
Inside Edge Pro Contributors

Greg Weldon

Josef Schachter

Tyler Bollhorn

Ryan Irvine

Paul Beattie

Martin Straith

Patrick Ceresna

Mark Leibovit

James Thorne

Victor Adair