
Gold & Precious Metals
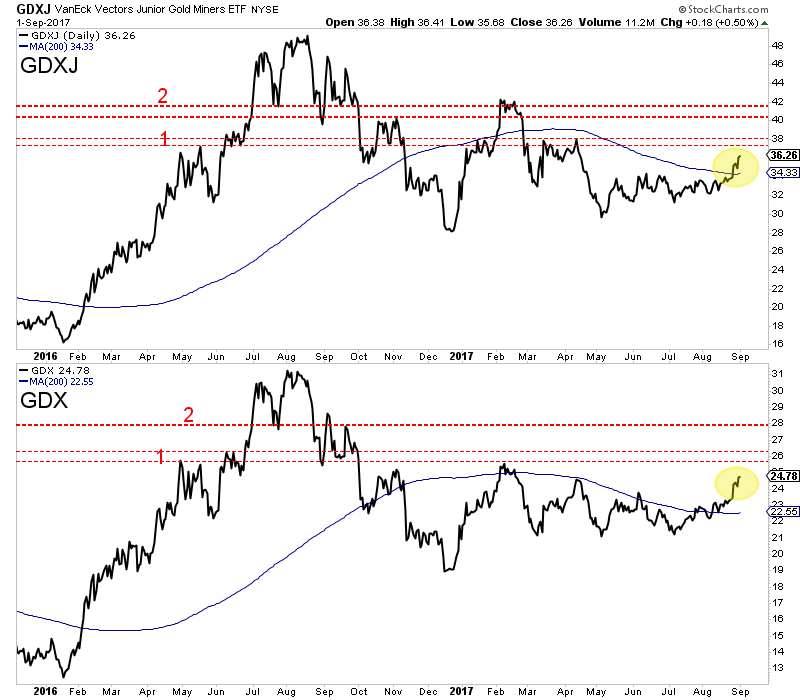
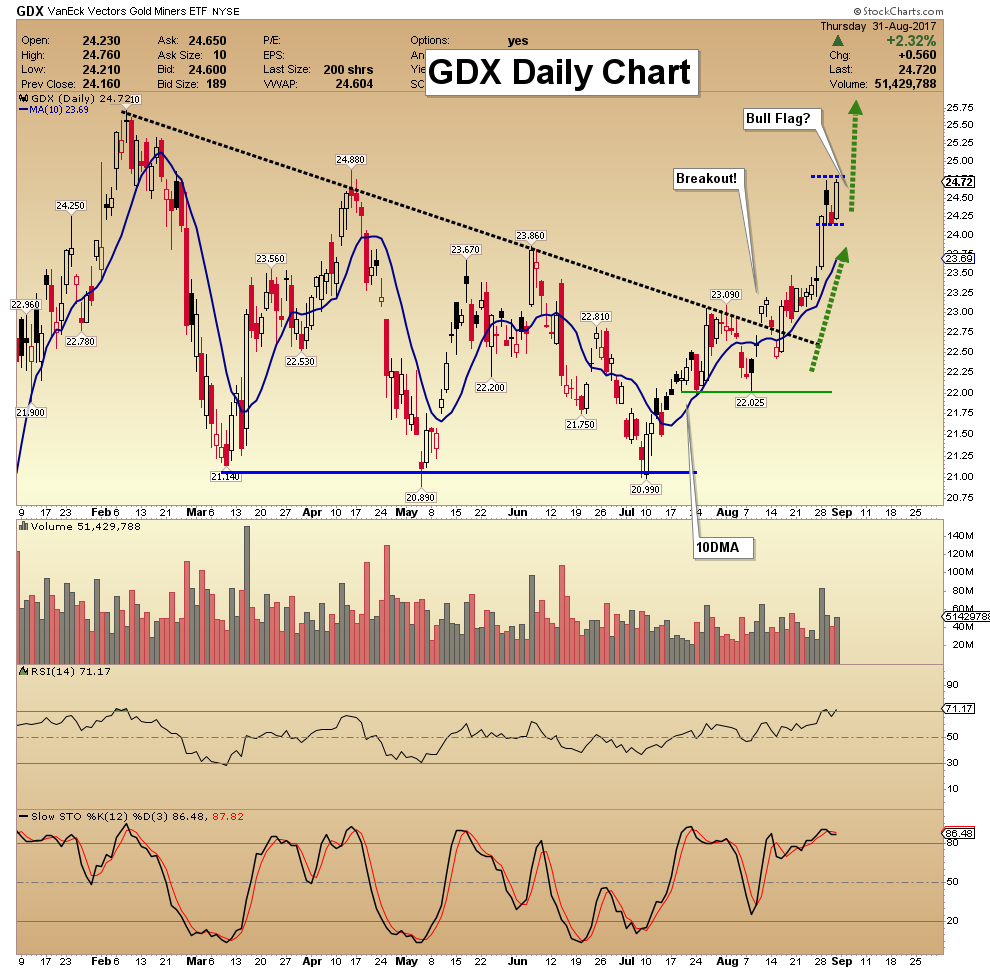
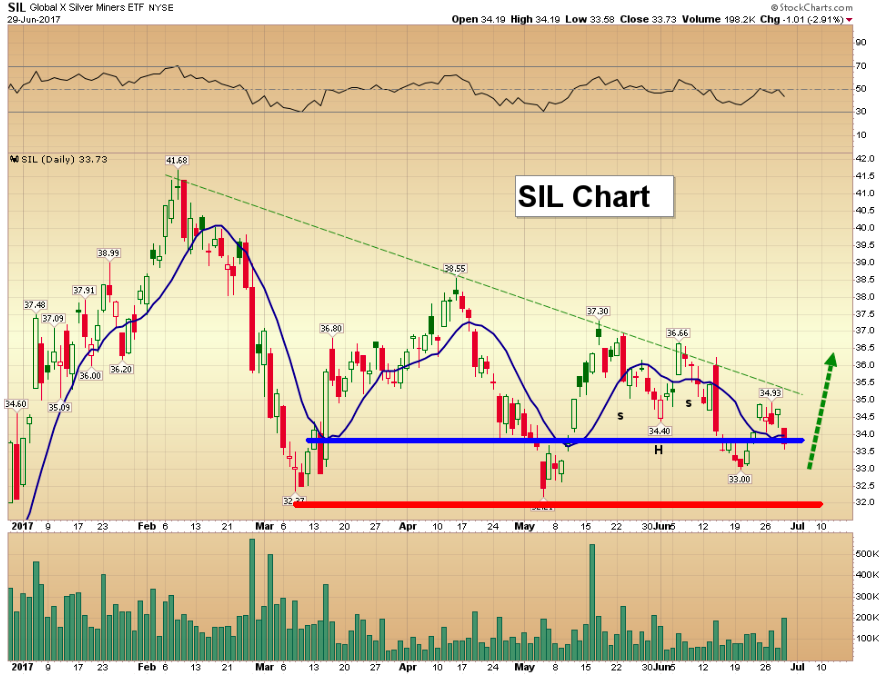
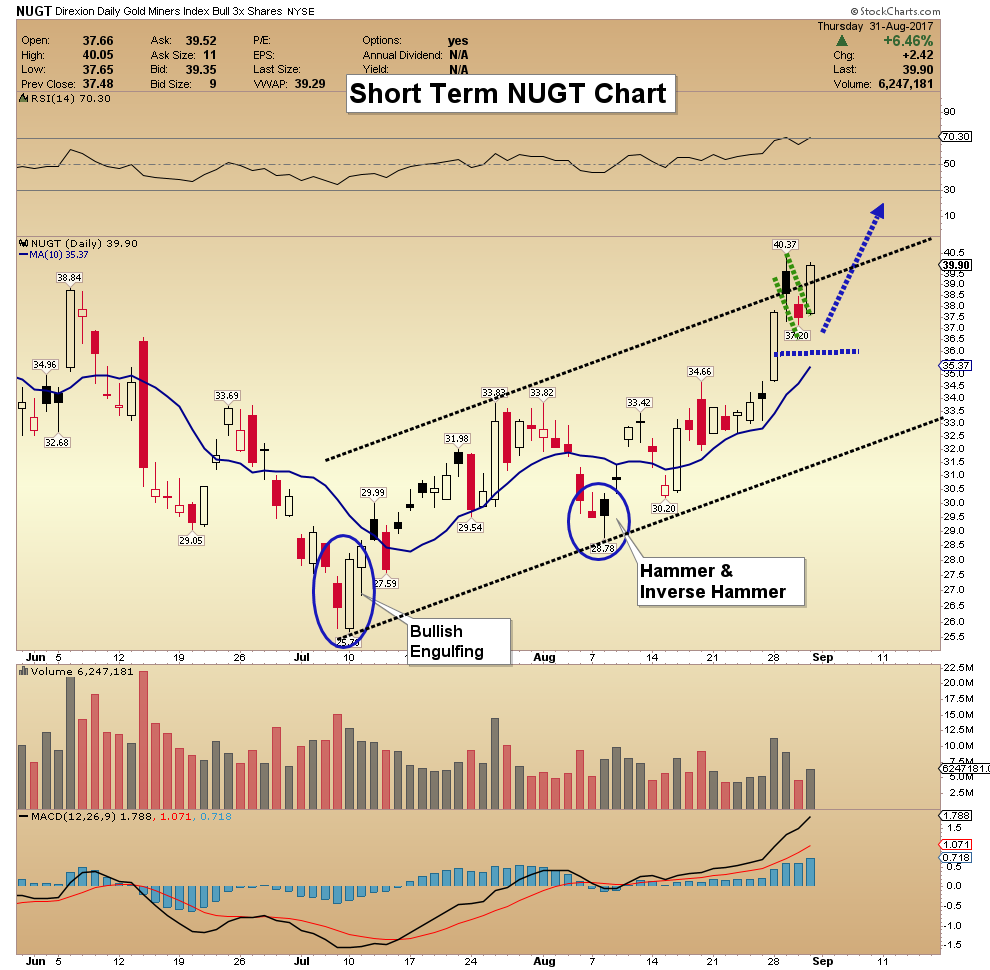
Gold cleared $1300 early in the week and padded its gains on Friday even amid a bullish weekly reversal in the US Dollar. Gold’s breakout was validated by a strong monthly close on Thursday and then a strong weekly close Friday. As predicted, the miners perked up with the breakout in Gold. GDX and GDXJ gained nearly 6% and 7% respectively for the week. Look for the miners to continue to trend higher as Gold attempts to retest its 2016 highs around $1375/oz.
The miners (GDX and GDXJ) have more immediate upside potential. The daily line charts show two levels of resistance. The first level is around $26 for GDX and $38 for GDXJ while the second level is $28 for GDX and $40-$41 for GDXJ.
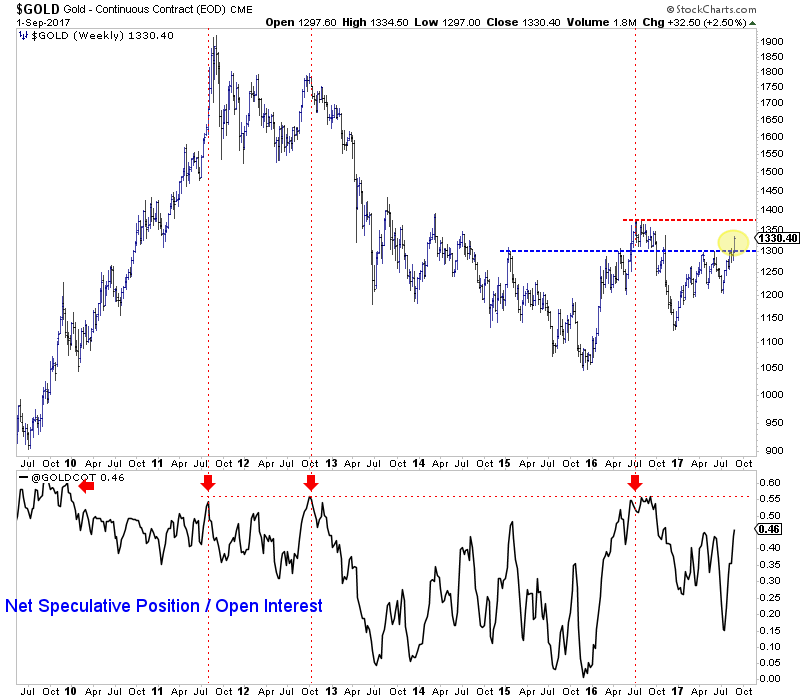
While Gold closed well above $1300 at $1330/oz, it faces resistance at the 2016 highs around $1375/oz. The net speculative position has reached 248K contracts or 46% of open interest. As the chart below shows, the 2016, 2012 and 2011 peaks in Gold all coincided with a net speculative position of 55% of open interest. If current trends continue, the net speculative position could reach 55% as Gold tests $1375/oz.
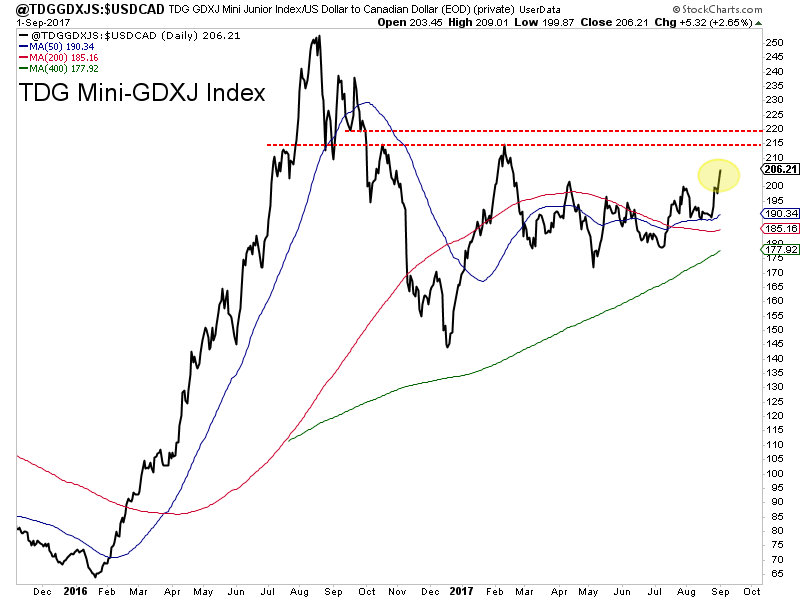
Circling back to the stocks, we see that our mini-GDXJ index, which consists of 26 stocks and has a median market cap of ~$100 Million closed the week at a +6 month high. The exploration juniors have led the entire sector this year and we expect that to continue. The price action is healthy as the index is trading above its 50-day, 200-day and 400-day moving averages which are all sloping higher. The index closed at 206 and should reach resistance at 215-220. A correction from there (perhaps in October) could setup a push to the 2016 high.
The breakout in Gold through $1300/oz has sparked the miners and juniors and we expect additional gains in the short-term as Gold has room to run. That being said, do note that the net speculative position in Gold is fairly high. It could reach an extreme level if Gold tests major resistance around $1375/oz. To find out the best buys right now and our favorite juniors for 2018 consider learning more about our premium service.
Jordan Roy-Byrne CMT, MFTA

 1. Martin Armstrong: Is the Stock Market Really Overvalued?
by Martin Armstrong
All we have been hearing since 2011 is how the stock market is going to crash and then there will be hyperinflation and all sorts of strange relationships that never materialize. They simply focus on the level of the stock market in nominal terms without adjusting it for inflation or showing how it has performed relative to the rest of the economy.
2. Dollar Update as Loss of Reserve Currency Status Looms
by Clive Maund
The dollar is on course to lose its reserve currency status. This is not something that will happen overnight, it will be a process, but at some point there is likely to be a “sea change” in perception, as the world grasps that this is what is happening, which will trigger a cascade of selling leading to its collapse, whereupon gold and silver will rocket higher.
3. Hot Properties: Michael’s Real Estate Warning
by Michael Campbell & Ozzie Jurock
Michael shares a costly mistake he himself made in real estate and gets Ozzie’s advice on how everyone can avoid stumbling into the same costly scenario.

Harvey made landfall as a Category 4 Hurricane on August 25. The wind and flooding caused massive destruction. The news mentioned one hundred billion dollars as a preliminary estimate of the damage.
Eight days before on August 17 Harvey became a named storm. There was no apparent cause for alarm on August 17.
- August 17: Harvey is named
- August 21: Total eclipse of the sun. The path crossed the contiguous 48 states. Read “Total Eclipse of Sense.”
- August 21: President Trump announces a revised and renewed war effort in Afghanistan.
- August 25: Category 4 Harvey makes landfall, destroys buildings and dumps trillions of gallons of water on Texas. Houston, the 4th largest city in the U.S. flooded in many areas.

MUCH CAN CHANGE IN 8 DAYS!
SO WHAT?
- Are you prepared for drastic changes in your physical environment? Harvey, Katrina, Rita, and 9-11 show that our world changes, sometimes in deadly ways.
- Are you prepared financially? What will a stock or bond market crash do to your life style and retirement plans? Given their extreme valuations, a crash is possible.
- In 2008 we experienced a credit crunch, a destructive event because the economic world depends upon credit. It could happen again.
- The U.S. dollar is the world’s reserve currency. The U.S. military and the petrodollar support that status. Change is coming.
CONSIDER PAST CHANGES IN 8 DAYS
Gold Market: From January 21, 1980 to January 28, 1980, (seven days) the price of gold dropped from a high of $873 to a low of $607. Down 30%!
DOW Index: From October 12, 1987 to October 20, 1987, the DOW dropped from a high of 2,505 to a low of 1,616. Down 36%!
NASDAQ 100 Index: From March 27, 2000 to April 4, 2000, the NASDAQ 100 dropped from a high of 4,781 to a low of 3,525. Down 26%!
9-11 Attack: Three buildings collapsed at “free-fall” speeds after being hit by two airliners. An official story was created, but let’s not quibble about details. The United States was a different environment eight days after 9-11.
S&P 500 Index: From October 2, 2008 to October 10, 2008, the S&P 500 Index dropped from a high of 1,160 to a low of 840. Down 27%!
Hurricane Harvey: A category 4 hurricane was a tiny storm only eight days earlier. Houston will recover and rebuild for eight months, or perhaps eight years following the incredible flooding. Houston, you have a problem!
Yes, much can happen in only eight days.
According to Charles Hugh Smith, “Next Stop, Recession: The Financial Meteor Storm is Headed Our Way”
“The next recession – which I suggested yesterday has just begun – will be more than a business-cycle downturn; it will be a devastating meteor storm that destroys huge chunks of the economy while leaving other sectors virtually untouched.”
His description of coming economic destruction parallels the devastation in Houston. If you live in the flood zones, you’ll see vast destruction. Higher areas will get rained on but could be virtually untouched by the massive destruction.
WHAT CAN WE DO TO PREPARE FOR FINANCIAL STORMS?
- Self-reliance. Find your own answers.
- Possess real money. Don’t depend entirely upon the debt based digital and paper stuff that can vanish as quickly as a Cadillac in a Houston flood.
- Minimize counter-party risk and off-load assets that will be destroyed in a credit crunch, debt reset, dollar devaluation, or crash in the purchasing power of the dollar.
- Possess assets that will be less affected by counter-party risk, a credit crunch, and massive inflation in the supply of dollars. Gold and silver come to mind.
Find your own answers. This story went viral. “Dog Carrying A Bag of Food”

Otis (the dog) relied upon himself, knew what he needed, and did what was necessary. A bag of food was his “gold” in the storm.
Gary Christenson
The Deviant Investor
Today’s videos and charts (double click to enlarge):
SFS Key Charts & Video Update


SF60 Key Charts & Video Update

SF Juniors Key Charts & Video Analysis

SF Trader Time Key Charts & Video Analysis

Morris
The S&P 500 closed August with a fractional monthly gain of 0.05% after a monthly gain in July of 1.93%. All three S&P 500 MAs are signaling “invested” and four of the five Ivy Portfolio ETFs — Vanguard Total Stock Market ETF (VTI), Vanguard FTSE All-World ex-US ETF (VEU), iShares Barclays 7-10 Year Treasury (IEF), and Vanguard REIT Index ETF (VNQ) — are signaling “invested”. In the table, monthly closes that are within 2% of a signal are highlighted in yellow.

The above table shows the current 10-month simple moving average (SMA) signal for each of the five ETFs featured in The Ivy Portfolio. We’ve also included a table of 12-month SMAs for the same ETFs for this popular alternative strategy.
For a fascinating analysis of the Ivy Portfolio strategy, see this article by Adam Butler, Mike Philbrick, and Rodrigo Gordillo:


-
I know Mike is a very solid investor and respect his opinions very much. So if he says pay attention to this or that - I will.
~ Dale G.
-
I've started managing my own investments so view Michael's site as a one-stop shop from which to get information and perspectives.
~ Dave E.
-
Michael offers easy reading, honest, common sense information that anyone can use in a practical manner.
~ der_al.
-
A sane voice in a scrambled investment world.
~ Ed R.
Inside Edge Pro Contributors

Greg Weldon

Josef Schachter

Tyler Bollhorn

Ryan Irvine

Paul Beattie

Martin Straith

Patrick Ceresna

Mark Leibovit

James Thorne

Victor Adair