
Currency
The dollar is on course to lose its reserve currency status. This is not something that will happen overnight, it will be a process, but at some point there is likely to be a “sea change” in perception, as the world grasps that this is what is happening, which will trigger a cascade of selling leading to its collapse, whereupon gold and silver will rocket higher.
A big reason for the dollar finding support in recent years and doing relatively well versus its peers has been the perception that the US is the last and best “safehaven” in a world beset with instability and terrorism etc , but that perception is changing as US society starts to polarize in a dangerous manner. In addition, the continued provocations and threats by the US towards China and Russia has driven them into making preparations to ditch using the dollar, and these preparations are well advanced, and have included buying huge quantities of gold. Thus the dollar is looking increasingly vulnerable. On the long-term 20-year chart for the dollar index we can see that it is still at a fairly high level after its gains during 2014 and 2015, but appears to be marking out a “Broadening Top” pattern. On this chart we can also see that if it proceeds to fall hard soon, it won’t be the 1st time – it suffered a brutal decline between the start of 2002 and early 2008 – and that was before it was threatened with the loss of its reserve currency status, so the looming bearmarket could clearly be much, much worse.

On the 4-year chart we can examine the Broadening Top in much more detail. The rally to a peak at the end of last year was due to euphoria over Trump’s election, but it since dropped right back across the pattern as reality has reasserted itself, and of course Trump himself has now been totally emasculated by the Deep State, evidenced by a string of U turns on his campaign promises, the latest being on Afghanistan last week. He is now nothing more than a figurehead, a Deep State puppet, and it will be rather pitiful to watch his diehard supporters clinging on to the belief that he will actually make any difference.
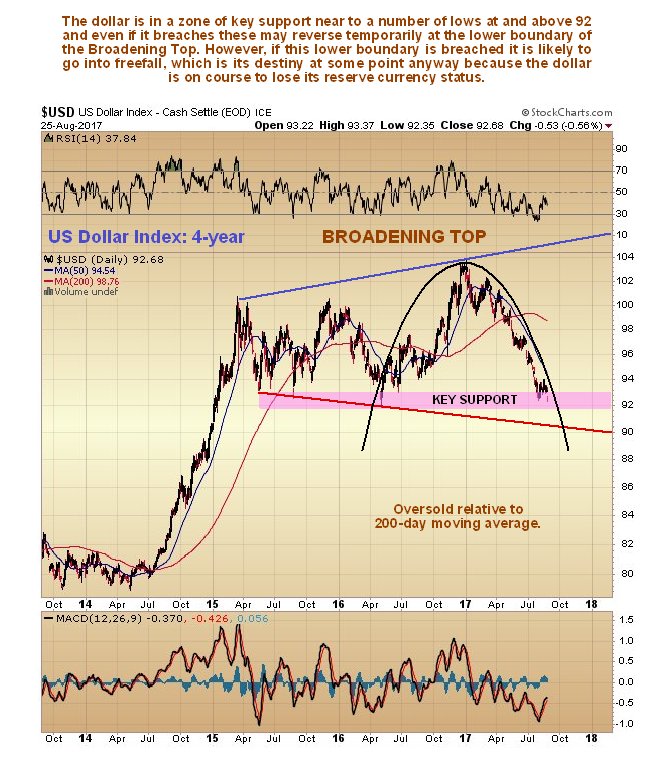
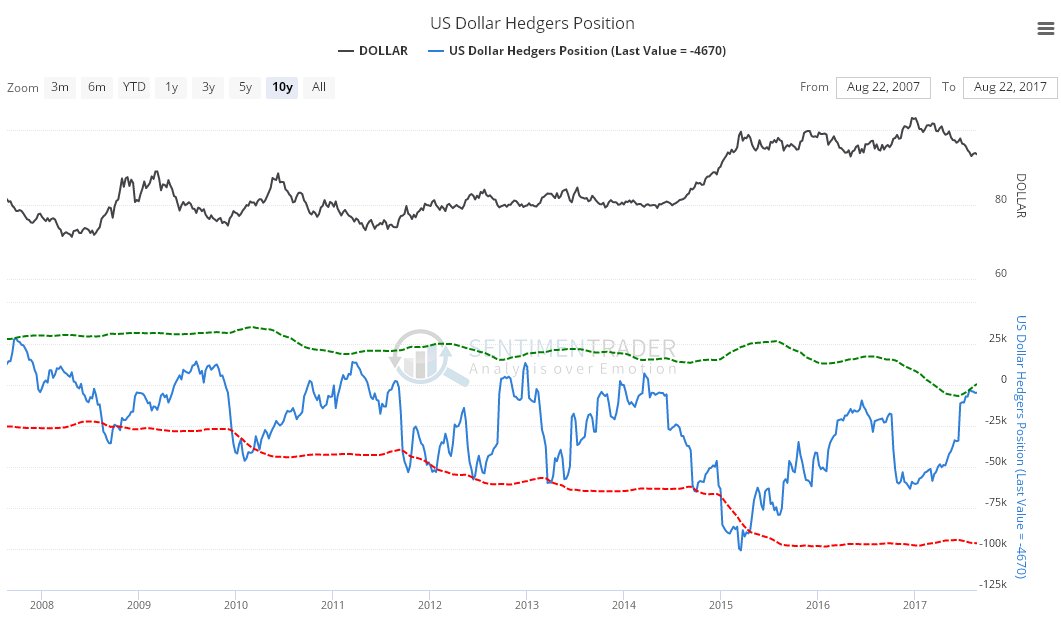
In recent weeks the dollar has come rattling all the way back down to the support near to the earlier lows towards the bottom of the Broadening Top, driven lower at an accelerating rate by the parabolic downtrend shown, and while this could soon force a breakdown from the top pattern, it’s a tough call because the support in this area and down to the lower boundary of the pattern is strong, and a high short position has built up, so these two factors together could break the dollar above the parabola leading to a short to medium-term relief rally. However, the long-term outlook remains grim, whether this happens or not, and if it does happen, US readers should seize the opportunity to switch out of US dollar denominated assets into something like the Canadian – the Canadian dollar should do particularly well because if the US dollar does plunge, hard assets like gold and silver will soar, and the Canadian economy is resource based. Canada is also attractive for US investors because it is a relatively stable economy close to home. The Hedgers chart for the dollar certainly looks bullish for the short to medium-term as it shows the positions of the large Commercial Hedgers, who are usually right. As we can see, they have almost completely cleared out their short positions, which are now at levels that have in recent years have always lead to a rally. This is part of the reason for us turning cautious on the Precious Metals sector short-term last weekend, and an additional reason is the continued growth in Commercial short positions in gold and silver. This doesn’t mean we are turning bearish, rather, it may throw up another opportunity to buy our favorite gold and silver stocks at even better prices in the weeks ahead.
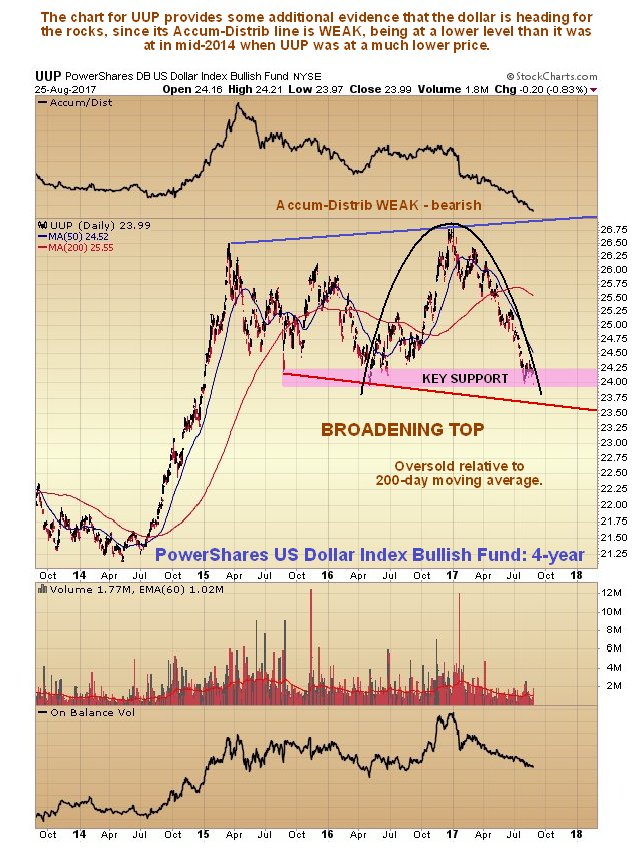
Click on chart to popup a larger clearer version. The 4-year chart for dollar proxy UUP provides some additional evidence that the dollar is headed for the rocks, since its Accum-Distrib line is very weak, being already at a lower level than it was at in mid-2014 when UUP was at a much lower level…
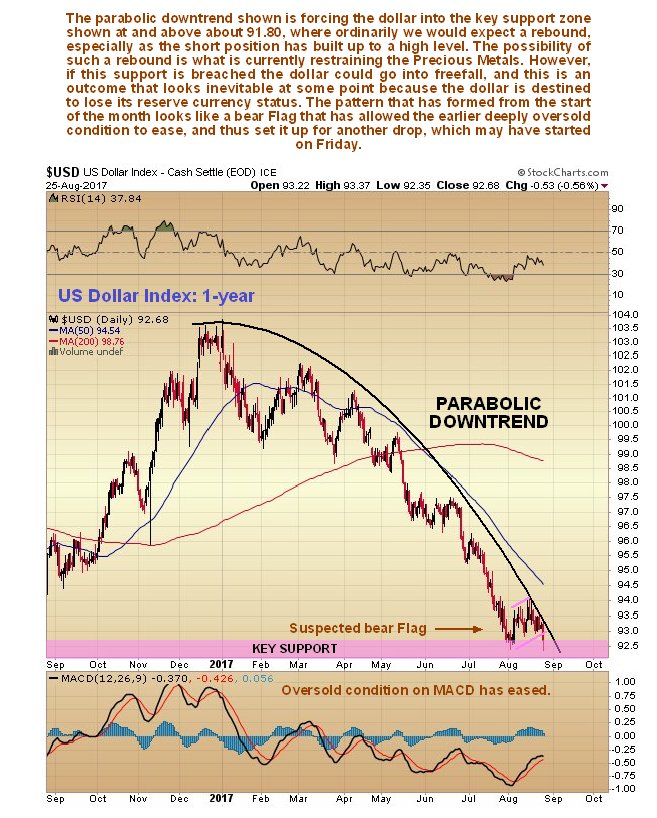
On the 1-year chart we can zoom in on the parabolic uptrend in force from the start of the year. For a while, about a week or two ago, it looked like it had broken out above the parabolic uptrend, but Friday’s rather sharp drop suggests that it remains in force, and its position requires adjusting to be more generous. After adjusting the downtrend it now looks like the dollar just completed a bear Flag that allowed the earlier oversold condition to partially unwind. If this is true, then it is now likely to continue falling down to the lower boundary of the Broadening Top, the red line, and there we should again watch out for a snapback rally, since we can presume that the short position will have built up to an even higher level by then, although having broken down through a lot of support in the 92 area, it may be beyond help by this point and simply plunge, once that happens the Precious Metals will finally take off higher in a decisive manner.
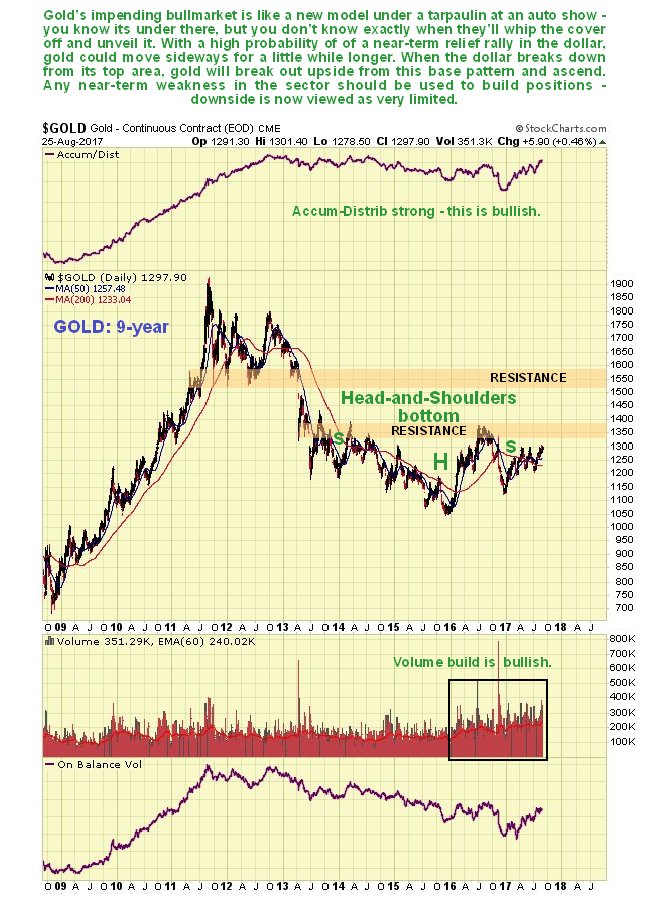
Meanwhile gold’s incubating major new bullmarket is like a new model under a tarpaulin at an auto show – you know it’s under there, but you don’t know exactly when they will whip the cover off and unveil it…

Dow Theory Still Bullish,
Elliott Wave Hangs On Too,
Your Own Personal Trading System,
All About the Profits,
Mr. Persistent,
Trump Bump,
Colorado, Chicago, Lisbon, Denver, and Lugano
“Bull markets are born on pessimism, grow on skepticism, mature on optimism, and die on euphoria.”
– Sir John Templeton

Dogs bark, birds sing, stock markets (and stocks themselves) fluctuate. Bonds, commodities, currencies, and all else that moves in the economic world will fluctuate. Only the economic market, however, transforms into a new beast when it changes direction to become a bull or a bear. Oddly, though, it’s not easy to objectively define either one: Observers see whichever they prefer to see.
Academic research has consistently pointed out that perma-bulls and perma-bears make far less profit than those who are cautiously optimistic. It’s key to remember that a wide world of economic opportunities lurks out there – you’re not forced to choose just your home-country stocks. Indeed, a home-country bias can be problematic.
Today we’ll look at reasons to be bullish on the equity markets, but I’ll also teach you a thing or two about trading. In my managed Mauldin Smart Core Portfolio, we are still basically long equities, but we have more and more exposure outside the US. And while for regulatory reasons I can’t discuss the details of my system in this letter, I can give you some simple guidelines that will at least help you to be in the market when you should be and to get out before disaster strikes.
As we noted last week in “All Things Bearish,” bearishly oriented investors see many reasons to be cautious now and little grounds for optimism. Others are stalwartly bullish. Naturally, I have friends on both sides of this debate, people with deep knowledge and experience. Problem is, they can’t all be right. The stock market will move up or down (or possibly sideways), and some of us will be wrong.
Now, let’s see what the bulls have to say.
Longtime readers know how much I admired the late Richard Russell, editor of Dow Theory Letters. Richard stuck to his methodology despite his own misgivings. By its nature, Russell’s version of the Dow Theory gives very long-term buy and sell signals. Richard left us in 2015, but other analysts follow strategies similar to his. According to newsletter tracker Mark Hulbert, these analysts are now uniformly bullish. Benchmarks confirmed the bull market by reaching new highs this summer.
One question remains. Dow Theory looks at the relationship between the Dow industrials and transports averages, and the transports have pulled back since mid-July. That shift might mark the beginning of a bigger downturn, or it might not. Here’s how Hulbert explains it:
Ominous though this sounds, however, Moroney and the other Dow Theorists I track are still bullish. That’s because the stock market must jump over three successive hurdles to generate a bear-market signal, and it hasn’t even cleared the first.
Those three steps are:
1. Both the Dow Jones Industrial Average and the Dow Jones Transportation Average must undergo a “significant” decline after hitting new highs – “significant” both in terms of time and magnitude.
2. In their subsequent “significant” rally following the decline referred to in step No. 1, either one or both of these Dow averages must [fail] to surpass their highs.
3. Both averages must then fall below their lows registered at the bottom of the decline referred to in step No. 1.
Notice that I put “significant” in quotes. That’s because there isn’t universal agreement on what magnitude of market moves is necessary to satisfy. Some Dow Theorists argue that, per Hamilton’s original indications, a move under the first step isn’t “significant” unless it lasts at least three weeks and corrects at least one-third of its previous move. On this interpretation, the market hasn’t come close to that first step.
Depending how you look at it, then, the Dow Theory signal is either in full-on bull market mode or might be taking a small step back. In either case, it is nowhere near bearish, and Dow Theory followers see no reason to sell. If anything, by their lights they should be buying more.
The Elliott Wave Principle, all the rage in the 1980s, is less influential now but is still watched by the technical analysis team at Goldman Sachs. The Elliott Wave comprises sequential upward and downward market moves – “waves” – that form repeating cycles. A full cycle has eight waves. Waves 1–5 are bullish, with only minor pullbacks between. Waves 6–8 are corrective, or bearish, and you do not want to be long when they happen.
The market is presently in wave 4, according to Goldman market technician Sheba Jafari. That means the next downturn will be limited and followed by another bullish wave. Then we would see a bigger correction.
Jafari explains this analysis with the following chart, published in Business Insider last week.
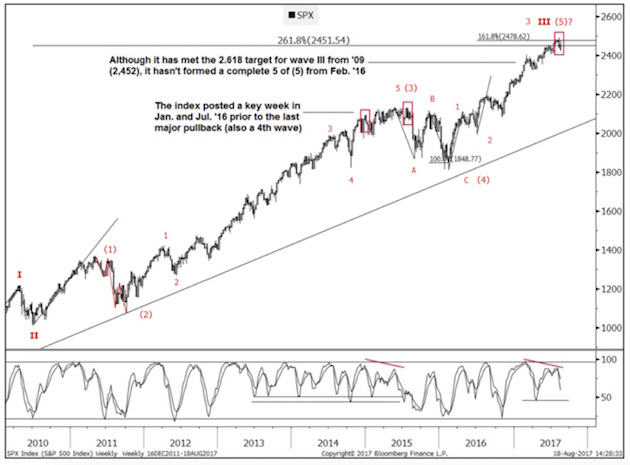
Like Dow Theory, Elliott Wave is very long-term. The correction between waves 4 and 5 could last a year or more. The bullish wave 5 could last another year after that. By this view we are still a couple of years away from a major bear market, with profits still to be made on the long side.
Am I convinced? No. But serious people are, and you should know what they’re thinking.
Your Own Personal Trading System
Both of the above systems are rather complex. Technical analysts develop their own highly nuanced systems, but these systems require years of dedication to use and understand. My own management system uses four separate traders who have radically different trading styles. Frankly, 95% of my readers couldn’t understand what they’re saying. I have been studying technical trading systems and methodologies for almost 30 years, and I struggle to keep up with these guys.
However, one simple rule of thumb can enable you to benefit from a bull market and avoid the worst of a bear market: When your stock or index goes above the simple 200-day moving average, you are in the market; when it falls below that average, you are out. I will explain some of the complications and caveats momentarily.
One of the greatest traders of all time, Paul Tudor Jones, runs about $13 billion. When he talks to groups, he advises people to use something like a 200-day moving average.
If you’re really interested in some of Jones’s wisdom, do a Google search on his speeches and papers and read them. Get some copies of the old Market Wizards books. But remember that most of us make our money from our day jobs, not investing. The first point of investing is to not lose the money you manage to save from your day job. Then second is to make that money grow. You have to recognize your opportunities and take them when they show up.
And remember Warren Buffett’s two rules of investing:
Rule No. 1: Never lose money.
Rule No. 2: Never forget rule No. 1.
I had my friend Steve Blumenthal send me the following four charts of the Dow, the S&P 500, the NASDAQ, and the Russell 2000. The first three are all above their 200-day moving average, and the Russell just dipped below its 200-day average. I post the charts so you can see the ebb and flow over time.
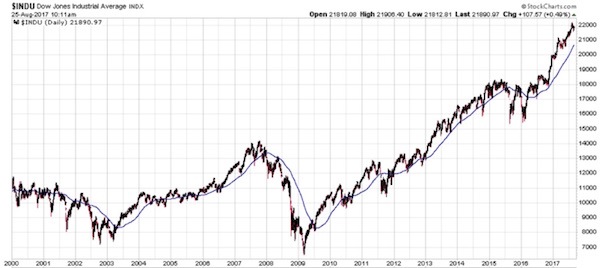
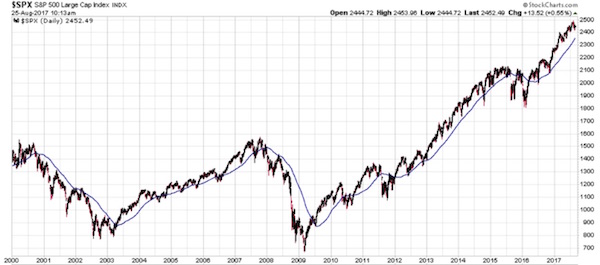
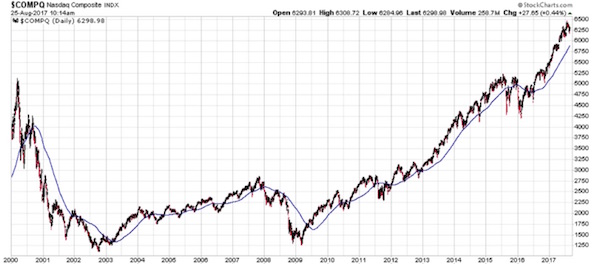
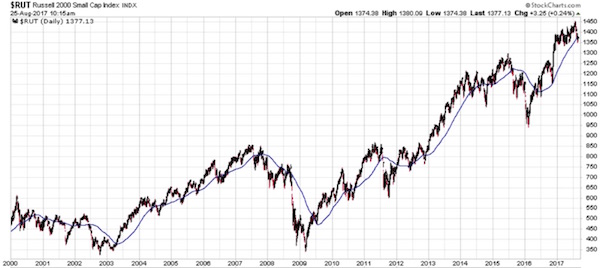
Relying on the 200-day moving average is not the best system, and some traders will note that point approaching and play games to take away some of your potential earnings. But if you don’t have a system, you’ll miss out, and the 200-day moving average works better than no system at all. It’s annoying when you get whipsawed, but that’s the price of not having to take a 25 or 30% drawdown. By whipsawed, I mean that the signal moves in and out several times quickly, and you’re constantly trading. Some “sophisticated” traders operate under restrictive parameters to dampen that action: They might wait for three days and then trade only on Friday or on a full moon in the effort to avoid getting whipsawed.
There are better rules and moving averages to use; but that’s what my clients pay me for, and I’m giving you this for free. Further tip: Different indexes and stocks and other markets have different relevant moving averages.
I should note that there are a lot of resources on the internet. For example, every Wednesday, Steve Blumenthal gathers updates from some of the best technical systems and generously posts the data for the past week in his letter Trade Signals. You can get a few of Ned Davis’s gonzo reports there, along with others.
You really have no excuse for living through a 40% drawdown. Or missing another 20% run-up because you’re nervous. Either position is simply intellectually and operationally lazy. Caveat: There is no perfect system. If you’re going to trade the markets, you are going to have losing periods. If it were easy, everybody could do it. But at least you can do the simple stuff to minimize the losses and maximize the gains. I know successful commodity traders who are right only 40% of the time. But they cut their losses quickly, and when they catch a big run it really makes a difference.
In my own money management system, I try to get what the market gives me but with dramatically less volatility. On average, you aren’t going to make more than the market gives you. There are no free lunches.
But when I tell you to have a system that allows you to hedge your investments, at least do that at a minimum. Do not simply be passively long and forget about it. You will not like the correction that accompanies the next recession – whenever it comes.
Let’s look at the fundamentals. When you buy a stock, you are really buying its future earnings: Each share’s price is the discounted present value of its expected future earnings. Prices change when expectations change, which happens for many different reasons.
The present bull market is still with us in large part because earnings are pretty good. With most of the second-quarter reports now in, FactSet reported in its August 11 letter a 10.2% blended S&P 500 earnings growth since the same period in 2016. Earnings grew in every sector except Consumer Discretionary.
More impressive is that companies also expanded their net profit margins.
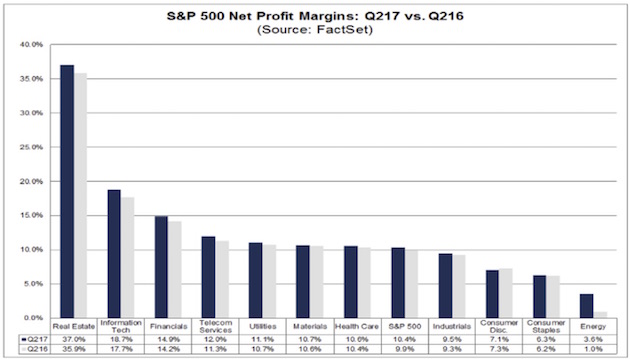
The bars above show net profit margins by sector for the second quarters of 2017 and 2016. The only sector to see compressed margins was Consumer Discretionary, and only by 0.2 percentage points.
Forget for a moment that these are public companies. Imagine it’s your own business. Not only are you nicely profitable, you are even more profitable on each dollar of revenue (which also grew) than you were a year ago. And that’s after you paid yourself a handsome salary and bonus.
Are you happy? Of course you are. Would you be eager to sell your business to someone else? Maybe, but you would ask a premium price for it. That’s essentially the calculation stockholders are making right now. Business is good and getting better. No reason to sell at anything less than full price, generously defined.
Reluctant sellers mean higher prices. That’s the foundation of this bull market. The market will likely fall if the foundation erodes, but that hasn’t happened yet.
In writing this letter, I reached out to my contacts looking for an uber-bull – someone utterly convinced that the market is on solid ground, with good evidence for their view.
Fortunately, a good friend who must remain nameless shared with me an August 4 slide deck from Krishna Memani, Chief Investment Officer of Oppenheimer Funds. He thinks the present bull market will continue for another year and opens his argument with this colorful graphic. (I could not find an actual link to the website, but if Krishna will send it to me I will post it next week.)
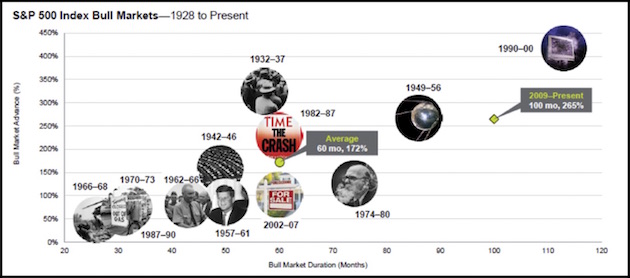
Each circle represents a bull market that occurred since 1928. The vertical axis shows percentage gains, and the horizontal axis duration. The current bull is the second-longest and has the third-highest gain. It will be the longest stock bull market of the modern era if it can last another two years or so.
Here’s Memani:
For some investors, the sheer age of this cycle is enough to cause consternation. Yet there is nothing magical about the passage of time. As we have said time and again, bull markets do not die of old age. Like people, bull markets ultimately die when the system can no longer fight off maladies. In order for the cycle to end there needs to be a catalyst – either a major policy mistake or a significant economic disruption in one of the world’s major economies. In our view, neither appears to be in the offing.
He goes on to list 15 specific events he thinks would be necessary to make him abandon his bullish position. (Comments in parentheses and italics are mine.)
1. Global growth would have had to decelerate. It is not.
(European growth is actually picking up. Germany blinked on financing Italian bank debt, and the markets now have more confidence that Draghi can do whatever it takes.)
2. Wages and inflation would have had to rise. They are not.
3. The Fed would have planned to tighten monetary policy significantly. It is not.
(They should have been raising rates four years ago. It is too late in the cycle now. They may raise rates once more, but the paltry amount of “quantitative tightening” they are likely to do is not going to amount to much. In fact, if for some reason they decided to go further with rate hikes and enter a real quantitative tightening cycle, their monetary policy error would probably trigger a recession and a deep bear market. I think they realize that – or at least I hope they do.)
4. The ECB would have to tighten policy substantially. It will likely not.
(Draghi will go through the motions, though he knows he is limited in what he can actually do – unless for some unexpected reason Europe takes off to the upside. And while Eastern Europe is actually doing that, “Old Europe” is not.)
5. Credit growth would have had to be surging. It is not.
(Credit growth is generally picking up but not surging. And most of the credit growth is in government debt.)
6. Corporate animal spirits would have been taking off. They are not.
(That is basically true for most public corporations. There are a number of private companies and smaller businesses that are pretty optimistic. See my story below.)
7. Equities would have had to be expensive relative to bonds. They are not.
8. FAANG stocks would have had to be at extreme valuations. They are not.
(I don’t think I buy this one.)
9. Investors would have had to be euphoric about equities. They are not.
10. The current cyclical rally within the secular bull would have had to be old and stretched. It is not.
(Not buying this one either.)
11. High-yield spreads would have had to be widening. They are not.
(I pay attention to high-yield spreads, a classic warning sign of a turn in market behavior. Are they at dangerous levels? Damn, Skippy, I cannot believe some of the bonds that are being sold out in the marketplace. Not that I can’t believe the sellers are willing to take the money – you’d have to be an idiot not to take free money with no strings attached. I just don’t understand why major institutions are buying this nonsense.)
12. The classic signs of excess would have had to be evident. They are not.
(Kind of, sort of, but we are really beginning to stretch the point.)
13. China’s credit binge would have had to threaten the global financial system. It does not.
(Xi has somehow managed to push off the credit crisis, at least for the rest of this year, until after the five-year Congress. Rather amazing.)
14. Global trade would have had to be weakening. It is not.
15. The US dollar would have had to be strengthening. It is not.
That’s quite a list. Seeing it with the charts and Memani’s comments makes it even more compelling. To pick just one for closer scrutiny, let’s consider #7. Are equities expensive relative to bonds?
That’s a good question because it really matters to big, long-term investors like pension funds. Pension fund managers need to meet certain return targets, and they want to put the odds on their side. Treasury bonds offer certainty – presuming the US government doesn’t default. (Ask me about that again in October.) Stocks may offer higher returns but more variation.
Memani explains this relationship by looking at earnings yield. That’s the inverse of the P/E ratio. Essentially, it’s the percentage of each dollar invested in a stock that comes back as profits. Some gets distributed via dividends, buybacks, etc., and some is retained. Compare earnings yield to the 10-year Treasury yield over time and you get this:
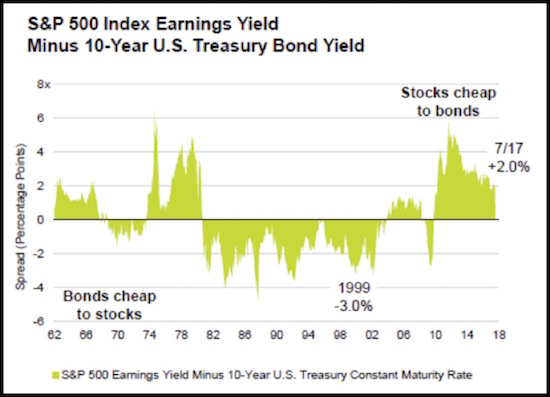
If you think there’s a stock mania today akin to the euphoria of the late 1990s, you’ll find no support in this graph. Back then, bonds were dirt cheap compared to stock market earnings yield. Now we have the reverse: stocks are cheap compared to bonds.
This is one of the most convincing bullish arguments I see now. I remember the late ’90s very well. I called the top about three years early, never dreaming we could see a year like 1999. That will always be my mania benchmark – and today we are not even remotely near it. I don’t remember thinking much about bonds back then. No one else was, either. But buying them would have turned out much better than buying stocks in 1997–99.
At Camp Kotok on Saturday we had a different “old Maine” guide than we’ve had in the past. Guiding is a side business for him. He is a 4th-generation millworker who runs a nice small-business operation in Bangor, like his dad and granddad and family before that. If you want high-end woodworking, he’s one of the go-to guys in that part of Maine. Naturally, I asked him how business is and has been over the years.
He talked about the ups and downs and then said something that piqued my interest. Business had been flat to down for 2015 and 2016. He said the day after the election, it was like somebody switched the lights on. He now has an 18-month backlog. He’s got every worker he can find going at it. Note: He wasn’t particularly a Trump fan, but he did acknowledge that the election really ignited not only his but other small businesses in the area. And you can see that in the confidence surveys.
Let me end this letter by quoting from my friend Sam Rines’ missive today:
The “Trump bump” has been declared dead. That is simply not true – yet. So where is the Trump bump hiding? For one, business confidence remains at its highest level since the second quarter of 2014, according to the Business Roundtable CEO Economic Outlook Survey. And it is not just CEOs; consumers feel the same way – only better. Consumers feel the best they have in a long time. The Conference Board’s Consumer Confidence Survey sits near a sixteen-year high. But this will not last forever. The policies that led to Trump bump need to come to fruition to maintain the dwindling euphoria.
Initial jobless claims remain quite low. The August Markit US manufacturing and services composite index rose 1.4 points to 56, its highest level since May 2015. The breakdown was mixed, though, as manufacturing fell 0.8 points to 52.5 but was more than offset by a 2.2-point increase in the services component, to 56.9. Markit highlighted the bifurcation in the release by saying, “The US economic growth story remained a tale of 2 sectors in August.”
Base metal prices are actually rising, which is a sign of increased global demand and recovery.
If for some reason we have a cyclical correction in what is otherwise a bull market, I would look for an active V-shaped recovery. Think 1987 and 1988. We won’t get an honest-to-God bear market with a long, drawn-out recovery, which would be worse next cycle because of the overwhelming debt that is going to be a drag on growth. That is, we won’t see a real bear until we get a recession. But dear gods, you do not want to be long anything (other than bonds) when we get close to a recession.
For now it’s basically a bull market. My own management system has reduced overall equity exposure over the last five years, but we’re still significantly long. If you would like more detail on how I think you should manage your money in these times, you can go to MauldinSolutions.com, give us some simple information, and we will get you my white paper and updates. If you are an independent US advisor or broker and looking for a way to manage client portfolio risk, I hold monthly meetings at my home where I serve chili and prime, and then the next morning you can sit down with my managers and talk about what we are doing that is significantly different from what most other advisers are doing. I encourage you to think about joining Team Mauldin.
Colorado, Chicago, Lisbon, Denver, and Lugano
As I write this, I am actually on a plane flying to Denver, where Shane and I will grab a car and drive to Beaver Creek for four days, then return to Denver, where I will be meeting with advisors in the area on Wednesday and Thursday, getting home in time to celebrate Labor Day with the family.
Late in September I will be in Chicago for two days for a speech, fly out the next day for Lisbon, and return to Dallas to speak at the Dallas Money Show on October 5–6. I will speak at an alternative investments conference in Denver October 23–24 (details in future letters). I will again be in Denver November 6 and 7, speaking for the CFA Society and holding meetings. After a lot of small back-and-forth flights in November, I’ll end up in Lugano, Switzerland, right before Thanksgiving. Busy times.
With all of my research and the launch of the new business, I’ve been especially busy. Making the Mauldin Solutions announcement and putting myself out there has opened up all sorts of new possibilities, some of which must be explored. Thankfully, I have very competent partners and associates who can help me sort through everything and follow up. Cautious optimist that I am, I’m admittedly surprised by the large response that we’ve had so far. First-World problem, of course. Frankly, an entrepreneur’s dream. I truly believe that with some of the exciting additions that we’re putting in place, I’m going to be able to give you a much broader range of possibilities for making it through the next 10 years, during and after the Great Reset.
Someone asked me the other day, what is my driver? What gets me going in the morning? I have all sorts of answers to that question, but one strong motivation is that all of the research I’ve done on where our future is going makes me believe that the vast majority of investors, my fellow Americans, and much of the world are not ready to deal with the Great Reset. The rules of investing are going to change – not the basics, but the techniques and strategies that will work. We’ve seen such changes in the past. We are getting ready to go through something no less tumultuous than the 1870s and 1880s. Go back and read about Cornelius Vanderbilt and his contemporaries. They were building an investment world where the rules were literally made up as they went along. We are going to have to be equally inventive.
What drives me is that I want to help my readers and my friends not only to get through what’s coming but also to take full advantage of all the new opportunities. And to avoid the pitfalls, of course. I think this is going to be one of the most exciting, transformative times in human history.
And with that, you now find me sitting in the Admirals Club in the Denver Intl. Airport, getting ready to hit the send button and then let Shane drive while I read yet more research. How did I ever get along without her? Nowhere near as well, as she points out from time to time.
Your feeling like I’m living a dream analyst,

John Mauldin
subscribers@MauldinEconomics.com
Copyright 2017 John Mauldin. All Rights Reserved.

Strengths
- The best performing precious metal for the week was gold, closely followed by silver, up in tandem 0.56 percent and 0.47 percent, respectively, after a see-saw week in price action for the metals. Prices have been choppy over the last seven trading sessions but have held onto recent gains.
- As reported by ZeroHedge, the price of gold started moving up on Friday after Dallas Federal Reserve Bank President Robert Kaplan spoke on Bloomberg TV. Kaplan, who shared his thoughts ahead of Janet Yellen’s speech, said that a market correction wouldn’t necessarily hurt the economy, but instead could be healthy. The dollar also headed lower Friday after Yellen’s speech that left the possibility of a rate hike up to interpretation.
- Some investors have been pulling money from ETFs betting on gold, but hedge funds are flocking to gold, reports the Financial Times. According to the article, buying of gold futures contracts by hedge funds and other speculators has surged a record $19 billion or 474 tonnes over the past month. Analysts say this movement is spurred by concern over “lofty equity market valuations and geopolitical tensions.” Just prior to Yellen’s speech on Friday, futures contracts representing 2 million ounces of gold crossed hands, keeping the trend alive.
Weaknesses
- The worst performing precious metal for the week was platinum, down just 0.44 percent on little price-moving news over the course of the week.
- Tahoe Resources took another leg down, about 19 percent of Friday, as news from a Guatemalan Constitutional Court issued a decision to uphold the lower court’s preliminary decision to suspend mining at its Escobal Mine.
- Gold prices fell lower on Thursday as investors awaited signs on interest rates from the Jackson Hole Economic Summit, along with pressure from a firmer dollar, reports Reuters. Gold failed to break through the top of its $1,200 – $1,300 range in April and June of this year as well, but with the threat from Trump of a government shutdown, there is still underlying support for the yellow metal.
Opportunities
- The president of Novo Resources has spent 13 years searching for clues that back a hunch, reports Bloomberg: that the world’s biggest gold resource has lost siblings elsewhere on the planet. Now Quinton Tood Hennigh thinks he may have found what he has been looking for near Australia’s northwest coast. In July, Novo zeroed in on a gold find that’s confounded geologists and sparked a 500-percent surge in the company’s share price, writes Bloomberg. Hennigh admits he isn’t 100 percent sure that this will turn into a mine, but the potential upside is seen by some as huge.
- Traders have pushed gold futures to near a nine-month high, reports Bloomberg, but if the history of gold’s relationship with oil is any guide, the surge in the yellow metal could last longer than the flare-up in geopolitical tension. Looking at the chart below, the current price divergence in oil and gold may still be going (meaning gold should continue to outperform oil before the roughly 34-month cycle ends).

- Bank of America Merrill Lynch has a bullish outlook on gold and believes the price could surge to $1,400 an ounce early next year, reports Kitco News. The bank’s global head of commodities research, Francisco Blanch, says one major catalyst for this could be the European Central Bank embarking on a tightening cycle. Nearer term, Trump’s threat to shut the government down, (unless Congress agrees to fund the border wall with Mexico) with the approaching debt ceiling coming into focus, could generate enough uncertainty to spark a convincing rally through $1,300 per ounce.
Threats
- More of China’s consumers “are giving up substance for style when it comes to gold,” reports The Asian Review. Happy to buy less-pure pieces if it means keeping up with the latest trends, sales of platinum and 18-karat gold pieces in China climbed 22 percent on the year for the April-June quarter. China is the world’s second-largest gold consumer, “but overall consumption of the yellow metal in China could start to dip if 18- and 22-karat jewelry gains traction,” the article continues.
- Investors have made a fortune on palladium this year; in fact, the metal surged 38 percent to its highest price since 2001, reports Bloomberg. That’s the good news. The bad news? ETFs that track the precious metal have lost more than $49 million as investors are cashing out. “The explanation for the outflows lies in part in the scarcity of physical palladium and a robust borrowing market that has developed among users and speculators,” the article reads.
- Is the Brazilian government trying to balance the books on the back of the Amazon jungle? Opening an area for mining known as Renca or the National Reserve of Copper and Associates, which was set aside by the military government three decades ago to safeguard resources and sovereignty, is drawing plenty of criticism from environmental groups. Belo Sun Mining has had its mining permits in limbo after indigenous groups got the company’s mining license suspended.

 “A resilient financial system is critical to a dynamic global economy — the subject of this conference. A well-functioning financial system facilitates productive investment and new business formation and helps new and existing businesses weather the ups and downs of the business cycle.” Janet Yellen, “Financial Stability a Decade after the Onset of the Crisis,” August 25, 2017
I would add that a well-functioning financial system is critical to long-term social, political and geopolitical stability. Importantly, well-functioning finance would have mechanisms that promote adjustment and self-correction. This is fundamental to market-based systems. I would argue that this is also a basic premise of sound money and finance. Sound finance would neither suppress market volatility nor work to repeal business cycles – but would instead have inherent characteristics that counteract protracted market and economic excess.
For starters, I question whether a so-called “resilient financial system” is necessarily a sound one. As we have witnessed, obtrusive government measures can dictate “resilience” – in terms of extended sanguine backdrops free from volatility, risk aversion and crisis. Yet this type of resilience fosters excesses that can inevitably end with a financial and economic crash.
Ten years ago most would have argued forcefully that the system at the time was resilient. Chair Yellen argues in her Jackson Hole paper that myriad regulatory changes have created a much more resilient financial system and economy. Her long speech highlights a laundry list of measures put in place since the crisis. Much to my liking, 22 footnotes include references to even Minsky, Kindleberger and Charles Mackay.
There was also footnote #2: “A contemporaneous perspective on subprime mortgage market developments at this time is provided in Ben S. Bernanke (2007), “The Subprime Mortgage Market,” speech delivered… May 17 (2007).”
Looking back, chairman Bernanke presented a knowledgeable understanding of the subprime industry in 2007. His deeply flawed understanding of the macro backdrop was captured in a single sentence: “In general, mortgage credit quality has been very solid in recent years.”
Total mortgage Credit had doubled in less than seven years. Indicators of excess were everywhere. Inflation psychology had taken deep root throughout the nation’s housing markets, with California housing prices spiraling ever higher. The inflationary backdrop ensured a proliferation of new mortgage products that kept the game going with low monthly payments for prime and subprime borrower alike.
As someone who chronicled the mortgage finance Bubble in its entirety on a weekly basis, it was all too conspicuous. This was the most important market for finance (mortgages) and the real economy (housing and home-related) – that was dominated by the thinly capitalized GSE with their implied federal backing. It was a sophisticated financial scheme. Measures going back to the Greenspan era (bolstered by “helicopter Ben” musings) convinced the markets that the Fed would respond aggressively to avert market crisis. Surely, Washington would never allow a housing bust. It would simply be too devastating. In an irony of recent Bubbles, the greater they inflate the more convinced markets become that officials will not permit a bust.
What might explain Bernanke’s indifference to unprecedented mortgage and housing risks? Well, his policy doctrine was at the heart of the problem: Dr. Bernanke had been a leading proponent for using mortgage finance to reflate the system after the bursting of the “tech” Bubble.
Yellen: “Repeating a familiar pattern, the ‘madness of crowds’ had contributed to a bubble, in which investors and households expected rapid appreciation in house prices. The long period of economic stability beginning in the 1980s had led to complacency about potential risks, and the buildup of risk was not widely recognized. …A self-reinforcing loop developed, …as investors sought ways to gain exposure to the rising prices of assets linked to housing and the financial sector. As a result, securitization and the development of complex derivatives products distributed risk across institutions in ways that were opaque and ultimately destabilizing. In response, policymakers around the world have put in place measures to limit a future buildup of similar vulnerabilities.”
As I’ve written in the past, I understand why officials did what they did back in the autumn of 2008. Clearly, they were not about to sit back and watch the system collapse. They would also not settle for mere stabilization. Their epic mistake was to push forward with aggressive reflationary policies – a global monetary inflation regime to which they remain entrapped nine years later. While post-“tech” Bubble reflation focused on mortgage Credit and housing, post-mortgage finance Bubble reflationary measures went much farther: reflate risk assets (equities, corporate debt and housing), collapse market yields and force savers out of the safety of deposits and money funds. It was the same flawed doctrine that had nurtured the “worst crisis since the Great Depression” – but on a much grander scale.
If there was the “madness of crowds” then, how about these days with Trillions flowing into passive ETFs, record corporate debt issuance, record securities and home prices, a proliferation of cryptocurrencies and a bubbling derivatives marketplace. So long as the Fed targets higher asset prices while repeatedly providing liquidity backstops, a culture of speculation becomes only more deeply entrenched.
Yellen’s speech makes repeated mention of “too big to fail” – and how policy measures have dealt with this leading element of the previous crisis. In reality, central bankers have ensured that “too big to fail” moral hazard has mushroomed from an issue with respect to large financial institutions to a critical facet afflicting global securities and derivatives market pricing.
Yellen’s speech, “Financial Stability a Decade after the Onset of the Crisis,” somehow doesn’t address the historic experiment with quantitative easing (QE). There’s no mention of the Fed (and global central banks) repeatedly responding to incipient market instability (with QE, an extension of monetary stimulus, or a postponement of “normalization”). The powerful doctrine of the Fed “pushing back against a tightening of financial conditions” is omitted from the discussion. The Fed chair largely avoids monetary policy altogether.
Bernanke had his “mortgage credit quality has been very solid…” For Yellen, it’s “evidence shows that reforms since the crisis have made the financial system substantially safer.” If the Yellen Fed believed as much, I doubt rates would be at 1.25% and their balance sheet would remain ballooned at $4.4 TN.
Yellen: “Investors have recognized the progress achieved toward ending too-big-to-fail… Credit default swaps for the large banks also suggest that market participants assign a low probability to the distress of a large U.S. banking firm.”
I would caution against calling out low bank CDS prices as evidence of progress toward ending too-big-to-fail. CDS is atypically low across the spectrum of corporate borrowers. Indeed, sovereign CDS pricing is unusually inexpensive around the globe despite a huge run up in debt loads (Italy 148bps!). And then there’s the historically low VIX that astute analysts argue has been disregarding risk. Low risk premiums across various asset classes – at home and abroad – are consistent with market perceptions that central bankers are committed to liquidity backstopping necessary to safeguard against another crisis. “Too big to fail” has never had such momentous market impacts.
Yellen: “Our more resilient financial system is better prepared to absorb, rather than amplify, adverse shocks, as has been illustrated during periods of market turbulence in recent years. Enhanced resilience supports the ability of banks and other financial institutions to lend, thereby supporting economic growth through good times and bad.”
Resilience over recent years has clearly been associated with concerted open-ended QE from all the world’s leading central banks. It would also appear that chair Yellen overly emphasizes traditional banking when referencing the “financial system.” “Banks are safer. The risk of runs owing to maturity transformation is reduced.”
It’s worth recalling that traditional bank runs were not much of an issue during the previous crisis. Traditional old Market Panic was. As they will do, long periods of market greed erupted into fear and panic. The acute issue was “repo” financing of large institutions financing MBS holdings – along with what a Wall Street liquidity crisis meant for the pricing of mortgage-related finance and the functioning of derivatives more generally. Investor panic was sparked by the loss of faith in the safety and liquidity of repo “money.” Yet the overriding issue remained the mispricing of Trillions of MBS and mortgage-related securities and derivatives. I’ve always argued that a repricing of mortgage debt – and risk more generally – was inevitable, and that major financial and economic repercussions were unavoidable. Bubbles are not forever.
There is no doubt in my mind that today’s issue of securities mispricing dwarfs the mortgage finance Bubble period. I also believe latent derivatives market-related instability (i.e. market “insurance”) also likely exceeds pre-2008 crisis levels. Less clear is where an acute liquidity episode could initially manifest. Lehman and the cadre of leveraged speculators borrowing in the short-term repo market to finance long duration mortgage securities was rather egregious.
Financial crisis typically erupts in the “money” markets. This is where risk is perceived to be minimal, yet it is at the same time the domain of aggressive risk intermediation that works to distort overall market dynamics. Throughout the mortgage finance Bubble period, “Wall Street Alchemy” transformed progressively riskier mortgages into endless perceived safe and liquid “money”-like instruments – “The Moneyness of Credit,” with the “repo” market at the epicenter of perilous risk distortions.
I have argued that unparalleled Fed and global central bank inflationary measures molded the “Moneyness of Risk Assets”. In particular, central bank backing ensured that inflating markets in equities and corporate Credit came to be perceived as low-risk stores of value. And with the proliferation of (perceived liquid) fund choices available in the marketplace (ETFs in particular), central banks coupled with Wall Street Alchemy achieved the incredible: the transformation of high-risk securities – with ever-rising prices – into perceived “money”-like instruments.
Returning to the above opening paragraph extracted from Yellen’s speech, I believe it is important to contemplate whether market resilience has been due to sound financial system structure or instead because of central bank-induced market distortions and liquidity backstops. If the latter, it is critical to appreciate that this extended period of “resiliency” has ensured cumulative financial distortions and Bubble Economy Maladjustment – on an unparalleled global scale. With tens of Trillions of mispriced securities globally, a painful bout of repricing is unavoidable.
We’ll see how resilient “the financial system” proves to be come the unmasking of risk market liquidity and safety misperceptions. It’s a curious discussion of “Financial Stability a Decade after the Onset of the Crisis,” that glosses over near zero rates, unending QE, Trillions of global debt securities trading with negative yields and the extraordinary expansion of the ETF complex. It recalls Alan Greenspan’s speeches – the reasoned analysis along with the intrigue of what went unsaid. For me, it’s disingenuous and lacks credibility.
For the Week:
The S&P500 increased 0.7% (up 9.1% y-t-d), and the Dow rose 0.6% (up 10.4%). The Utilities gained 1.1% (up 12%). The Banks advanced 1.0% (up 2.3%), and the Broker/Dealers rallied 1.1% (up 10.5%). The Transports increased 0.4% (up 1.0%). The S&P 400 Midcaps gained 1.0% (up 2.9%), and the small cap Russell 2000 recovered 1.4% (up 1.4%). The Nasdaq100 added 0.5% (up 19.7%), and the Morgan Stanley High Tech index rose 1.2% (up 25.5%). The Semiconductors gained 0.8% (up 19.2%). The Biotechs surged 2.6% (up 26.3%). With bullion up $7, the HUI gold index jumped 2.4% (up 10.3%).
Three-month Treasury bill rates ended the week at 99 bps. Two-year government yields gained three bps to 1.33% (up 14bps y-t-d). Five-year T-note yields were unchanged at 1.76% (down 17bps). Ten-year Treasury yields declined three bps to 2.17% (down 28bps). Long bond yields fell three bps to 2.75% (down 32bps).
Greek 10-year yields fell nine bps to 5.49% (down 153bps y-t-d). Ten-year Portuguese yields jumped 10 bps to 2.87% (down 88bps). Italian 10-year yields rose seven bps to 2.10% (up 29bps). Spain’s 10-year yields increased five bps to 1.61% (up 23bps). German bund yields slipped three bps to 0.38% (up 18bps). French yields declined two bps to 0.70% (up 1bp). The French to German 10-year bond spread widened one to 32 bps. U.K. 10-year gilt yields fell four bps to 1.05% (down 18bps). U.K.’s FTSE equities index rose 1.1% (up 3.6%).
Japan’s Nikkei 225 equities index was little changed (up 1.8% y-t-d). Japanese 10-year “JGB” yields slipped a basis point to 0.02% (down 2bps). France’s CAC40 slipped 0.2% (up 5.0%). The German DAX equities index was unchanged (up 6.0%). Spain’s IBEX 35 equities index declined 0.4% (up 10.6%). Italy’s FTSE MIB index dipped 0.3% (up 13.1%). EM equities were higher. Brazil’s Bovespa index surged 3.4% (up 18%), and Mexico’s Bolsa added 0.6% (up 12.6%). South Korea’s Kospi gained 0.9% (up 17.4%). India’s Sensex equities index added 0.2% (up 18.7%). China’s Shanghai Exchange jumped 1.9% (up 7.3%). Turkey’s Borsa Istanbul National 100 index rose 2.4% (up 40.5%). Russia’s MICEX equities index rose 2.5% (down 11.4%).
Junk bond mutual funds saw outflows of $1.01 billion (from Lipper).
Freddie Mac 30-year fixed mortgage rates slipped three bps to 3.86% (up 43bps y-o-y). Fifteen-year rates were unchanged at 3.16% (up 42bps). The five-year hybrid ARM rate added a basis point to 3.17% (up 42bps). Bankrate’s survey of jumbo mortgage borrowing costs had 30-yr fixed rates down four bps to 4.03% (up 46bps).
Federal Reserve Credit last week declined $5.4bn to $4.426 TN. Over the past year, Fed Credit declined $13.0bn. Fed Credit inflated $1.614 TN, or 58%, over the past 250 weeks. Elsewhere, Fed holdings for foreign owners of Treasury, Agency Debt gained $9.0bn last week to $3.342 TN. “Custody holdings” were up $135bn y-o-y, or 4.2%.
M2 (narrow) “money” supply last week expanded $11.5bn to a record $13.629 TN. “Narrow money” expanded $691bn, or 5.3%, over the past year. For the week, Currency increased $2.4bn. Total Checkable Deposits jumped $62bn, while Savings Deposits fell $59.2bn. Small Time Deposits gained $3.7bn. Retail Money Funds added $2.7bn.
Total money market fund assets jumped $29.65bn to a 2017 high $2.736 TN. Money Funds added $1.1bn y-o-y.
Total Commercial Paper rose $9.0bn to $996.5bn. CP declined $7.4bn y-o-y, or 0.7%.
Currency Watch:
The U.S. dollar index declined 0.7% to 92.74 (down 9.4% y-t-d). For the week on the upside, the Norwegian krone increased 2.0%, the Swedish krona 1.9%, the euro 1.4%, the South Korean won 1.2%, the Canadian dollar 0.8%, the Swiss franc 0.8%, the Mexican peso 0.5%, the Singapore dollar 0.5% and the British pound 0.1%. On the downside, the New Zealand dollar declined 1.0%, the Brazilian real 0.4% and the Japanese yen 0.2%. The Chinese renminbi gained 0.36% versus the dollar this week (up 4.49% y-t-d).
Commodities Watch:
The Goldman Sachs Commodities Index slipped 0.4% (down 4.9% y-t-d). Spot Gold added 0.6% to $1,291 (up 12.1%). Silver rose 0.8% to $17.132 (up 7.2%). Crude fell 64 cents to $47.87 (down 11.1%). Gasoline jumped 2.6% (unchanged), while Natural Gas was little changed (down 23%). Copper surged 3.2% (up 22%). Wheat dropped 1.6% (up 7%). Corn sank 3.3% (unchanged).
Trump Administration Watch:
August 25 – Financial Times (Demetri Sevastopulo, Shawn Donnan and Gillian Tett): “Donald Trump will launch a major push on tax reform next week with a speech in Missouri, as the president shifts focus to fiscal policy in an effort to secure a badly needed first big legislative victory by the end of the year. Gary Cohn, head of the White House national economic council, told the Financial Times that the speech… would be the first in a series of addresses designed to convince the US public about the need to revamp a tax system that has remained largely unchanged for three decades. ‘Starting next week, the president’s agenda and calendar is going to revolve around tax reform,’ Mr Cohn said… ‘He will start being on the road making major addresses justifying the reasoning for tax reform and why we need it in the US.'”
August 23 – Reuters (Steve Holland and Dave Graham): “President Donald Trump delivered an angry and forceful defense of his response to the violence in Charlottesville, Virginia, declaring at a campaign-style rally of supporters in Phoenix that the news media had distorted his position. Addressing thousands of supporters… at the Phoenix Convention Center, Trump accused major media organizations of being ‘dishonest” and of failing ‘to report that I spoke out forcefully against hatred, bigotry.’ Trump spent more than 20 minutes of a 75-minute speech delivering a selective account of his handling of the violence in Charlottesville, where he overlooked his initial statement blaming ‘many sides,’ as well his subsequent remarks that there were good people marching alongside the white supremacists.”
August 23 – Wall Street Journal (Kristina Peterson and Siobhan Hughes): “President Donald Trump’s threat to shut down the government if Congress doesn’t approve funding for a wall along the Mexico border raised alarm among some GOP lawmakers, injecting new volatility into an already uncertain political climate this fall. Lawmakers returning to Washington in early September have a dozen days with both the House and Senate in session before the government’s current funding expires on Oct. 1. Lawmakers from both parties had expected Congress to pass a stopgap two- or three-month spending bill, but Mr. Trump’s remarks raised fresh questions about the path forward. The GOP president said… that he was prepared to dig in over his request for $1.6 billion toward the border wall, one of his signature campaign promises.”
August 23 – Reuters: “Credit ratings agency Fitch Ratings… said a failure by U.S. officials to raise the federal debt ceiling in a timely manner would prompt it to review the U.S. sovereign rating, ‘with potentially negative implications.’ Fitch, which currently assigns the United States its highest rating — ‘AAA’ — said in a statement that the prioritization of debt service payments over other government obligations, should the debt ceiling not be raised, ‘may not be compatible with ‘AAA’ status.’ Without the ability to sell more debt, the government is expected to run out of cash, possibly in early October, and faces the risk of not paying the interest and principal on its debt on time.”
August 20 – Financial Times (Shawn Donnan): “The Trump administration has decided to push hard for tax reform and dial down a controversial national security investigation into steel imports in a bid to swing Republican support behind the president after the turmoil of recent weeks, according to senior officials. They said that former marine general John Kelly, the new chief of staff, was leading efforts to restore order to the White House and reassure Republican leaders alarmed by Donald Trump’s equivocal reaction to white nationalist-fueled violence in Virginia last week and the subsequent open criticism from business leaders.”
August 23 – Reuters (Steve Holland and Dave Graham): “U.S. President Donald Trump warned… he might terminate the NAFTA trade treaty with Mexico and Canada after three-way talks failed to bridge deep differences. The United States, Canada and Mexico wrapped up their first round of talks on Sunday to revamp the trade pact with little sign of a breakthrough coming. Trump reopened negotiations of the 1994 treaty out of concern U.S. economic interests were suffering. ‘Personally, I don’t think we can make a deal. I think we’ll probably end up terminating NAFTA at some point,’ Trump said… Suggesting a termination might help jumpstart the negotiations, Trump said: ‘I personally don’t think you can make a deal without a termination.'”
August 22 – Bloomberg (Sahil Kapur): “A growing number of key congressional Republicans are considering a controversial maneuver that would allow for about $450 billion of tax cuts without offsets, according to four congressional aides… Under the proposal, the GOP would not account for things like expiring tax breaks when gauging the budgetary impact of tax legislation — giving tax writers more room for cuts. Senate budget and tax panels are discussing the move to a ‘current policy’ baseline — instead of the standard ‘current law’ baseline… The chief House tax writer, Kevin Brady, also signaled openness to the approach last month, saying it would lead to deeper tax cuts. The switch would risk a backlash from Democrats and deficit hawks.”
August 22 – CNBC (Christine Wang): “President Donald Trump and Senate Majority Leader Mitch McConnell haven’t spoken to each other in weeks, The New York Times reported… The newspaper said that one phone call between the president and the Kentucky Republican devolved into a ‘profane shouting match.’ Relations between the two men have been conspicuously tense. Trump has repeatedly slammed McConnell on Twitter, blaming him for the failure of the GOP’s attempts to repeal and replace the Affordable Care Act.”
August 19 – Wall Street Journal (Michael C. Bender and Peter Nicholas): “President Donald Trump ousted chief strategist Steve Bannon on Friday, as newly minted Chief of Staff John Kelly sought to bring order to an administration riven by infighting and power struggles, and increasingly at odds with congressional leaders. Mr. Bannon’s departure marked the fourth senior official in five weeks—and sixth in seven months—to leave the Trump administration… A former investment banker and media executive, Mr. Bannon was most closely aligned with the president’s ‘America First’ agenda, which he described as economic nationalism.”
China Bubble Watch:
August 23 – Bloomberg: “China keeps tightening the screws in its campaign to reduce the mountain of debt. The latest curbs landed late Wednesday, with the banking watchdog targeting wealth-management products that have more than tripled in the past four years amid low deposit rates and curbs on financing to overheated industries. Lenders will need to record all WMP sales starting Oct. 20, after some ‘misled’ consumers or sold them without regulators’ permission. While the consensus is that China still has a long way to go when it comes to actual deleveraging, it seems to have at least reined in the credit-growth beast, with WMPs plateauing since the crackdown was intensified in April.”
August 19 – Reuters (Ma Rong and John Ruwitch): “China will strengthen oversight of arbitrage that takes advantage of uncoordinated regulations and increase penalties to try to prevent structural risks from getting out of control, a senior central banker said. Yin Yong, deputy governor of the People’s Bank of China, told a conference… six forms of arbitrage were problematic. He said they involved differing maturities, credit conditions, investment liquidity, exchange rates, capital and information. ‘These six forms of malicious regulatory arbitrage, which circumvent the regulatory system and its arrangements, and take advantage of the incompleteness of regulation, could result in risks to the entire financial system getting out of control,’ he said. Chinese financial regulators have adopted a slew of ‘de-risking’ measures this year in the face of ballooning debt and have ramped up efforts to unearth hidden problems that could become systemic threats.”
August 23 – Reuters (Yawen Chen and Elias Glenn): “China will use all necessary means to defend the interests of the country and its companies against a U.S. trade investigation, a spokesman for the Ministry of Commerce said… The ministry… expressed ‘strong dissatisfaction’ with the U.S. launch of the probe into China’s alleged theft of U.S. intellectual property, calling it ‘irresponsible’. The probe is the Trump administration’s first direct measure against Chinese trade practices, which the White House and U.S. business groups say are bruising American industry.”
August 22 – Wall Street Journal (Yifan Xie and Biman Mukherji): “China metal prices tumbled Wednesday as sentiment was battered by fresh warnings that the recent steel rally was unsustainable, the latest move by regulators to tame volatility in the futures market. The main steel-rebar futures contract in Shanghai snapped a four-day rally to trade down 4.9% by midday Wednesday at 3,744 yuan ($562) a metric ton…, while hot-rolled coil futures tumbled 5.3% to 3,828 yuan a ton. On the Dalian Commodity Exchange, iron-ore futures fell 4.5% to 574.5 yuan a ton, after soaring more than 20% over the past four sessions.”
Central Bank Watch:
August 22 – BBC: “European Central Bank President Mario Draghi has said unconventional policies like quantitative easing (QE) have been a success both sides of the Atlantic. QE was introduced as an emergency measure during the financial crisis to pump money directly into the financial system and keep banks lending. A decade later, the stimulus policies are still in place, but he said they have ‘made the world more resilient’… Central bankers, including Mr Draghi, are meeting in Jackson Hole, Wyoming, later this week, where they are expected to discuss how to wind back QE without hurting the economy. On Monday, a former UK Treasury official likened the stimulus to ‘heroin’ because it has been so difficult to wean the UK, US and eurozone economies off it.”
Global Bubble Watch:
August 22 – Financial Times (Laurence Mutkin): “Since the financial crisis erupted in 2008, a significant source of demand in the world’s largest bond markets has been central banks. The quantitative easing policies that institutions, including the US Federal Reserve, European Central Bank and Bank of Japan, have adopted to resist deflationary pressures unleashed by the crisis have consisted mostly of buying government bonds. A decade on, the threat of deflation has faded (at least for now) and so the pace of bond buying by central banks, which has already moderated, is set to fall sharply next year if the ECB and the Fed announce the changes to their QE policies in coming months. Given the very low levels of yields, this poses a significant threat to the pricing of bonds — and possibly of other financial assets too. The ECB and the BoJ are continuing their QE programmes, printing money to buy more bonds every month, and the Fed and the Bank of England — although no longer increasing their balance sheets — are still reinvesting the proceeds of maturing bonds previously bought under their programmes.”
August 21 – Bloomberg (Jean-Michel Paul): “Quantitative easing, which saw major central banks buying government bonds outright and quadrupling their balance sheets since 2008 to $15 trillion, has boosted asset prices across the board. That was the aim: to counter a severe economic downturn and to save a financial system close to the brink. Little thought, however, was put into the longer-term consequences of these actions. From 2008 to 2015, the nominal value of the global stock of investable assets has increased by about 40%, to over $500 trillion from over $350 trillion. Yet the real assets behind these numbers changed little, reflecting, in effect, the asset-inflationary nature of quantitative easing. The effects of asset inflation are as profound as those of the better-known consumer inflation.”
August 20 – Financial Times (John Authers and Claire Manibog): “The Great Financial Crisis did not turn into a second Great Depression, merely a Great Recession. Asset prices quickly recovered. But did the desperate measures taken then create new bubbles? Quantitative easing… left investors with cash that they had little choice but to put into risky assets. Critics complained that this was ‘printing money,’ and would lead to currency debasement. The havens were traditional stores of value that took on the acronym SWAG: silver, wine, art and gold. By 2012, SWAG assets had formed a bubble. But it deflated as inflation fears receded and confidence in governments returned. Bricks and mortar offered another haven — particularly for those nervous that their countries might not always tolerate their wealth.”
August 22 – Bloomberg (Sid Verma and Cecile Gutscher): “HSBC Holdings Plc, Citigroup Inc. and Morgan Stanley see mounting evidence that global markets are in the last stage of their rallies before a downturn in the business cycle. Analysts at the Wall Street behemoths cite signals including the breakdown of long-standing relationships between stocks, bonds and commodities as well as investors ignoring valuation fundamentals and data. It all means stock and credit markets are at risk of a painful drop. ‘Equities have become less correlated with FX, FX has become less correlated with rates, and everything has become less sensitive to oil,’ Andrew Sheets, Morgan Stanley’s chief cross-asset strategist, wrote… His bank’s model shows assets across the world are the least correlated in almost a decade…”
August 24 – Bloomberg (Robert Brand and Cormac Mullen): “Political instability, money problems and economic growth still top the list of threats to global markets. It’s just that the main players have swapped roles, according to Eurasia Group. ‘For much of the post-crisis period, U.S. money, Chinese growth, and European politics have mattered most’ to investors, …director of global strategy at Eurasia, Karthik Sankaran, wrote… ‘But developments over the past year suggest that markets should be paying attention to U.S. politics, European growth, and Chinese money.'”
Federal Reserve Watch:
August 24 – Bloomberg (Jeanna Smialek and Alessandro Speciale): “Federal Reserve Bank of Kansas City President Esther George said if U.S. economic data hold up, there will probably be an opportunity to raise interest rates again in 2017. ‘I’ll be looking at the data in the next few weeks as we get ready for the September meeting, and see whether that still makes sense,’ George said… ‘Based on what I see today, I think there’s still opportunity to do that,’ she told Bloomberg Television’s Mike McKee…”
U.S. Bubble Watch:
August 23 – Bloomberg (Suzanne Woolley): “In a perfect world, the largest expenses in retirement would be for fun things like travel and entertainment. In the real world, retiree health-care costs can take an unconscionably big bite out of savings. A 65-year-old couple retiring this year will need $275,000 to cover health-care costs throughout retirement, Fidelity Investments said in its annual cost estimate… That stunning number is about 6% higher than it was last year… You might think that number looks high. At 65, you’re eligible for Medicare, after all. But monthly Medicare premiums for Part B (which covers doctor’s visits, surgeries, and more) and Part D (drug coverage) make up 35% of Fidelity’s estimate. The other 65% is the cost-sharing, in and out of Medicare, in co-payments and deductibles, as well as out-of-pocket payments for prescription drugs.”
August 22 – Reuters (Herbert Lash): “The sale price of high-end condominiums in Manhattan’s most expensive neighborhood averaged $14.1 million in the 12 months through June, with one unit going for $65.7 million… The unit, at 432 Park Avenue, billed as the tallest residential tower in the Americas, was one of three at the Midtown East building that were in the top-five most expensive condominium sales in Manhattan, an analysis by CityRealty said. The analysis examined sale prices and what was paid per square foot in an index the realty company has created to gauge investment performance for what it considers the top 100 condominium buildings in Manhattan. The average price per square foot rose 9% to $2,788 in the 12-month period ended June 30…”
Europe Watch:
August 23 – Reuters (Shrutee Sarkar): “Euro zone business growth maintained a solid clip in August, driven by the best manufacturing performance in 6-1/2 years despite a strong euro, easily offsetting a mild slowdown in services growth… Taken together with a mild pickup in price pressures, the data is likely to support expectations that the European Central Bank will proceed later this year with making plans to scale back its multi-billion euro monthly asset purchases.”
August 20 – Financial Times (Kate Allen and Claire Jones): “The European Central Bank may have little choice but to wind down its €2tn bond-buying programme next year — whether eurozone inflation picks up, or not. An improving eurozone economy already led the ECB to scale back its purchases by €20bn a month to €60bn in April, sharpening expectations that policymakers will set out a timeline for further tapering in the next couple of months… While traders will try to glean any indication of the ECB’s intentions, Mr Draghi faces a dilemma of his own: the central bank is running out of bonds to buy. Its own rules restrict it to only purchasing a third of each country’s debt in circulation, and the supply of German Bunds and Portuguese debt in particular is starting to run thin. ‘The 33% issuer limit in Bunds presets a course of [purchase programme] exit, no matter the inflation outlook,’ says Harvinder Sian, a Citigroup analyst.”
August 21 – Financial Times (Izabella Kaminska): “Talk of a domestic parallel currency being introduced in Italy is not new. But it has been reinvigorated this week because of an interview with Silvio Berlusconi (a longstanding proponent of the idea) in Italian publication Libero Quotidiano, where he argues the introduction of a national parallel currency will help Italy regain monetary sovereignty in a way that later supports domestic demand.”
Japan Watch:
August 20 – Reuters (Tetsushi Kajimoto and Izumi Kakagawa): “Confidence at Japanese manufacturers rose in August to its highest level in a decade led by producers of industrial materials, a Reuters poll showed, in a further sign of broadening economic recovery.”
EM Bubble Watch:
August 20 – Bloomberg Businessweek (Anurag Joshi and Anto Antony): “Defaults on bonds and syndicated loans of Indian companies are at a record of almost $2 billion so far this year, compared with $494 million for all of 2016… State Bank of India, the nation’s largest lender by assets, surprised investors this month when it reported bad loans had risen to 10% after the acquisition of smaller lenders. The government’s injection of funds in August into a state-owned bank at risk of missing a coupon payment is beneficial for bondholders but creates a moral hazard by taking pressure of lenders to manage their capital pro-actively, according to Fitch…”
Leveraged Speculation Watch:
August 23 – Financial Times (Joe Rennison): “Hedge funds are embracing an esoteric credit product widely blamed for exacerbating the financial crisis a decade ago, as low volatility and near record prices for corporate debt tempt them into riskier areas to seek higher returns. The market for ‘bespoke tranches’ — bundles of credit default swaps that are tied to the risk of corporate defaults — has more than doubled in the first seven months of 2017. Traders in this opaque, over-the-counter market estimate there has been issuance of $20bn to $30bn this year, compared to $15bn in the whole of 2016 and $10bn in 2015… The surge in activity reflects the effort by investors to generate a higher rate of return during a period of historically low volatility in credit markets, compounded by low fixed rate yields.”
Geopolitical Watch:
August 22 – Reuters (Christine Kim): “North Korean leader Kim Jong Un has ordered more solid-fuel rocket engines…, as he pursues nuclear and missile programs amid a standoff with Washington, but there were signs of tension easing. The report carried by the KCNA news agency lacked the traditionally robust threats against the United States after weeks of unbridled acrimony, and U.S. President Donald Trump expressed optimism about a possible improvement in relations. ‘I respect the fact that he is starting to respect us,’ Trump said of Kim at a raucous campaign rally in Phoenix, Arizona. ‘And maybe – probably not, but maybe – something positive can come about,’ he said.”
August 22 – Reuters (David Brunnstrom and Doina Chiacu): “The United States… imposed new North Korea-related sanctions, targeting Chinese and Russian firms and individuals for supporting Pyongyang’s weapons programs, but stopped short of an anticipated focus on Chinese banks. The U.S. Treasury designated six Chinese-owned entities, one Russian, one North Korean and two based in Singapore. They included a Namibia-based subsidiary of a Chinese company and a North Korean entity operating in Namibia. The sanctions also targeted six individuals – four Russians, one Chinese and one North Korean.”
August 21 – Reuters (Ben Blanchard and Doug Busvine): “China laid the blame at India’s door… for an altercation along their border in the western Himalayas involving soldiers from both of the Asian giants. Both countries’ troops have been embroiled in an eight-week-long standoff on the Doklam plateau in another part of the remote Himalayan region near their disputed frontier. Last week, a source in New Delhi, who had been briefed on the military situation on the border, said soldiers foiled a bid by a group of Chinese troops to enter Indian territory in Ladakh, near Pangong lake.”
August 23 – Reuters (Andrew Osborn): “Russian nuclear-capable strategic bombers have flown a rare mission around the Korean Peninsula at the same time as the United States and South Korea conduct joint military exercises that have infuriated Pyongyang. Russia, which has said it is strongly against any unilateral U.S. military action on the peninsula, said Tupolev-95MS bombers, code named ‘Bears’ by NATO, had flown over the Pacific Ocean, the Sea of Japan, the Yellow Sea and the East China Sea, prompting Japan and Seoul to scramble jets to escort them.”
August 22 – Reuters (Yeganeh Torbati): “The United States suggested… it could cut U.S. aid to Pakistan or downgrade Islamabad’s status as a major non-NATO ally to pressure the South Asian nation to do more to help it with the war in Afghanistan. A day after President Donald Trump committed to an open-ended conflict in Afghanistan and singled out Pakistan for harboring Afghan Taliban insurgents and other militants, U.S. Secretary of State Rex Tillerson said Washington’s relationship with Pakistan would depend on its help against terrorism… U.S. officials are frustrated by what they see as Pakistan’s reluctance to act against groups such as the Afghan Taliban and the Haqqani network that they believe exploit safe haven on Pakistani soil to launch attacks on neighboring Afghanistan.”
 1. European Banks – The Next Crisis – The Unseen Cause in Plain View
by Martin Armstrong
The clouds have not lifted from the heart of the financial center within the European Union on the continent. The origin of the next crisis is unseen yet in plain view if you care to look. Ten years since the financial crisis of 2007-2009, the core fundamental problems in the banking sector have not yet been resolved . Indeed..
2. Some Big Wall Street Players Are Starting to Sweat a Crash
When it comes to the stock market, everything’s always all good… until it isn’t.
And it’s been all good: U.S. stocks have been rallying for nine years, making successive all-time highs, with only sporadic bouts of profit-taking by the Nervous Nellies along the way. But now, some huge investors – marquee names – are getting nervous…..
3. Bob Hoye: CryptoCurrency & Market Tops
Bob Hoye with an in depth discussion on the financial markets and the Bitcoin (BTC) revolution. Since his last visit, BTC has more than doubled soaring from under $2,000 to over $4,500 and the crypto market cap has topped $145 billion. Bob suggests the current price could be nearing an ultimate top. …

-
I know Mike is a very solid investor and respect his opinions very much. So if he says pay attention to this or that - I will.
~ Dale G.
-
I've started managing my own investments so view Michael's site as a one-stop shop from which to get information and perspectives.
~ Dave E.
-
Michael offers easy reading, honest, common sense information that anyone can use in a practical manner.
~ der_al.
-
A sane voice in a scrambled investment world.
~ Ed R.
Inside Edge Pro Contributors

Greg Weldon

Josef Schachter

Tyler Bollhorn

Ryan Irvine

Paul Beattie

Martin Straith

Patrick Ceresna

Mark Leibovit

James Thorne

Victor Adair