Currency

Aug 15, 2017

  1. For gold to perform well against the US dollar, it needs to perform well against the Japanese yen.
  2. Please  click here now. Double-click to enlarge. 
  3. Since 2011 gold has traded sideways against the yen. Since 2013 it has been coiling in a very positive symmetrical triangle pattern.
  4. An upside breakout would usher in a major move higher for gold against both the yen and the dollar.
  5. Since 2013, the Indian market has been dealing with major duty, import rule, and hallmarking issues. The process has weighed on demand since 2012.
  6. India’s gold market has undergone an enormous restructuring in response to these issues. The good news is that the restructuring is essentially complete now. 
  7. That paves the way for higher imports on a much more consistent basis.
  8. China has made significant progress in tying gold price discovery more to physical demand versus supply.
  9. Trump has also had major success in pushing the dollar lower against most of the world’s currencies.
  10. These are not just one-time events. Events like tension in Korea can move gold $20 – $50 in a short period of time. A $100 – $200 move is possible if the tension intensifies (which it hasn’t).
  11. Unfortunately, these gains are no more sustainable than the gains from the 1980 Russian invasion of Afghanistan were sustainable.
  12. When the tension subsides, all the gains from these one-time events tends to be lost. 
  13. To move $1000 higher or more, gold needs to see a quasi-permanent ramp-up in the physical market demand against static or limited supply growth, and that’s happening right here, right now.
  14. Trump’s actions on the dollar are a long-term process. He is now beginning a trade war with China. From a gold price discovery perspective, this is vastly more important than tension involving Korea.
  15. Please  click here now. Double-click to enlarge this gold chart.
  16. Gold looks fabulous. After rallying about $90, gold is consolidating its gains. A new minor support zone at $1260 – $1280 is in play. Both traders and accumulators can be buyers in this support zone, in anticipation of a sustained rise above $1300.
  17. Please  click here now. Double-click to enlarge this daily chart of the Dow. If the US stock market suffers a major crash in September or October, there tend to be “cracks in the dike” in August.
  18. That’s what’s happening now. The uptrend is still intact, but getting tested. The next technical event to watch for is an RSI non-confirmation. This happens when the Dow makes a new high, but the RSI oscillator (shown at the top of the chart) does not.
  19. Investors can lighten up in August and essentially take a two month stock market holiday. That’s what I do. It reduces emotional stress. 
  20. My focus is more on the Asian stock markets than America, and I’ve sold about 30% of my positions into this price strength. If there is a crash, investors can buy aggressively, with a focus on banks and Asian markets.
  21. Asian consumers carry debt that is similar to US citizen debt, but they have a lot of savings and strong saving rates as a percentage of income. US citizens have almost no savings and abysmal saving rates.
  22. Asian markets will rebound from any crash with the resiliency shown by US markets during the late 1800s. In contrast, US markets are in danger of descending into a stagflationary gulag if they crash. I’m a buyer of US markets if they crash, but not with much risk capital compared to my Asian market allocation.
  23. Please  click here now. A number of influential money managers are following GDX right now, including Jeff Gundlach. The triangle formation they are following is important, but what is more exciting is the bullish volume action.
  24. Volume is rising on rallies within the triangle, and ebbing on declines. That’s very positive. Bullion and mining stock investors should be very comfortable right now. Technical breakouts appear imminent and fundamentals are strong!

Thanks! 

Cheers
st

Apr 15, 2017
Stewart Thomson  
Graceland Updates
website: www.gracelandupdates.com

World Markets Update

All eight indexes on our world watch list have posted gains for 2017 through August 14. The top performer thus far is Hong Kong’s Hang Seng with a gain of 23.86%, followed closely by India’s BSE SENSEX at 18.11%. In third is our own S&P 500 with 10.14%.

The Last Four Weeks

The tables below provide a concise overview of performance comparisons over the last four weeks for these eight major indexes. We’ve also included the average for each week so that we can evaluate the performance of a specific index relative to the overall mean and better understand weekly volatility. The colors for each index name help us visualize the comparative performance over time.

9b172d38933ad1a4713043e2016e1a20

2017 YTD Performance

Here is an overlay of the eight illustrating their comparative performance thus far in 2017.

…view more charts and analysis HERE

Fear or Fact, What Drives Your Trades & 3 Charts That Stand Out

Screen Shot 2017-08-08 at 7.48.09 AM

In this week’s issue:

  • Weekly Commentary
  • Strategy of the Week
  • Stocks That Meet The Featured Strategy

In This Week’s Issue:

– New Stockscores website coming soon
– Stockscores at the Toronto Money Show
– Stockscores’ Market Minutes Video – Avoiding Fear and Recklessness
– Stockscores Trader Training – Fear or Fact, What Drives Your Trades?
– Stock Features of the Week – Abnormal Breaks US

New Stockscores website coming soon
The new Stockscores website will be launching soon. Once it is live, you will no longer be able to subscribe to use the Stockscores Market Scan unless you have completed one of our courses. If you are subscribed before we make the switch, you will be grandfathered until you cancel your subscription.

Stockscores at the Toronto Money Show
I will be doing two presentations at the Toronto Money Show in September, one free and the other a Master Class that you can purchase a discounted ticket to until August 17th. For more information on these two presentations, click here.

Stockscores Market Minutes – Avoiding Fear and Recklessness
Traders must avoid fear and recklessness to be profitable. This week, I discuss this, my weekly market analysis and the trade of the week on LC. Click Here to Watch
To get instant updates when I upload a new video, subscribe to the Stockscores YouTube Channel

Trader Training – Fear or Fact, What Drives Your Trades?
Speaking from experience, I have found that most mistakes in trading are the result of succumbing to fear. When I say mistakes, I don’t mean losses since losing money on trades is part of trading. Instead, I mean those bad trades that we all take which don’t fit in to our trading strategy and plan.

The fear based decisions that cause us to deviate from our trading rules can be broken down in to two types.

First, the trading decisions that we make because of our fear of losing money. These are usually exit trades; we sell too early for fear that our winner will turn in to a loser. Perhaps we fail to take a trade that fits our criteria because our “common sense” tells us there is something wrong with the trade and that it can’t succeed. Maybe we enter a trade later than we should because we want to see the market prove our trading idea correct, only to end up getting in once much of the run has happened.

The second fear based trading mistakes we make are those that are the result of our fear of missing out. These tend to be on the entry; we take trades that don’t quite fit our rules because we focus on what might be, the profits that could happen. It may be that we listen to an “expert” in the media or follow the actions of the crowd and do what the headlines are telling us to do.

Have you ever succumbed to either of these fear based trading mistakes?

If you are a normal human being, I think it is highly unlikely that you have not. Since they happen to all of us, we need to figure out a solution. Fortunately, the solution is quite simple.

Rather than focus on fear, focus on fact. Make trades based on what is happening, not what you think could happen.

Many have described fear as “future events appearing real”. We don’t walk down a dark alley at night because we might get mugged. We don’t swim in the ocean because we might get attacked by a shark. We don’t fly on a plane because it might crash.

When we focus on what might happen, what our fear tells us to do, we typically ignore probability. The probability of getting attacked by a shark is extremely low. Last year, you actually had a greater chance of dying taking a selfie photograph than by being attacked by a shark. If we focus on fact, we get better results.

This does not mean you should ignore fear. It is there to protect us and, when probability is on the side of the decision, it is best to listen to fear. I stopped flying small airplanes because the statistics showed that it was a dangerous thing to do. I still trade stocks because I have strategies that put the statistics in my favor.

When you trade, take your focus off of your emotion and look at the facts. Develop a trading strategy that puts probability for profit in your favor. Have a process in place to assess the facts and take the trades that meet your requirements. Overcome fear in favor of fact.

This week, I looked at the Abnormal Gainers US on Monday and checked the charts for breaks of downward trend lines after a rising bottom had formed. This is a good turnaround indicator, here are a few charts that stand out:


1. PNK
PNK tried to break its pull back last week but failed, it made the break today on good volume. Support at $18.93

Screen Shot 2017-08-15 at 6.42.45 AM

2. QRVO
QRVO breaks up from a rising bottom with average volume. Support at $64.70.

Screen Shot 2017-08-15 at 6.43.01 AM
3. INTU
INTU has been quiet for the past two months but broke higher from a rising bottom today. Support at $134.80

Screen Shot 2017-08-15 at 6.43.17 AM

References

  • Get the Stockscore on any of over 20,000 North American stocks.
  • Background on the theories used by Stockscores.
  • Strategies that can help you find new opportunities.
  • Scan the market using extensive filter criteria.
  • Build a portfolio of stocks and view a slide show of their charts.
  • See which sectors are leading the market, and their components.

    Disclaimer
    This is not an investment advisory, and should not be used to make investment decisions. Information in Stockscores Perspectives is often opinionated and should be considered for information purposes only. No stock exchange anywhere has approved or disapproved of the information contained herein. There is no express or implied solicitation to buy or sell securities. The writers and editors of Perspectives may have positions in the stocks discussed above and may trade in the stocks mentioned. Don’t consider buying or selling any stock without conducting your own due diligence.

Dot Com Bubble Do-Over?

Our recent analysis suggests we may be setting up to repeat history in an odd and dangerous manner.  As market technicians, part of our job is to work with numbers, find patterns and attempt to predict future price moves in US and Global markets.  As you can imagine, it is not always easy to accurately predict the future.  Still, we take on the challenge and truly enjoy being able to find and share trading strategy concepts with our ActiveTradingPartners newsletter.  As such, we are sharing this recent technical research data with your today.

Recently, the ActiveTradingPartners research team identified a unique pattern in the VIX that allowed us to accurately predict the June 29 VIX Spike nearly 3 weeks in advance.  Also, on July 30th, we predicted a big decline in the NASDAQ during August. It also allowed us to know that VIX Spikes were possible on other future dates – such as the most recent date near August 4th.  Even though the current VIX Spike did not hit exactly on the August 4th cycle date, the actual VIX Spike move happened only two trading days after our predicted date and the VIX has rallied over 90% from recent lows.  Sometimes, analysis like this allows us to know months in advance that a cycle or critical event may have a higher probability of happening.  This allows us to plan and profit from our research.

Today’s research correlates to the recent price moves in the XCI index (Computer Technology), NASDAQ and US Majors.  The premise of this research is that the past 4+ years have resulted in a global investment in Technology firms as a result of lower ROI in most other sectors.  This focus on technology investing is uniquely similar to the XCI Index DOT COM rally from the late 1990s and early 2000s.  We are attempting to verify our presumptions and analysis by using core technical analysis techniques as well as fundamental price analysis.

We’ll start by looking at the price activity leading up to the 2000 DOT COM bubble burst. Initially, our analysis focused on the similarities in price action setting up this price move. The Accumulation, Exuberation/Pause, Hype and eventual CRASH phase. In 1995, the Accumulation phase initiated after a nearly 95% rally from 13+ months earlier (1994 – 462 days total). Currently, the Accumulation phase initiated after a 100%+ rally from 13+ months earlier (2009 – 427 days total). Subsequently, the Accumulation phase lasted 1057 days resulting in a 238%+ advance in 1998. The current Accumulation phase lasted 1456 days resulting in a 77%+ advance in 2014. Interestingly, the 1998 advance totaled 472.50 pts while the 2014 advance totaled 594.00 pts – resulting in a 125% advance size increase.

The Exuberation/Pause phase in 1999 lasted 252 days and resulted in a 207.19 pt move (+31.51%). The Exuberation/Payse phase in 2016 lasted 889 days and resulted in a 288.26 pt move (+21.15%). The more recent phase took 3.5x longer (time) to result in 139% greater price advance (which was actually a reduced percentage move of only 67% of the 1999 advance.
I advanced the term WEEKS where is should have been days.

Many analysts may be quietly stating, “all of this can be attributed to relationships of percentage values vs higher price valuations”, which is of course true.  Our attempt at dissecting these moves is to try to understand the propensity and strength of any future moves.

Lastly, the HYPE phase lasted 39 weeks in 2000 ending with an advance of 895.23 pts (+97.94%) from the PAUSE/FLAG breakout in 1999.  The current HYPE phase lasted 53 weeks ending with an advance of 674.54 pts (+40.26%)  from the PAUSE/FLAG breakout in 2016.  The resulting current HYPE price advance is 25% lesser than the 2000 move and results in a nearly 60% decrease related to the total percent swings.

2000 DOT COM – XCI Index Chart

XCI 2000 DotComBust Weekly F

 2017 DOT COM – XCI Index Chart

XCI_2017_DotComBust_Weekly_F

The 2000 total phase advance lasted 220 weeks and resulted in a price advance of +1607.53 pts (+802.39%).  The 2017 total phase advance lasted 436 weeks and resulted in a price advance of +1878.21 (+402.97%).  The percent values of each move represent vastly different results, yet the total price moves differ by only 17%.  We are certain some of these values and percentage representations are sparking interest in some of you as you may understand Fibonacci, Gann and other price analysis techniques.

The key to understanding these similarities is to understand the price sometimes moves in similar, not exact, setups and that we should never discount the possibility that markets are setting up for another massive move.  Considering these price and relationship values, it is our perception that any global event, liquidity collapse or massive terrorist event could present a scenario that may result in a repeat of the 2000 DOT COM market collapse.  Our premise is that the US has been an investment safe harbor for many and that Technology (FANGs and others) have benefited greatly from the global market weakness over the past 7+ years.  It is our opinion that the capital that has been allocated into these global technology giants has, as in the past, setup a potential for history to repeat itself (given the right type of events/circumstances).

COMBINED DOT COM – XCI Index Charts

XCI_2017_DotComBust_Weekly_Combined_F

Our recent VIX Spike analysis shows we should expect future VIX Spikes on Aug 23rd, Sept 11th or 12th and finally Sept 28th or 29th.  Assuming the relationship between the current price setup and the past setup is relative to the types of relationships we’ve studied so far, we can predict the following :

The initial swing low after the ultimate high (2000) resulted in a 572.02 pt move (a 31.62% correction over 10 weeks).  Any current correction could result in an 8~15.5% price correction over 7~15 weeks.  This would put our estimates of a price low near 2152~1980 on or near Sept 25th or Oct 23rd.  This price low would be followed by 4~12 weeks of price advance setting up a right shoulder near 2150~2256 (possibly).  Following that, we would see the low price rotation broken by extreme selling pressure and ultimate low target near 770~581 (resulting in a 63~69% correction from the highs).

Do we know this WILL happen?  NO.  Can we estimate the probability of it happening as we predicted? NO.  How can we tell if this will play out as we are predicting?  If the market continues to break down and begins to form the right shoulder, then we would consider, at least this first phase, to be technically accurate.  If it fails to move lower to establish this move, then we would consider this a technical breach of our research and attempt to reevaluate our theories.

Thus, what we can do at this point is alert you to the potential that a massive Head-n-Shoulders formation may be setting up in the global/US markets related to a potential Tech Bubble.  The proof will come with confirmation of our analysis or the failure of our analysis as price plays out over the next few weeks.

Still, the correlation of the VIX SPIKE dates,  Aug 23rd, Sept 11th or 12th and finally Sept 28th or 29th, are interesting because our initial analysis of any price low indicates a potential low price date range near September 25th.  Should this become true, an 8~15% correction in the XCI would clearly result in a 4~9%+ correction in the NQ and would correlate with our VIX Spike analysis almost perfectly.

The only thing we can do is be aware of these relationships and price patterns that are setting up and plan our trades properly.  Every trade includes risk, attempting to manage that risk is the objective of most traders.  At this point,  Aug 23rd, Sept 11th or 12th and finally Sept 28th or 29th are critical dates to keep in mind as the future plays out before us.  Watching for these moves and being aware that they could be setting up for a massive price swing lower are important factors to consider and being able to protect open LONG positions would not be a bad idea over the next few months.

The only way one can tell if predictions of the future are going to be accurate or not is to wait for the future to get here and see how well these predictions worked out.  So, we wait with the understanding that we are watching for confirmation or failure of our analysis with each week.

If you like our research and analysis and want to learn more about our forecasting and trade alert services, to see what we can offer you. We provide daily market updates, clear and concise trading triggers/signals, advanced research and analysis of the US and global markets and more.

Chris Vermeulen

The Guns of August, The Trade Set-Up & Removing your Rose Colored Glasses


Today I am going to lay out the case of a major market top and how it fits into the geopolitical backdrop of today. We then profile the trade set-up to look for and finally I will forcefully remove your Rose Colored Glasses you have been wearing since January 2017.

In Barbara Tuchman’s “The Guns of August” she argues that August 1914 was when the Gilded Age died and the modern era actually began. The book opens with the famous depiction of Edward VII’s funeral in 1910 attended peacefully by all the kings of Europe. Never again would the body of world leaders be unified and cut from a similar cloth. The war ushered in a new world, not recognizable from the past. Not since that time have we witnessed such diplomatic folly as in the month of August 1914. Today we wonder are we witnessing a similar conflict between a super power and the client state of China which is an emerging super power?  Could it unfold in a similar fashion?

Since May I have chronicled the topping process associated with a post bubble contraction. We have witnessed the following sequence:

1 The Gold-Silver ratio initially warning of an upcoming credit contraction in the future.

2. European stocks putting in a top in the traditional time window of May-June

3. USA stocks embarking on a final run for the roses, one last hurrah over the summer.

4. The Gold-Silver ratio signaling a confirmation of its original signal.

5. Yield curve flattening and credit spreads widening

6. Investor psychology embracing market top behaviors.

7. An initial crack in the US indexes in the time window of August or September.

The Topping Process

Over the summer we have watched the indexes relentlessly rise despite narrower breath. The FAANGs drove the NASDAQ and Boeing drove the Dow over the past 6 weeks. The DOW being a price weighted index, was inordinately influenced by Boeing, now a $240 stock. Boeing’s rise accounted for 75% of the DOW’s gain since the beginning of July. Strip Boeing out of the DOW and the index barely even rose… Same with the FAANG’s effect on the NASDAQ.

This of course is classic topping action. It masks the underlying exhaustion which has been occurring in individual issues. The exhaustion expressed itself in a lack of volatility. On August 8th the S&P 500 had gone 13 days in a row with less than a 0.3% fluctuation. This has never occurred since records have been kept since 1927.  This compression then expressed itself with the VIX exploding over 80% in a raucous 3 day move.

Bearish market signals have been evident to the few who cared to interpret the charts. Let’s take a look at some of the flashing red flags available to all who care to see:

S&P 500 Orthodox Broadening Top

Pull out your copy of the bible of technical analysis: Edwards and Magee. Look under the index for “The Orthodox Broadening Top”. The example they use is Air Reduction Co. from 1929. I will scan and post below:

EM-Broadening-top-Air-Reduction-759x1024


E&M remind us this type of top comes from low volume markets (check) and it is precisely defined on the chart (check). It’s definition is:

“It has three peaks at successfully higher levels and, between them, two bottoms with the second bottom lower than the first. The assumption has been that it has been completed and an in effect as an important reversal indication just as soon as the reaction from its third peak carries below the level of its second bottom”


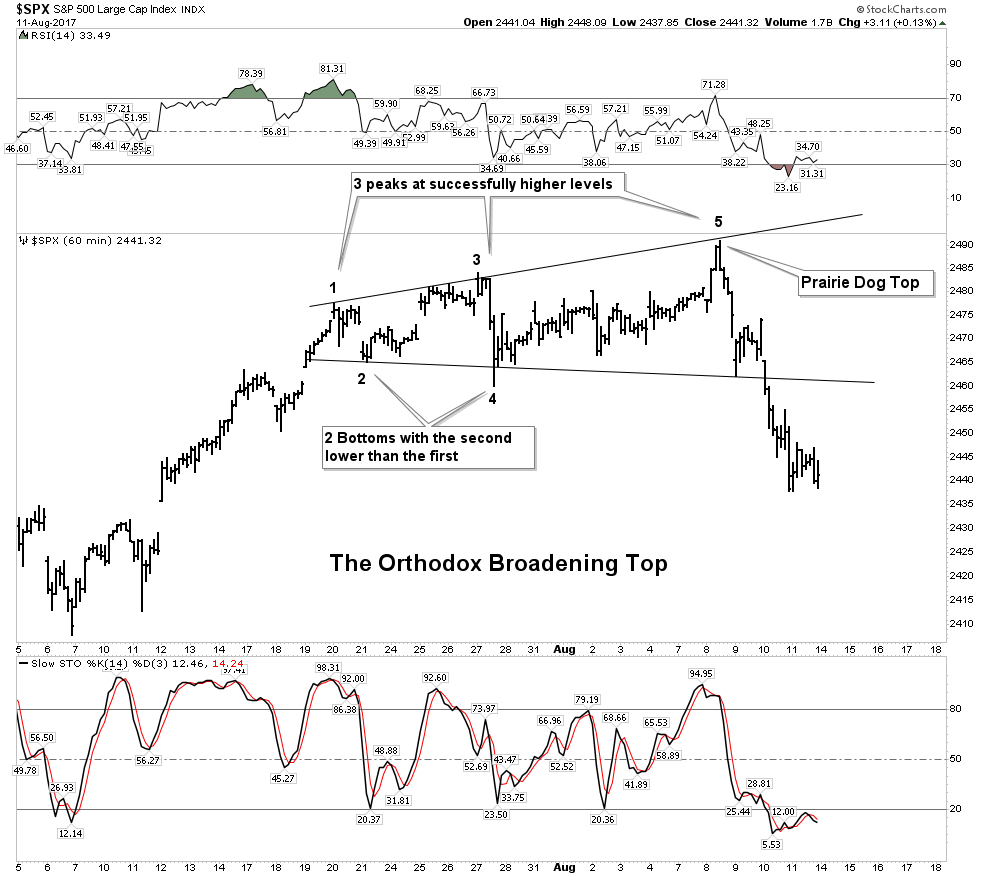
Knights, I believe in making charts as simple and uncluttered as possible. Clean charts deliver the most powerful messages. This chart above should make you sit up and take notice. It is classic, right out of the pages of the Edwards and Magee reference book.

My analysis of this chart actually shows weak exhausted action. E&M state that 4 out of 5 examples of this pattern have a re-test of high #3 (point #5). This re-test often exceeds the high by up to 3%. We see this re-test in the above example in Air Reduction Co labeled as 5b.  In our present day case we see the S&P spike high in a prairie dog top with no ability to rally for a re-test. This is a case of exhaustion and in my analysis is quite foreboding.

I emphasize that E&M characterize this pattern as “extremely bearish” and it depicts the last stages of a Primary Uptrend. That’s right,- PRIMARY. This was the principle pattern that exhibited itself in numerous individual issues in the 2 months leading into the crash of 1929.

Within this current broadening top formation we can also see two loosely formed H&S tops as well.  Bottom line: This is a treacherous reversal pattern.

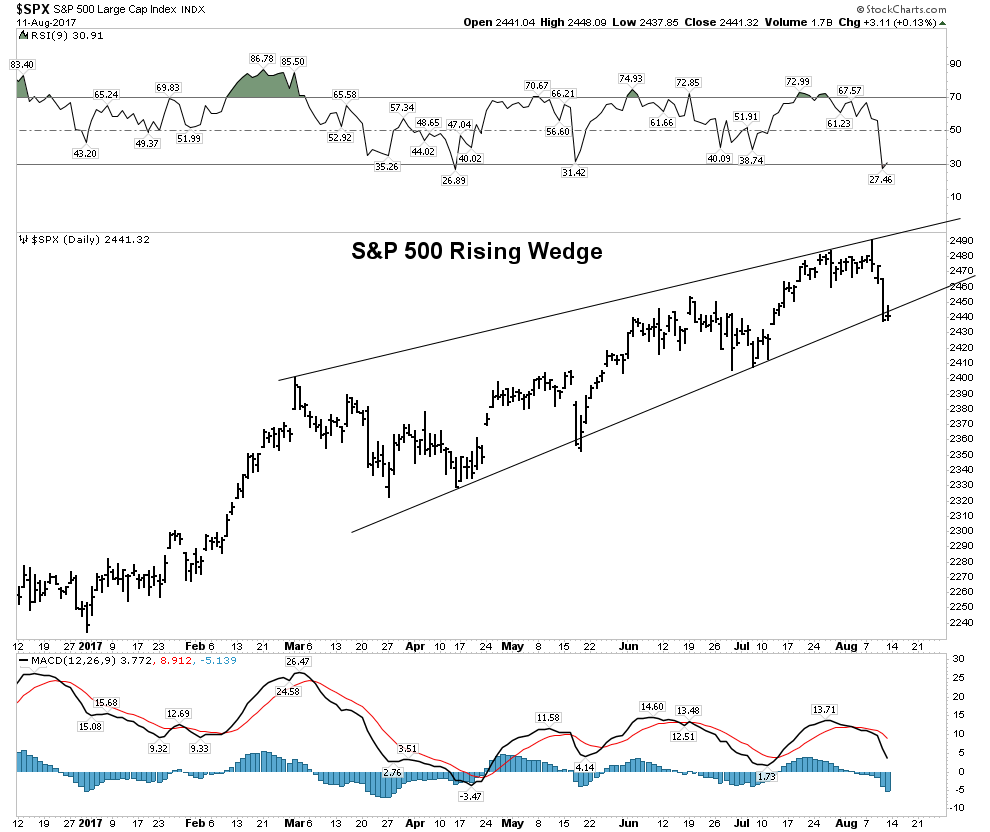
S&P 500 Bearish Rising Wedge

If we step further away and look at a daily chart over the past 8 months we see the S&P 500 forming a presumedly bearish rising wedge.  I will cover the investment set-up later on at the end of this section.


Red Flags Everywhere

The FAANG stocks have risen relentlessly all year long, however recently have been broadcasting major trouble ahead. Let’s take a look at some of the red flags:

…..continue reading HERE