Gold & Precious Metals

 POITOU, FRANCE – The Dow rose another 100 points yesterday. Can anything stop this bull market?
At least we know the answer to that question: Yes.
When?
Longtime Diary sufferers know better than to trust our market timing advice. So rather than rely on our instincts, the Bonner & Partners research department has developed a Doom Index to guide us.
What is it saying now?
Mixed Bag
For an update, we turn to our ace analyst in the back room, Joe Withrow.
But first, a bit of background…
The Doom Index is made up of 11 indicators:
-
Bank loan growth
-
Credit downgrades
-
Junk bond prices
-
Stock market valuations
-
Margin debt
-
Investor sentiment (contrarian indicator)
-
Manufacturing sentiment
-
Railcar traffic
-
Nonfarm payrolls
-
Household debt to disposable income
-
Quarterly building permits
Joe and his team update these on a quarterly basis. And each quarter, they award Doom Points based on what these indicators are saying.
When the index hits six or seven Doom Points, it’s time to be cautious. When it hits eight or nine Doom Points, it’s time to raise the tattered “Crash Alert” flag.
Anything over a nine means stocks – and the economy – are in deep trouble.
So what’s the latest? Joe:
Most second-quarter data has come in. But we are still waiting for railcar use and building permit numbers. The ISM Manufacturing Index came back with another relatively strong reading. I expect we won’t see much of a drop-off with these yet.
The Doom Index stands at six now, which is our “soft warning” level.
Here are the highlights from the second quarter: The Fed reported credit growth at 0.8%. This number is down from the Fed’s first-quarter report of 1.5%.
We also saw an uptick in corporate bond downgrades this month. You can almost feel the tension in the credit markets. But junk bond prices are still holding up strong.
Stock valuations remain high relative to historic levels. But our bullish investor sentiment indicator is coming back relatively low. The euphoria that precedes a major crash is not there.
Household debt-to-income numbers are still at moderate levels as well. On the other hand, auto loans and student loans are through the roof.
So, all in all, the data coming in for the second quarter is a mixed bag.
Permanent Loss
We’re no better than anyone else – and perhaps worse – at telling you when the next crash will come. Or even how. But that it will happen… we have no doubt.
And when it does, the loss – judging by similar events in the past – is likely to be more than 50%.
Worse, the loss could be almost permanent – as it has been in Japan.
The Japanese central bank has used every trick in the book to try to get its stock market back in the black – ZIRP (zero-interest-rate policy), NIRP (negative-interest-rate policy), QE (quantitative easing), and the biggest government debt burden in the world.
But stock market prices are still less than half of what they were in 1989… 28 years ago.
As an investor, your goal is to try to get a decent return on your money without giving it up in a downturn. U.S. stocks come with a big risk. You want to avoid it.
This week, companies with a total of $3 trillion in market value will announce their results. Unless there are some surprises, they will show modest increases in earnings.
But wait; there’s something fishy here. Since 2009, earnings per share for U.S. companies have increased a spectacular 265%. Sales, however, have gone up only 32%.
How is that possible? Another miracle?
Easy Money
When the cost of borrowing is low, companies prefer to get financing from debt. When it is high, they switch to equity – they issue stock.
Debt financing costs are as low as they have ever been; naturally, shrewd CFOs have borrowed heavily, increasing corporate debt by more than $1 trillion – a 50% rise – since the bottom of the last crisis.
What do they do with the money?
The economy is barely expanding. The typical American has no more real buying power than he had 35 years ago. It’s hard to justify investments in extra goods and services when your customers have no more money to buy your output.
So what do you do?
You buy back your own shares and cancel them. This removes shares from the market, increasing earnings per share for the remaining shares. (Each remaining share then represents a higher portion of the company’s earnings.)
Since 2009, the open market share count has gone down as earnings have gone up. According to Real Investment Advice, this has added $1.60 per share to the earnings of the average company.
Instead of investing its money to produce more at a lower cost, corporate America has used debt financing to buy back shares at the highest prices in history.
Corporate chiefs get stock option bonuses (because share prices go up). But now the company is deeper in debt and floating on a tide of easy money.
Tides go in and go out. This one will be no exception. And when this one goes out, corporate buyers will disappear – along with everyone else.
Dogs of the World
So what’s an investor to do?
Again, we are incapable of giving investment advice. But we can tell you what we do.
For our own family account, we have money in stocks, gold, cash… and real estate.
Since we think we are nearing a financial catastrophe – this post-1971 credit bubble must pop sometime – we keep nearly half our liquid wealth in cash and gold, more than we would normally want.
As for stocks, we are never “in the market,” merely hoping that it will go up. Instead, we have two main strategies.
First, we rely on colleague Chris Mayer to find “special situations,” companies we want to own regardless of the up and down trends on Wall Street.
[Editor’s Note: Bill recently committed $5 million from his family trust to following Chris Mayer’s recommendations. Bill explains why right here.]
Second, we also follow a strategy based on Michael O’Higgins’ “Dogs of the Dow” approach.
O’Higgins found that simply buying the cheapest stocks can pay off.
The problem is stocks are often cheap for good reason. Companies go broke. Their stocks go to zero and never come back. That almost never happens with entire stock markets.
Which is why we’ve modified O’Higgins’ approach. Instead of buying the cheapest stocks on the Dow, we buy the cheapest country stock markets around the world.
This is our “Dogs of the World” portfolio.
Pampered Pooch
Last week, we reported that the U.S. stock market is now the world’s most expensive, judged by a range of different tried-and-tested valuation metrics.
That makes the U.S. the least-attractive country market right now.
In our Dogs of the World portfolio, we look for the world’s cheapest country stock markets and update it annually. One choice. Once a year. Easy-peasy.
Of course, this is not for people who check their portfolios daily… or even monthly.
Among the world’s cheapest now, for example, are Turkey and South Korea.
Turkey is cheap because its government just narrowly survived a coup d’état in which military jets tried to shoot down the president’s plane.
South Korea is cheap because North Korea aims its missiles in that direction.
Maybe these dogs will turn out to be good investments. Maybe not. But by our reckoning, they are safer bets than the pampered pooches of North America.
Regards,
Bill


Many of the reports published that cover oil consumption and how quickly consumers will embrace Electric Vehicles (EV) paint a far rosier outlook for the future of oil than the facts dictate. The reason is simple; most of these reports tend to be written or sponsored by big oil and so they tend to be biased. We are not stating that this is the end of oil, but its glory days are probably behind it. One thing is obvious; the peak oil theory experts are and were always full of rubbish. In fact, we penned several articles over the years covering this issue the latest of which was titled “peak oil debunked”.
Factors against big oil
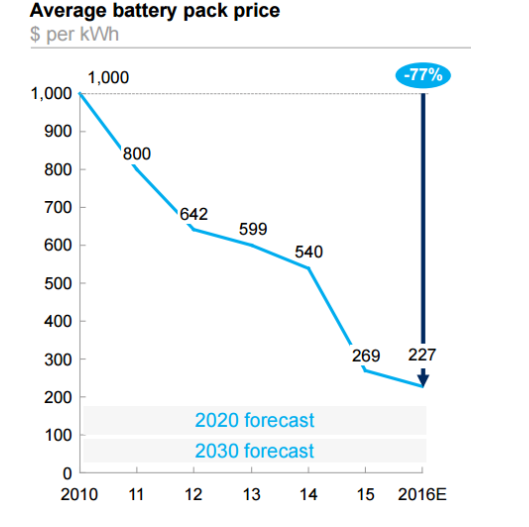
Battery prices are plunging
The most expensive component in EV’s boils down to the battery. Battery prices have been plummeting at a very rapid rate. In 2016, Bloomberg noted that battery prices dropped 35%; bear in mind that was at the beginning of 2016. Battery prices have continued to plummet since then; in fact, the latest survey illustrates that battery prices have dropped 80% in just six years
John McElroy from Wards Auto penned an article where he states that several Experts at recent CES show stated that the DOE’s target of $125 per KW hour by 2022 might be conservative. They felt that the costs would drop below $100 before 2020 and shortly after that to around $80 per KW hour. Bloomberg goes on to state that by 2040, 35% of all vehicles sold would be electric, but this figure might be conservative.
If battery prices drop to below $100 per KW hour, then traditional cars could face stiff competition. Many experts believe that at $100 per Kwh is the point where the cost of the electric car becomes cost competitive with today’s internal combustion vehicles.
Lithium ion battery prices are now below $140 per KWh. Given the speed at which battery prices have dropped over the past six years, $80 could turn out to be a conservative target. If a price of $100 per kWh makes the EV competitive with today’s vehicles, then it appears that EV’s could put pressure on Big oil and the conventional auto industry a lot sooner than most experts are predicting.
The China factor
China is putting additional pressure on the Lithium Battery sector:
“According to Gaogong Industry Institute, some EV makers in China have proposed that battery vendors cut prices by 35-40% in 2017. Our China analyst Jack Lu sees this proposal as likely to proceed, as some battery vendors in China could still make a decent profit after such a cut.” Barrons
If such cost efficiencies are being achieved in 2017 and battery makers in China can still make a profit, it stands to reason that prices could easily drop another 50% between now and 2022. In fact, we feel that battery prices will probably be trading below $80 by 2020. Given the speed at which computing power is expanding every year, it is almost a given that engineers will find new ways to improve the efficiency of today’s battery while lowering its cost. Look at any new product; the initial cost was always high, but once mass production started, the cost plummeted.
Conclusion
New technology that’s gaining traction is nearly always disruptive, and those that fail to recognise its force are usually wiped out. Big oil assumes that demand will continue to rise due to higher automobile ownership globally. What they fail to recognise is that in the years to come, more individuals might opt for an EV as opposed to a car with an internal combustion engine.
EV technology has been around for a long time (over 150 years), but it never advanced because of its prohibitive cost. The cost has dropped, and EV’s have finally broken the 200-mile range barrier. With technological advances, the cost will continue to drop, and the range will continue to rise.
Big auto understands that change is coming and it’s coming fast; from Nissan (T:7201) to Ford (NYSE:F), auto manufacturers are spending billions gearing up for the future as they seem to understand that price is the only factor preventing many from embracing an EV. Ford is going to spend $4.5 billion from 2017-2020 on EV development. It is projecting that its electric SUV will have a range of 300 miles. Big Auto would not be spending billions if it did not foresee a massive change in the years to come.
Big oil could be facing a tumultuous future. However, this does not mean that oil prices are going to tank overnight. In Feb 2016, when oil was trading well below $30.00, we penned two articles on oil one in January 2016 and one in Feb 2016 where we stated that oil was likely to bottom and trend upwards.
While the outlook for big oil is not very bright in the long run, in the intermediate time frames, oil could continue to trend higher as it is still cheaper to buy a conventional oil powered car as opposed to one that is powered by a battery.
Final thought
Smart phones were almost unheard of 10 years ago; they were very expensive and clumsy. Today the prices have dropped so much that almost everyone has a smart phone. Most people could not imagine living without one. Could the same thing hold true for the electric vehicle of the future? Time will tell, but history proves that new technology is embraced the moment it becomes affordable; the current trajectory indicates that the most expensive component of an EV is going to continue dropping at a very rapid rate clip.

The dollar has been taken beating on ‘false promises’ of any major fiscal reform from the Trump administration.
On July 18th, 2017, President Trump lacked the support of the U.S. Senate to pass any new measures on healthcare bill, in the U.S. At least, three Republicans along with the Democrat lawmakers have expressed opposition for any changes to the current “Obamacare”.
All investors have their doubts that the Trump Administration might not be able to implement tax reform. This was the key component of their infrastructure spending proposals which should have been implemented within this year or early 2018.
Bitcoin prices has been able to benefit from the “return in risk aversion” in the markets on fresh catalysts. Bitcoin prices, http://www.marketwatch.com/story/cybersecurity-legend-bets-his-manhood-that-bitcoin-reaches-500000-mark-with-three-years-2017-07-18?mod=MW_story_top_stories, plunged more than 25% over the last weekend of July 17th, 2017. Bitcoin, lost $10 billion, in market cap due to the crash. On Monday morning, July 17th, 2017, the markets recovered 30-40%. There is grave concern about the potential transition on the Bitcoin block chain platform. On August 1st, 2017, Bitcoin improvement, proposal, 148 (BIP148), is intended to allow the Bitcoin network to scale more efficiently is scheduled to be activated. The majority of developers do not agree on this new proposal. Currently, 43% of bitcoin’s mining power is seeking a new paradigm!
It is possible that Bitcoin could split into two or more separate cryptocurrencies. Miners are reporting progress in solving ‘hard fork issues’ which is shoring up confidence in the industry, in total.
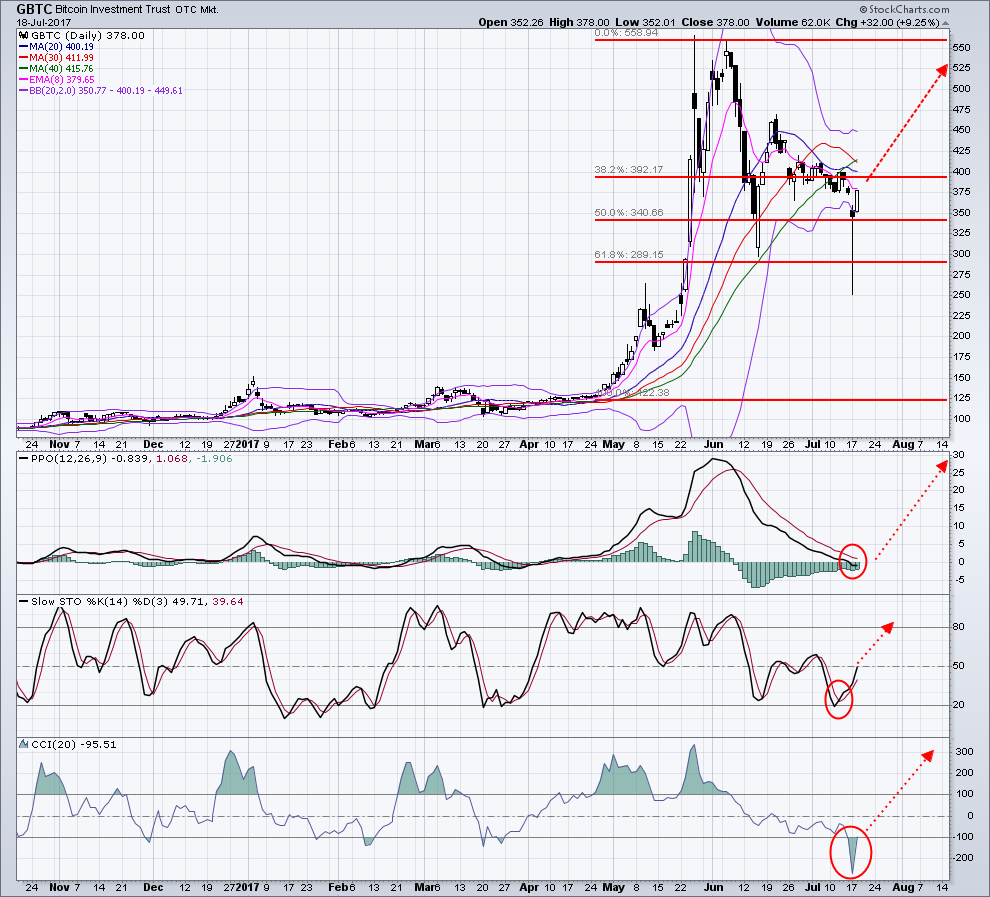
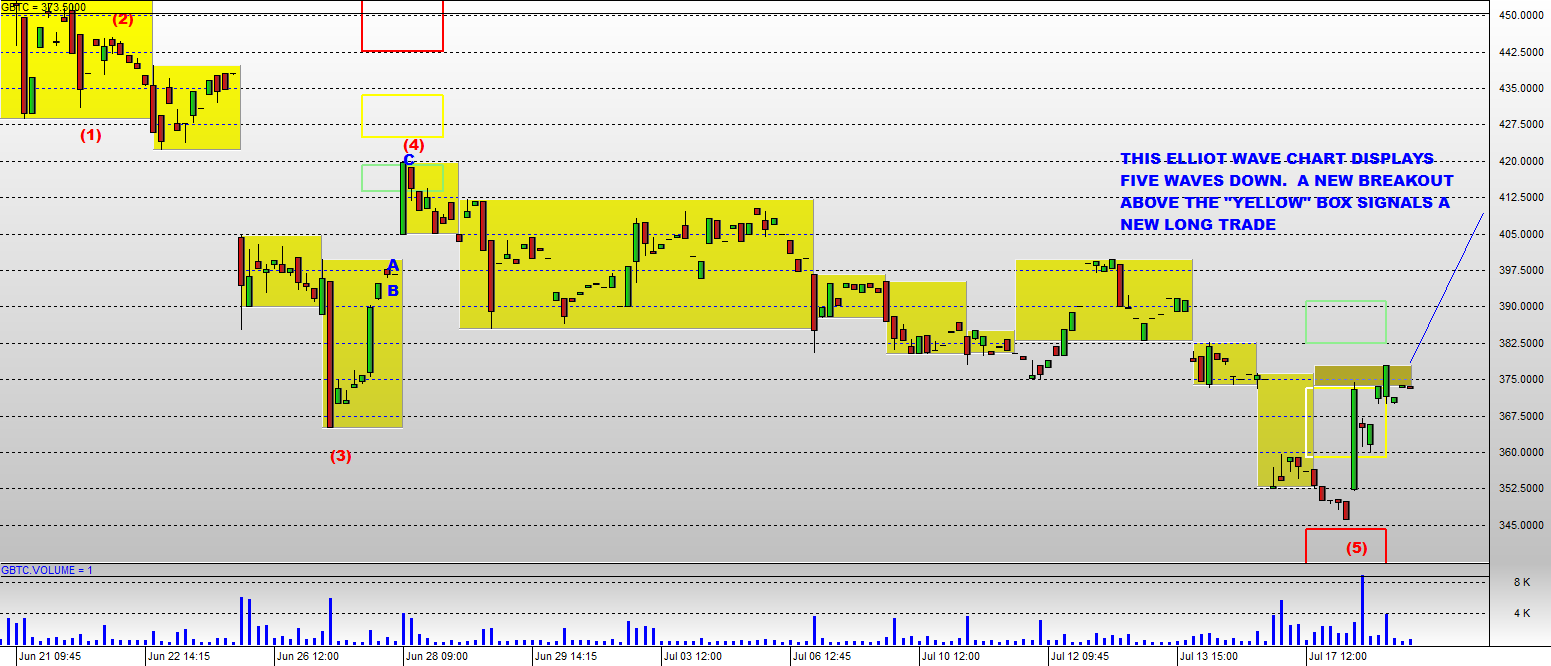
The Bitcoin Investment Trust Fund, GBTC is the instrument that is very active and tradable. I have put together three charts showing that it is currently at Fibonacci retracement level at 50% reflecting its’ next potential support area.
I has been involved in the cryptocurrency area since the very beginning and will now start covering new trade setups similar to last years long-term buy signal in Bitcoin I shared last July which, bit coin rallied over 350% since then. There is a great deal of BUZZ now emerging on Main Street and I will make you money in this ‘new asset class’ as well as keeping you regularly informed.
Know where the markets are headed and trade my signals at www.TheGoldAndOilGuy.com
Chris Vermeulen


 Eight years after the global financial crash and despite fears of tightening, stock markets are near historic records.


